

Emergence of bimodal cell population responses from the interplay between analog single-cell signaling and protein expression noise
- PMID: 22920937
- PMCID: PMC3484110
- DOI: 10.1186/1752-0509-6-109
Emergence of bimodal cell population responses from the interplay between analog single-cell signaling and protein expression noise
Abstract
Background: Cell-to-cell variability in protein expression can be large, and its propagation through signaling networks affects biological outcomes. Here, we apply deterministic and probabilistic models and biochemical measurements to study how network topologies and cell-to-cell protein abundance variations interact to shape signaling responses.
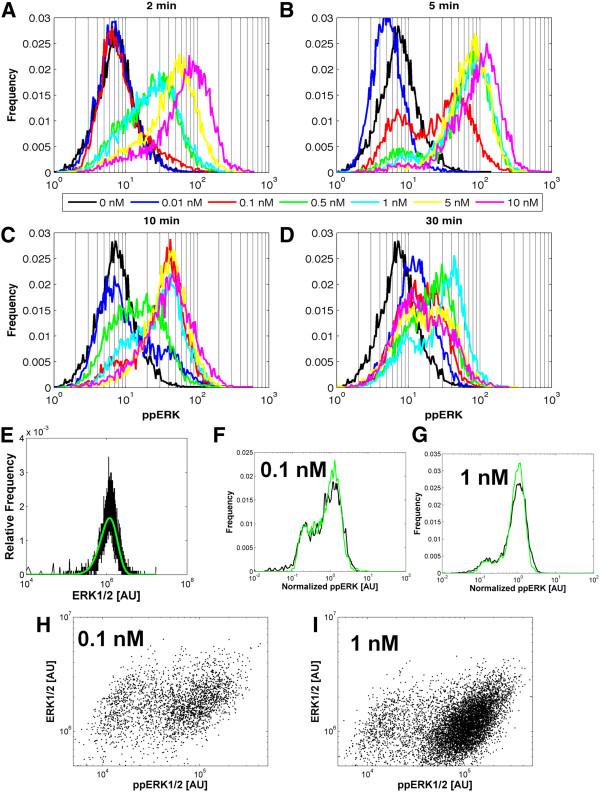
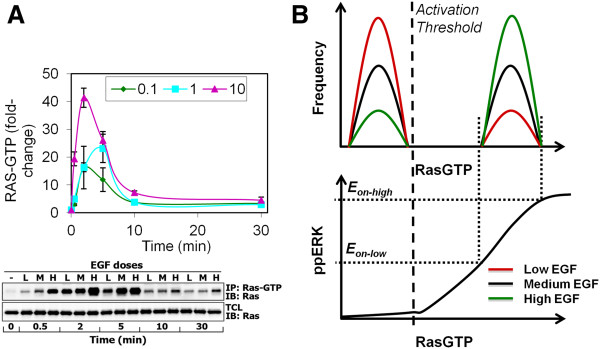
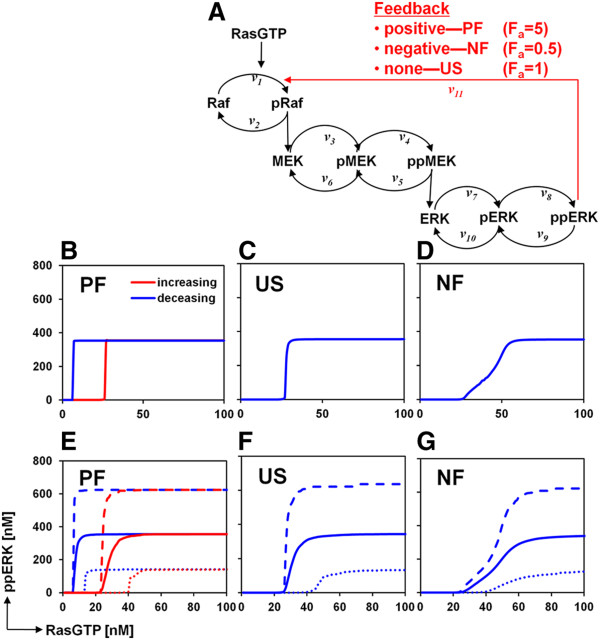
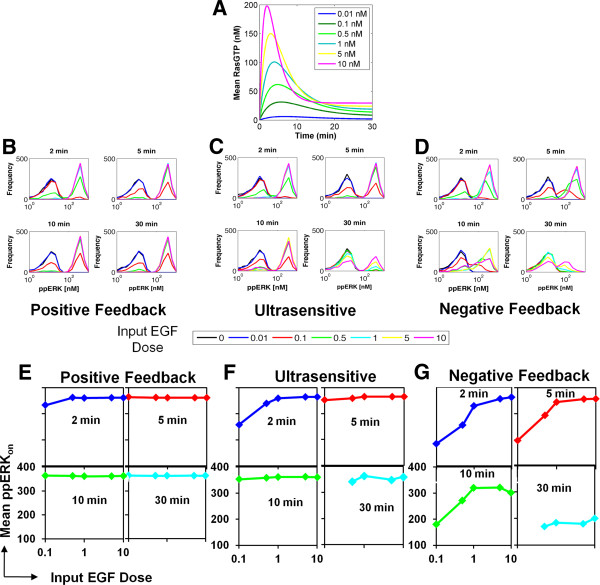
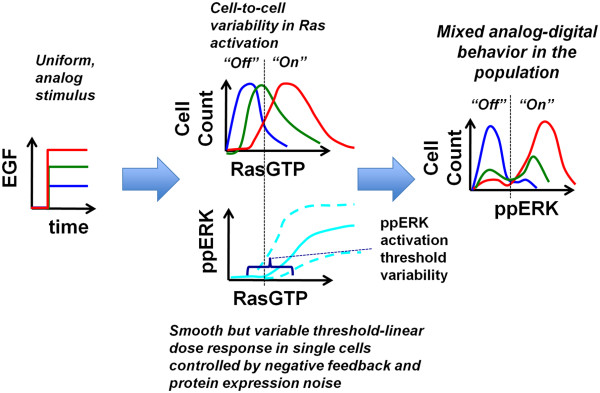
Results: We observe bimodal distributions of extracellular signal-regulated kinase (ERK) responses to epidermal growth factor (EGF) stimulation, which are generally thought to indicate bistable or ultrasensitive signaling behavior in single cells. Surprisingly, we find that a simple MAPK/ERK-cascade model with negative feedback that displays graded, analog ERK responses at a single cell level can explain the experimentally observed bimodality at the cell population level. Model analysis suggests that a conversion of graded input-output responses in single cells to digital responses at the population level is caused by a broad distribution of ERK pathway activation thresholds brought about by cell-to-cell variability in protein expression.
Conclusions: Our results show that bimodal signaling response distributions do not necessarily imply digital (ultrasensitive or bistable) single cell signaling, and the interplay between protein expression noise and network topologies can bring about digital population responses from analog single cell dose responses. Thus, cells can retain the benefits of robustness arising from negative feedback, while simultaneously generating population-level on/off responses that are thought to be critical for regulating cell fate decisions.
Figures
Similar articles
-
Signaling to extracellular signal-regulated kinase from ErbB1 kinase and protein kinase C: feedback, heterogeneity, and gating.J Biol Chem. 2013 Jul 19;288(29):21001-21014. doi: 10.1074/jbc.M113.455345. Epub 2013 Jun 10. J Biol Chem. 2013. PMID: 23754287 Free PMC article.
-
Sampling-based Bayesian approaches reveal the importance of quasi-bistable behavior in cellular decision processes on the example of the MAPK signaling pathway in PC-12 cell lines.BMC Syst Biol. 2017 Jan 25;11(1):11. doi: 10.1186/s12918-017-0392-6. BMC Syst Biol. 2017. PMID: 28122551 Free PMC article.
-
Modeling Cellular Noise Underlying Heterogeneous Cell Responses in the Epidermal Growth Factor Signaling Pathway.PLoS Comput Biol. 2016 Nov 30;12(11):e1005222. doi: 10.1371/journal.pcbi.1005222. eCollection 2016 Nov. PLoS Comput Biol. 2016. PMID: 27902699 Free PMC article.
-
Systems-level interactions between insulin-EGF networks amplify mitogenic signaling.Mol Syst Biol. 2009;5:256. doi: 10.1038/msb.2009.19. Epub 2009 Apr 7. Mol Syst Biol. 2009. PMID: 19357636 Free PMC article.
-
Dynamic characteristics of transient responses.J Biochem. 2005 Jun;137(6):659-63. doi: 10.1093/jb/mvi084. J Biochem. 2005. PMID: 16002986 Review.
Cited by
-
Noise-driven causal inference in biomolecular networks.PLoS One. 2015 Jun 1;10(6):e0125777. doi: 10.1371/journal.pone.0125777. eCollection 2015. PLoS One. 2015. PMID: 26030907 Free PMC article.
-
A statistical approach for identifying differential distributions in single-cell RNA-seq experiments.Genome Biol. 2016 Oct 25;17(1):222. doi: 10.1186/s13059-016-1077-y. Genome Biol. 2016. PMID: 27782827 Free PMC article.
-
Signal Transduction at the Single-Cell Level: Approaches to Study the Dynamic Nature of Signaling Networks.J Mol Biol. 2016 Sep 25;428(19):3669-82. doi: 10.1016/j.jmb.2016.07.009. Epub 2016 Jul 16. J Mol Biol. 2016. PMID: 27430597 Free PMC article. Review.
-
Boolean modeling of mechanosensitive epithelial to mesenchymal transition and its reversal.iScience. 2023 Mar 2;26(4):106321. doi: 10.1016/j.isci.2023.106321. eCollection 2023 Apr 21. iScience. 2023. PMID: 36968076 Free PMC article.
-
Quantitative analysis of receptor tyrosine kinase-effector coupling at functionally relevant stimulus levels.J Biol Chem. 2015 Apr 17;290(16):10018-36. doi: 10.1074/jbc.M114.602268. Epub 2015 Jan 29. J Biol Chem. 2015. PMID: 25635057 Free PMC article.
References
Publication types
MeSH terms
Substances
Grants and funding
LinkOut - more resources
Full Text Sources
Miscellaneous
