. 2012 Aug 24:13:424.
doi: 10.1186/1471-2164-13-424.

H3K9 and H3K14 acetylation co-occur at many gene regulatory elements, while H3K14ac marks a subset of inactive inducible promoters in mouse embryonic stem cells

Affiliations

H3K9 and H3K14 acetylation co-occur at many gene regulatory elements, while H3K14ac marks a subset of inactive inducible promoters in mouse embryonic stem cells

Krishanpal Karmodiya et al. BMC Genomics. .

Abstract

Background: Transcription regulation in pluripotent embryonic stem (ES) cells is a complex process that involves multitude of regulatory layers, one of which is post-translational modification of histones. Acetylation of specific lysine residues of histones plays a key role in regulating gene expression.

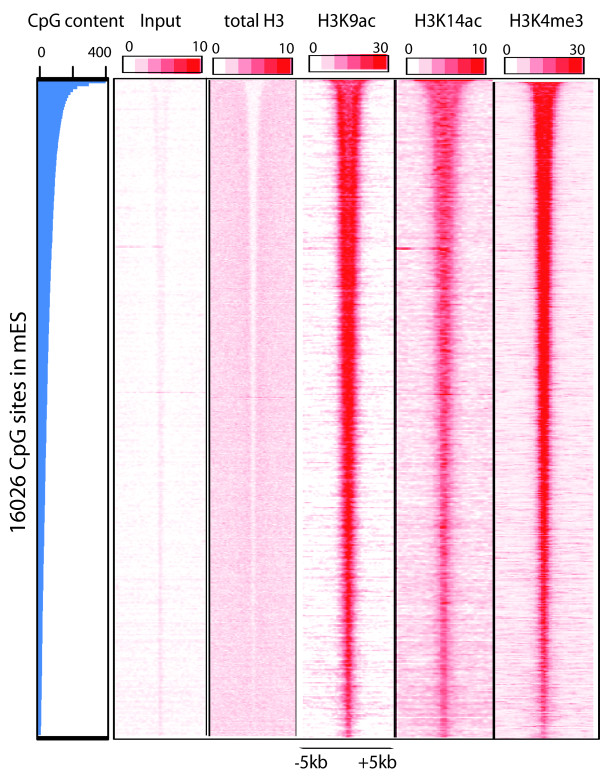
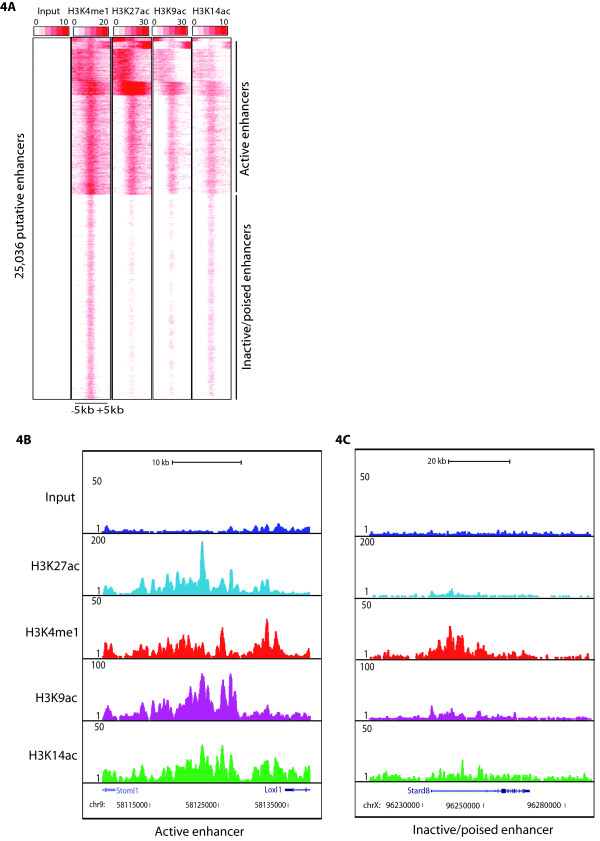
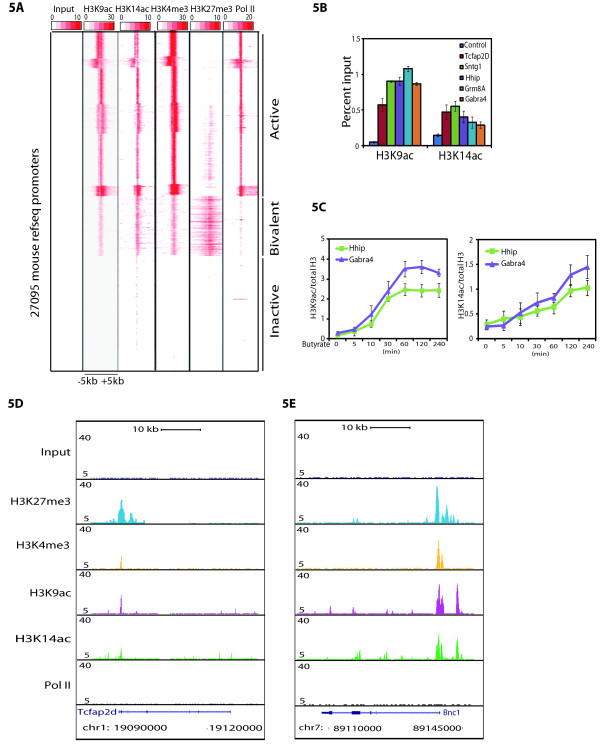
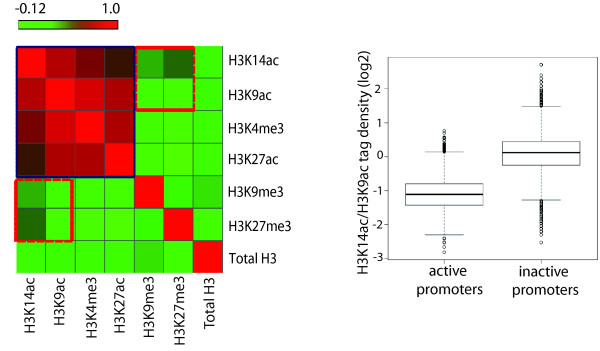
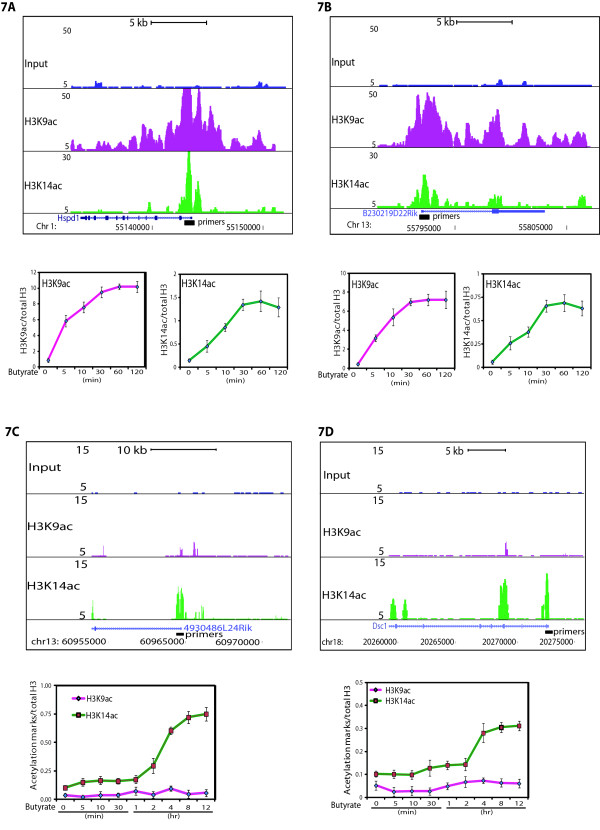
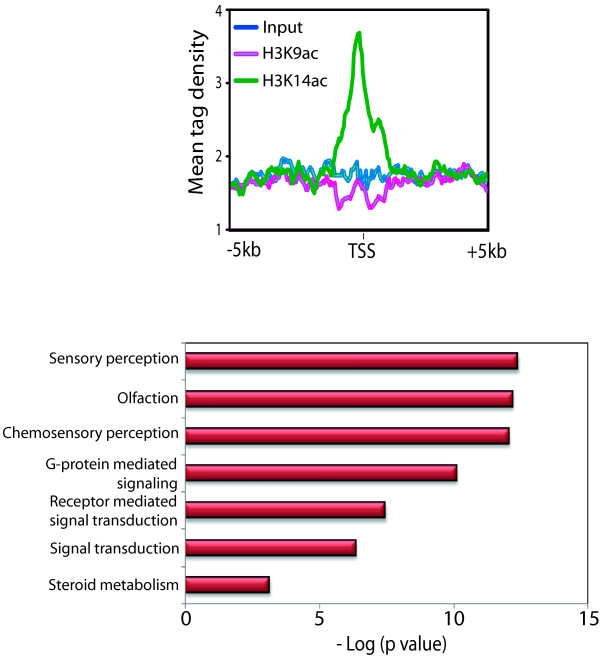
Results: Here we have investigated the genome-wide occurrence of two histone marks, acetylation of histone H3K9 and K14 (H3K9ac and H3K14ac), in mouse embryonic stem (mES) cells. Genome-wide H3K9ac and H3K14ac show very high correlation between each other as well as with other histone marks (such as H3K4me3) suggesting a coordinated regulation of active histone marks. Moreover, the levels of H3K9ac and H3K14ac directly correlate with the CpG content of the promoters attesting the importance of sequences underlying the specifically modified nucleosomes. Our data provide evidence that H3K9ac and H3K14ac are also present over the previously described bivalent promoters, along with H3K4me3 and H3K27me3. Furthermore, like H3K27ac, H3K9ac and H3K14ac can also differentiate active enhancers from inactive ones. Although, H3K9ac and H3K14ac, a hallmark of gene activation exhibit remarkable correlation over active and bivalent promoters as well as distal regulatory elements, a subset of inactive promoters is selectively enriched for H3K14ac.

Conclusions: Our study suggests that chromatin modifications, such as H3K9ac and H3K14ac, are part of the active promoter state, are present over bivalent promoters and active enhancers and that the extent of H3K9 and H3K14 acetylation could be driven by cis regulatory elements such as CpG content at promoters. Our study also suggests that a subset of inactive promoters is selectively and specifically enriched for H3K14ac. This observation suggests that histone acetyl transferases (HATs) prime inactive genes by H3K14ac for stimuli dependent activation. In conclusion our study demonstrates a wider role for H3K9ac and H3K14ac in gene regulation than originally thought.


Figures

Figure 1
Figure 1
Genomic distribution of H3K9ac and H3K14ac in mES cells. (A) Distribution of H3K9ac and H3K14ac peaks over the promoters (2000 bp upstream of TSS,), coding exons, introns and distal intergenic regions. Many of the H3K9 and H3K14 acetylation peaks are at distal intergenic regions. (B) Dot plot representation of genome-wide co-localization analysis of the H3K9ac and H3K14ac modifications over the 15595 combined promoter list of H3K9 and H3K14ac suggests a strong correlation between these two modifications at promoters. (C) Average input normalized profile of 15595 combined promoter list of H3K9 and H3K14ac around the transcription starts sites shows bimodal distribution. (D) Average input normalized whole gene profiles for H3K9ac and H3K14ac modifications over 15595 combined promoter list of H3K9 and H3K14ac. (E) Sequential ChIP–qPCR quantification for co-occupancy of H3K9ac (primary ChIP) and H3K14ac (secondary ChIP) at randomly selected H3K9 and H3K14 acetylated loci suggest that these loci are co-marked with H3K9 as well H3K14 acetylation. Enrichment after first ChIP using H3K9ac followed by re-ChIP with no antibody was used as a control. Primer sequences used in ChIP-qPCR is provided in Additional file 4: Table S1. Error bars represent the standard deviation for three technical replicates.
Figure 2
Figure 2
Level of H3K9 and H3K14 acetylation correlates with magnitude of gene expression. A total of 12000 expressed genes in mES cells were divided into ten groups based on their expression levels, from the top 10% (blue, group 1) to the lowest 10% (purple, group 10). Mean tag densities of active histone marks; H3K9ac, H3K14ac, H3K4me3, H3K27ac and Pol II within (-/+) 3 kb are positively correlated with the transcription level of the genes. On the other hand, total H3 densities in the same regions are negatively correlated with the transcription level.
Figure 3
Figure 3
Correlation between the CpG content and the H3K9ac and H3K14ac level. 16026 CpG island sites associated with genes were sorted in descending order (top to bottom) on the basis of CpG content and the total H3, H3K9ac, H3K14ac and H3K4me3 were examined over them. CpG content on these sites correlates with the level of H3K9 and H3K14 acetylation as well as with the H3K4me3.
Figure 4
Figure 4
H3K9ac and H3K14ac mark active enhancers along with H3K27ac. (A) Heatmap of the signal density using k-means clustering observed on 25036 putative enhancers (-/+ 5 kb) from mES cells for H3K4me1 (mark of putative enhancers), H3K27ac, H3K9ac and H3K14ac. On the basis of presence or absence of H3K27ac enhancers are categorized as active or poised/inactive. UCSC genome browser track of representative examples of (B) active enhancer and (C) poised/inactive enhancer. Active enhancers have significant enrichment of H3K9ac and H3K14ac as compared to poised/inactive enhancers as was observed for H3K27ac.
Figure 5
Figure 5
H3K9ac and H3K14ac associate with active as well as bivalent promoters. (A) Heatmap of the signal density using k-means clustering observed on 27095 mouse refseq promoters (-/+5 kb) for H3K9ac and H3K14ac along with H3K4me3 and H3K27me3 (hallmark of bivalent promoters) and Pol II. The clustering of density map shows three different categories of genes. Active promoters having H3K9ac, H3K14ac, H3K4me3 and Pol II, bivalent promoters showing H3K4me3 and H3K27me3 along with H3K9ac and H3K14ac, and inactive promoters lacking all above marks along with Pol II. (B) Presence of H3K9ac and H3K14ac over randomly chosen bivalent loci was validated by ChIP-qPCR. (C) Increase in the H3K9 and H3K14 acetylation over bivalent promoters (Hhip and Gabra4) following HDAC inhibition by sodium butyrate. The presence of H3K9ac and H3K14ac over these bivalent loci at the indicated time points after the sodium butyrate treatment was measured by ChIP-qPCR. ChIP signals for H3K9ac and H3K14ac were normalized to total H3. Primer sequences used in ChIP-qPCR is provided in Additional file 4: Table S1. Error bars represent the standard deviation for three technical replicates. (D and E) UCSC genome browser track of two representative examples of loci showing H3K9ac and H3K14ac over the bivalent promoters.
Figure 6
Figure 6
Differential H3K14ac over inactive promoters as compared to H3K9ac. (A) Heatmap representing the correlation between total H3, H3K9ac, H3K14ac, H3K4me3, H3K27ac, H3K27me3 and H3K9me3 around the TSS (-/+ 2 kb). Active promoter marks; H3K14ac, H3K9ac, H3K4me3 and H3K27ac clustered separately (blue square) to form an active promoter chromatin state. Inactive marks (H3K9me3 and H3K27me3) have higher co-occurrence with H3K14ac as compared to H3K9ac (red square) (B) Ratio of H3K14ac/H3K9ac ChIP-seq tag density plotted for active promoters and inactive promoters. Ratio is significantly higher for inactive promoters suggesting that level of H3K14ac is higher over inactive promoters as compared to H3K9ac.
Figure 7
Figure 7
Selective increase in H3K14ac over inactive genes in presence of sodium butyrate. (A, B) Rapid increase in the H3K9 and H3K14 acetylation over active promoters (Hspd1 and B230219D22Rik) caused by HDAC inhibitor. The upper panels show the UCSC genome browser tracks for the genes analysed. (C, D) Selective increase in H3K14ac over the inactive promoters (4930486L24Rik and Dsc1) as compared to H3K9ac following the treatment with HDAC inhibitor. The upper panels show the UCSC genome browser track for the genes analysed. The presence of H3K9ac and H3K14ac over these loci at the indicated time points after the sodium butyrate treatment was measured by ChIP-qPCR. ChIP signals for H3K9ac and H3K14ac were normalized to total H3. Positions of the primers used for ChIP-qPCR is shown in the UCSC genome browser track and primer sequences are provided in Additional file 4: Table S1. Error bars represent the standard deviation for three technical replicates.
Figure 8
Figure 8
A subset of inactive promoters having high H3K14ac is poised for stimuli dependent activation. (A) Average ChIP-seq profile of 500 inactive genes around the transcription starts sites (-/+ 5 kb) shows specific enrichment of H3K14ac as opposed to H3K9ac. (B) Gene ontology (using David Bioinformatics, http://david.abcc.ncifcrf.gov/) analysis of 500 inactive genes having high H3K14ac suggest that these genes are activated in a stimuli dependent manner. The gene ontology term is on the y axis, and the negative log of p value indicating significance of enrichment is on the x axis.

References

    1. Hochedlinger K, Jaenisch R. Nuclear reprogramming and pluripotency. Nature. 2006;441(7097):1061–1067. doi: 10.1038/nature04955. - DOI - PubMed
    1. Mattout A, Meshorer E. Chromatin plasticity and genome organization in pluripotent embryonic stem cells. Curr Opin Cell Biol. 2010;22(3):334–341. doi: 10.1016/j.ceb.2010.02.001. - DOI - PubMed
    1. Wang Z, Zang C, Rosenfeld JA, Schones DE, Barski A, Cuddapah S, Cui K, Roh TY, Peng W, Zhang MQ. et al.Combinatorial patterns of histone acetylations and methylations in the human genome. Nat Genet. 2008;40(7):897–903. doi: 10.1038/ng.154. - DOI - PMC - PubMed
    1. Heintzman ND, Ren B. Finding distal regulatory elements in the human genome. Curr Opin Genet Dev. 2009;19(6):541–549. doi: 10.1016/j.gde.2009.09.006. - DOI - PMC - PubMed
    1. Li B, Carey M, Workman JL. The role of chromatin during transcription. Cell. 2007;128(4):707–719. doi: 10.1016/j.cell.2007.01.015. - DOI - PubMed

Publication types