. 2012 Aug 24;19(8):1060-72.
doi: 10.1016/j.chembiol.2012.07.015.

Firefly luciferase in chemical biology: a compendium of inhibitors, mechanistic evaluation of chemotypes, and suggested use as a reporter

Affiliations

Firefly luciferase in chemical biology: a compendium of inhibitors, mechanistic evaluation of chemotypes, and suggested use as a reporter

Natasha Thorne et al. Chem Biol. .

Abstract

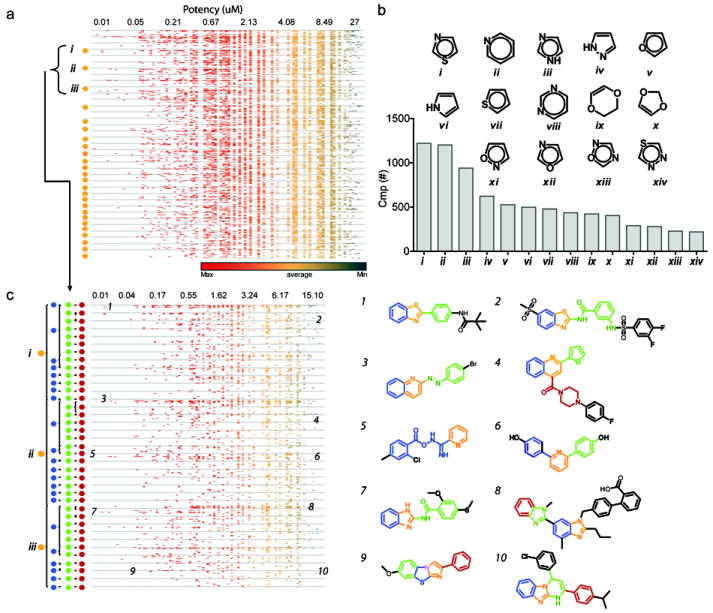
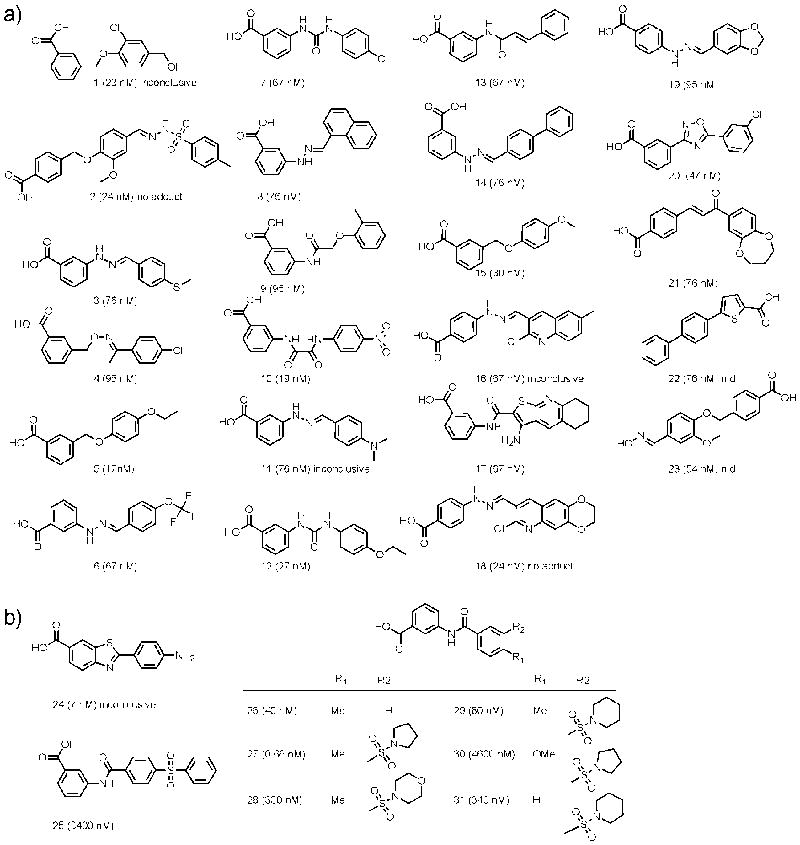
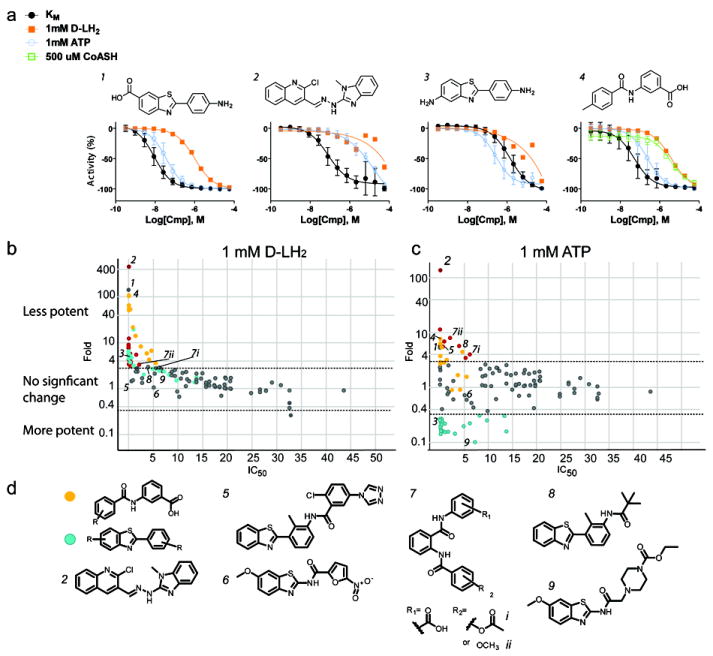
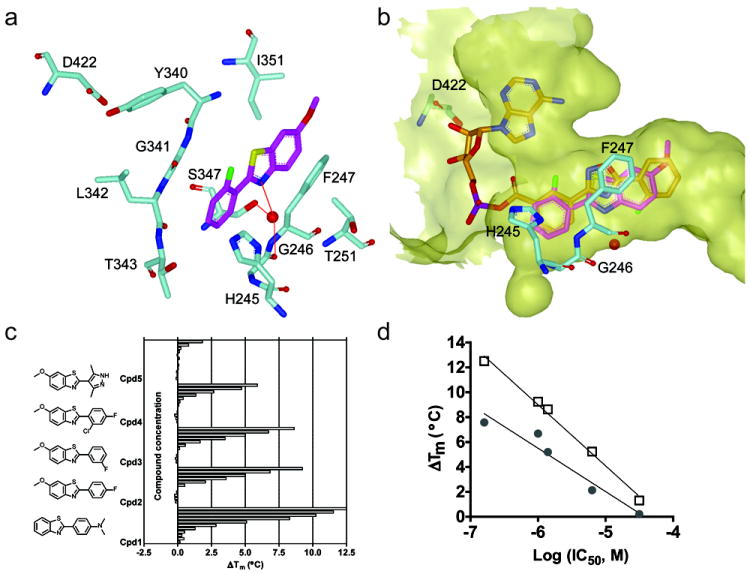
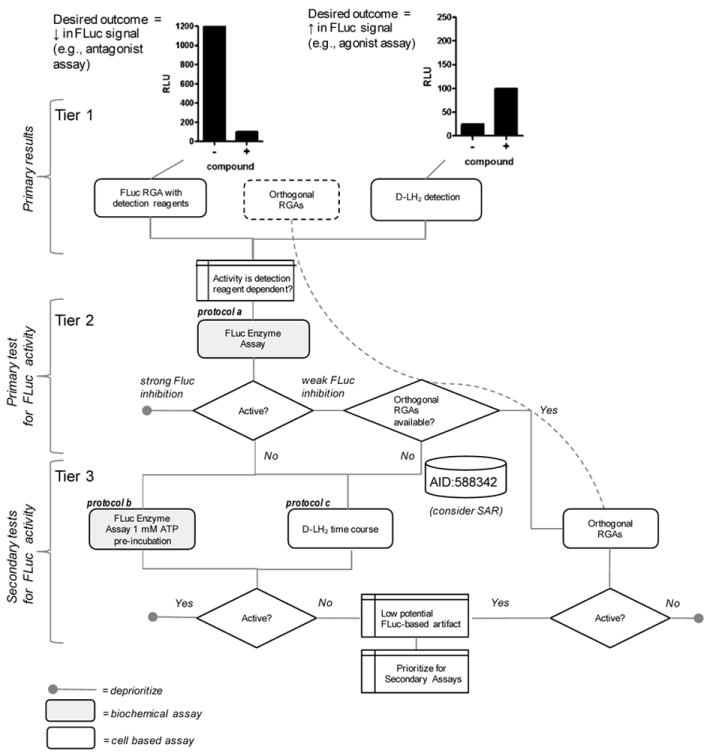
Firefly luciferase (FLuc) is frequently used as a reporter in high-throughput screening assays, owing to the exceptional sensitivity, dynamic range, and rapid measurement that bioluminescence affords. However, interaction of small molecules with FLuc has, to some extent, confounded its use in chemical biology and drug discovery. To identify and characterize chemotypes interacting with FLuc, we determined potency values for 360,864 compounds found in the NIH Molecular Libraries Small Molecule Repository, available in PubChem. FLuc inhibitory activity was observed for 12% of this library with discernible SAR. Characterization of 151 inhibitors demonstrated a variety of inhibition modes, including FLuc-catalyzed formation of multisubstrate adduct enzyme inhibitor complexes. As in some cell-based FLuc reporter assays, compounds acting as FLuc inhibitors yield paradoxical luminescence increases, thus data on compounds acquired from FLuc-dependent assays require careful analysis as described here.


Conflict of interest statement

The authors have no conflict of interest.

Figures

Figure 1
Figure 1. Scaffold analysis of FLuc inhibitors
a) Primary root scaffold analysis and associated potency distribution for compounds associated with these scaffolds. The clustering was based on the high quality CRCs (classes 1a, 1b or 2a) with maximum inhibition values of >50%. Scaffolds at the bottom of the graph contain as little as five members while scaffolds at the top of the graph contain >1,000 members. b) Root scaffolds composed of heterocycles associated with >200 compounds. Representative scaffolds are shown, the most prominent of which were the thiazole (i), pyridine (ii, found in quinolines), and imidazole (iii) ring structures. A series of oxadiazoles (xiii) were also prevalent. Also shown here are (iv) pyrazole, (v) furan, (vi) pyrrole, (vii) thiophene, (viii) pyrimidine, (ix) dihydro-dioxine, (x) dioxole, (xi) isooxazole, (xii) oxazole, (xiv) thiadiazole. c) Potency distribution for the scaffolds i – iii, which were highly populated in the dataset. Scaffold levels are shown to the left of the potency heat map and are depicted as colored dots, with increasing structural complexity proceeding from left to right (i.e., orange indicating the least complex scaffold level and red the highest complexity shown here). Potency values are in μM and the compounds are colored based on the scaffold level which includes the substructure. Of note, not every compound in the potency distribution analysis achieved the highest level of structural complexity, as seen with compounds (5) and (6). An example of both a potent and a weakly active compound is shown for benzothiazoles (1, 2), quinolines (3, 4), pyridines (5, 6), benzimidazoles (7, 8), as well as benzimidazoles fused to other ring systems (9, 10). It was found that generally flat, planar structures were more potent FLuc inhibitors compared to more complex, branched or highly angular structures. Alternate analysis and support for this data is shown in Figure S2.
Figure 2
Figure 2. Potent benzoic acid-containing compounds
a) Potency of compounds, indicated in parenthesis, with a benzoic acid core. Those found to form a MAI are noted. For compounds categorized as “inconclusive”, one or more LC-MS traces could not confirm the adenylate product or only a weak peak for the adenylated product was observed. n.d., not determined. b) Compounds from the 151 selected for follow-up analysis that were also subjected to LC/MS analysis. Compounds were all found to form the MAI unless otherwise noted. Data supporting these findings are provided in Table S3 and Figure S3.
Figure 3
Figure 3. Substrate competition analysis of FLuc inhibitors in enzyme assay
a) Example data for compounds competitive with D-LH2 (1), competitive with both D-LH2 and ATP (2, CID:4216593), competitive with D-LH2 and uncompetitive with ATP (3), and a compound showing weaker potency with CoASH due to MAI formation (4). b, c) Potency (IC50) shifts for each of the 151 follow-up compounds. The X-axis shows the IC50 of each compound under conditions in which both substrates are held near their KM concentrations. The Y-axis indicates the fold-shift in potency obtained when either D-LH2 is present at high concentration (b, 1 mM; Fold = IC50 at high D-LH2/IC50 at KM D-LH2) or when ATP is present at high concentration (c, 1 mM; Fold = IC50 at high ATP/IC50 at KM ATP). Red dots represent compounds that became >3-fold less potent in the presence of either high D-LH2 (b) or ATP (c) (i.e., IC50 increased by >3-fold with high concentration of substrate). Orange dots indicate compounds whose potency not only decreased in the presence of high concentrations of D-LH2 or ATP, but also decreased by >3-fold in the presence of high CoASH (1 mM; i.e., IC50 increased by >3-fold in presence of 1mM CoASH and KM concentrations of D-LH2 and ATP). Blue dots are those compounds that became >3-fold more potent in the presence of high ATP (i.e. IC50 decreased by > 3-fold). The horizontal lines represent a 3-fold shift in potency in either direction. d) Compounds associated with the orange dots (and whose potency decreased in the presence of high concentrations of CoASH and D-luciferin) were found to have an aryl carboxylate. Compounds associated with blue dots (and became more potent in the presence of high concentrations of ATP) largely contained a benzothiazole scaffold. A single compound (2, CID:4216593) was found to have the highest shift in potency in both high D-luciferin and high ATP conditions. 5 and 6, example compounds showing either mixed or non-competitive behavior, respectively. 7i, 7ii, and 8, examples of compounds demonstrating competitive behavior with ATP. Compound 9, an example compound that is more potent with high ATP concentration. Supported by Figure S5.
Figure 4
Figure 4. X-ray structure of a benzothiazole-FLuc co-crystal
a) Interactions of a benzothiazole (magenta) within the D-LH2 pocket of FLuc. Aromatic stacking interactions between the benzothiazole core and F247 are observed. A water-mediated H-bond was formed between benzothiazole nitrogen and G246 backbone carbonyl oxygen and S347 hydroxyl, as shown by the red dotted line. Protein residues are shown in cyan; supported by Table S1 and Figure S4. b) Overlay with of the benzothiazole (magenta) with the FLuc-bound structure of PTC124-AMP (PDB: 3IES; orange) showing occupation of the D-LH2 pocket by the benzothiazole with no overlap into the AMP binding region of FLuc. The binding pocket was depicted as semi-transparent yellow surface. These figures were prepared with the program VIDA (OpenEye Scientific Software). c) Representative simple benzothiazoles and example thermal shift data assayed in the presence of 2 mM ATP. d) The ΔTm obtained at 100μM compound in the presence (open squares) or absence (solid circles) of 2 mM ATP plotted against the potency of each benzothiazole (shown in c).
Figure 5
Figure 5. Apparent activation of FLuc signal associated with FLuc inhibitors
a) Heatmap colored by activity in the indicated cell-based assay. Two-thirds of the follow-up compounds tested were active in at least one of the cell-based assays tested. Except for two compounds (out of 151), compounds active in the read-through assays (UGA) at 48/72 hours were also active in the miR-21 assay. For the read-through assay, regardless of the MOI, FLuc inhibitors generally produced an activation-type curve. Of note, very few FLuc inhibitors produced an inhibitory CRC in these assays, as they were developed and optimized to identify compounds that caused activation of FLuc signal. b) CRCs for select FLuc inhibitors comparing their activity in the cell-based assays and biochemical assay. FLuc inhibitors with different MOIs (see Figure 2) commonly exhibit inhibition of FLuc in the biochemical assay with KM concentrations of substrates and produce activation or bell-shaped curves in cell-based assays. Supported by Figure S6.
Figure 6
Figure 6. Strategies for identifying luciferase inhibitor interference
Actives identified in agonist (tier 1, right) or antagonist (tier 1, left) cell-based assays should be tested in the FLuc enzyme assay using KM levels of substrates, as a preliminary filter for luciferase inhibitors (tier 2, protocol a) and removes detection reagent dependent-activity. One can then directly test compounds in a suitable orthogonal reporter system if it is available (right path), or, if no such assay is readily available, compound activity can be analyzed in a series of tests (central path, tier 3) to determine if FLuc interference exists. In tier 3, protocol b is the FLuc enzyme performed at low D-LH2 (e.g. 10 μM) and saturating ATP which will help identify FLuc inhibitors uncompetitive with ATP. If D-LH2 was not already used in the RGA (see tier 1), then protocol c, the RGA assay performed with D-LH2 detection as a time course study, can be used to identify detection reagent-dependent compound activity. Results from our profiling work (PubChem AID 588342) can also be used as a resource to identify related chemotypes that may act as FLuc inhibitors. If counter-screen assays are used, they should be calibrated with a few FLuc inhibitors described in this report to determine the relative sensitivity of the assay to FLuc inhibitors.

References

    1. Auld DS, Lovell S, Thorne N, Lea WA, Maloney DJ, Shen M, Rai G, Battaile KP, Thomas CJ, Simeonov A, et al. Molecular basis for the high-affinity binding and stabilization of firefly luciferase by PTC124. Proc Natl Acad Sci U S A. 2010;107:4878–4883. - PMC - PubMed
    1. Auld DS, Southall NT, Jadhav A, Johnson RL, Diller DJ, Simeonov A, Austin CP, Inglese J. Characterization of chemical libraries for luciferase inhibitory activity. J Med Chem. 2008a;51:2372–2386. - PubMed
    1. Auld DS, Thorne N, Maguire WF, Inglese J. Mechanism of PTC124 activity in cell-based luciferase assays of nonsense codon suppression. Proc Natl Acad Sci U S A. 2009a;106:3585–3590. - PMC - PubMed
    1. Auld DS, Thorne N, Nguyen DT, Inglese J. A specific mechanism for nonspecific activation in reporter-gene assays. ACS Chem Biol. 2008b;3:463–470. - PMC - PubMed
    1. Auld DS, Zhang YQ, Southall NT, Rai G, Landsman M, Maclure J, Langevin D, Thomas CJ, Austin CP, Inglese J. A Basis for Reduced Chemical Library Inhibition of Firefly Luciferase Obtained from Directed Evolution. J Med Chem. 2009b;52:1450–1458. - PMC - PubMed

Publication types

Associated data