. 2012 Aug 24;37(2):209-22.
doi: 10.1016/j.immuni.2012.05.027.

STAT3 transcription factor promotes instability of nTreg cells and limits generation of iTreg cells during acute murine graft-versus-host disease

Affiliations

STAT3 transcription factor promotes instability of nTreg cells and limits generation of iTreg cells during acute murine graft-versus-host disease

Arian Laurence et al. Immunity. .

Abstract

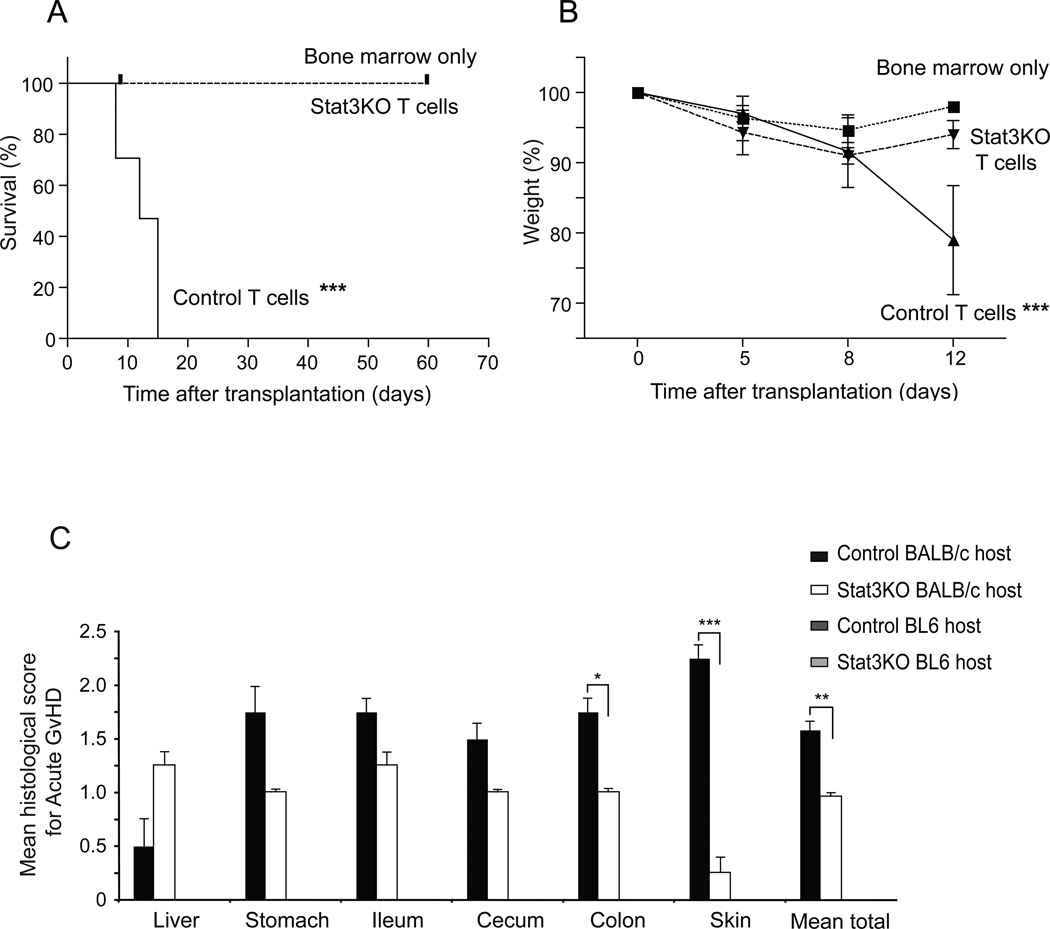
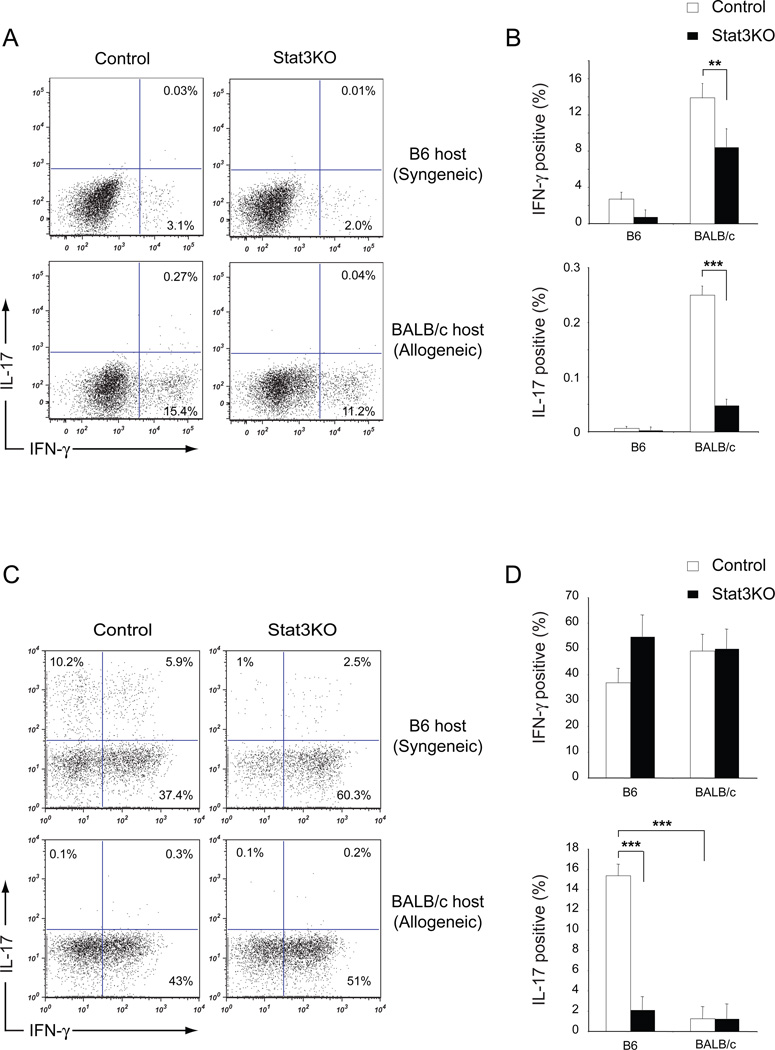
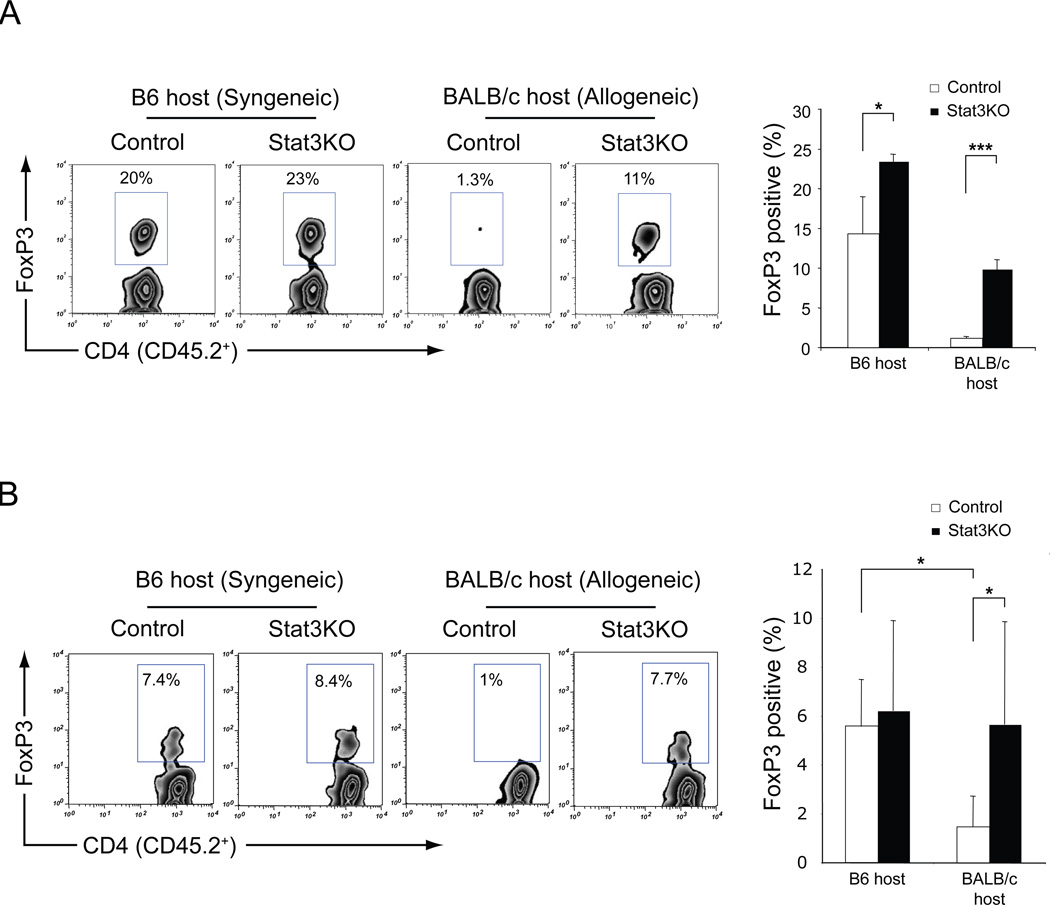
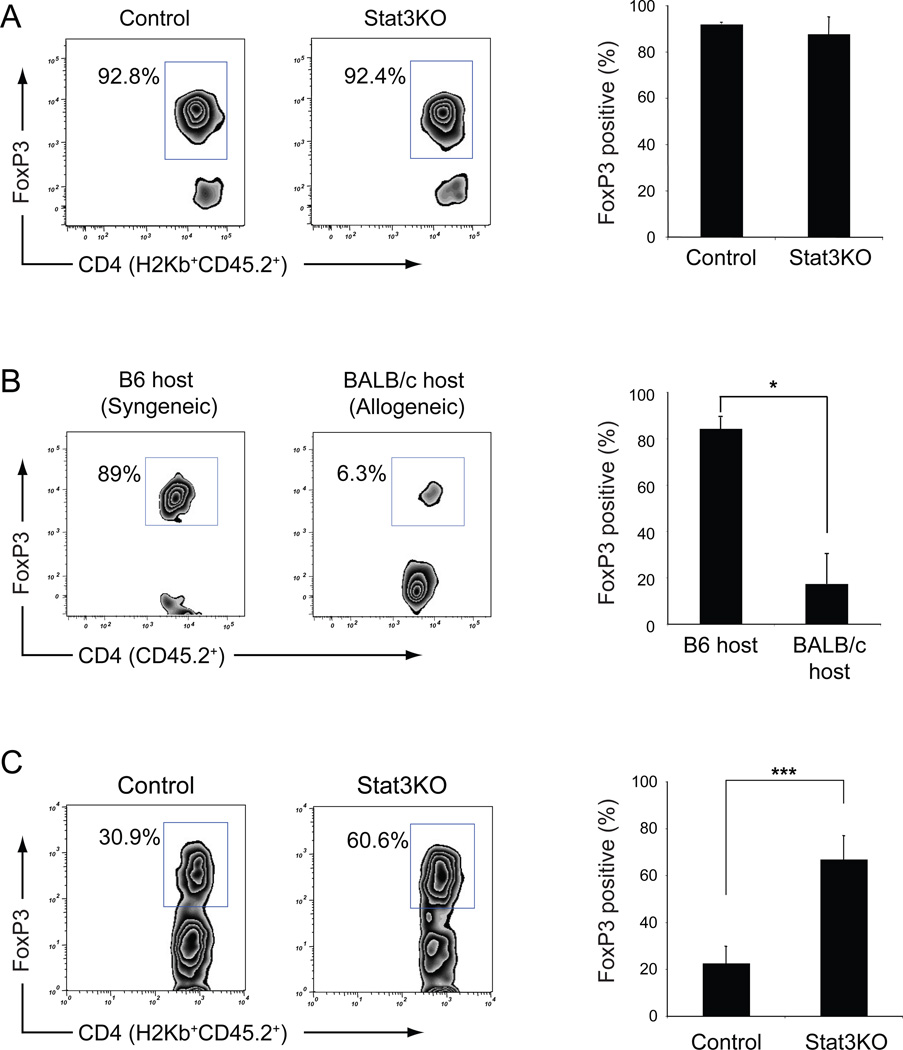
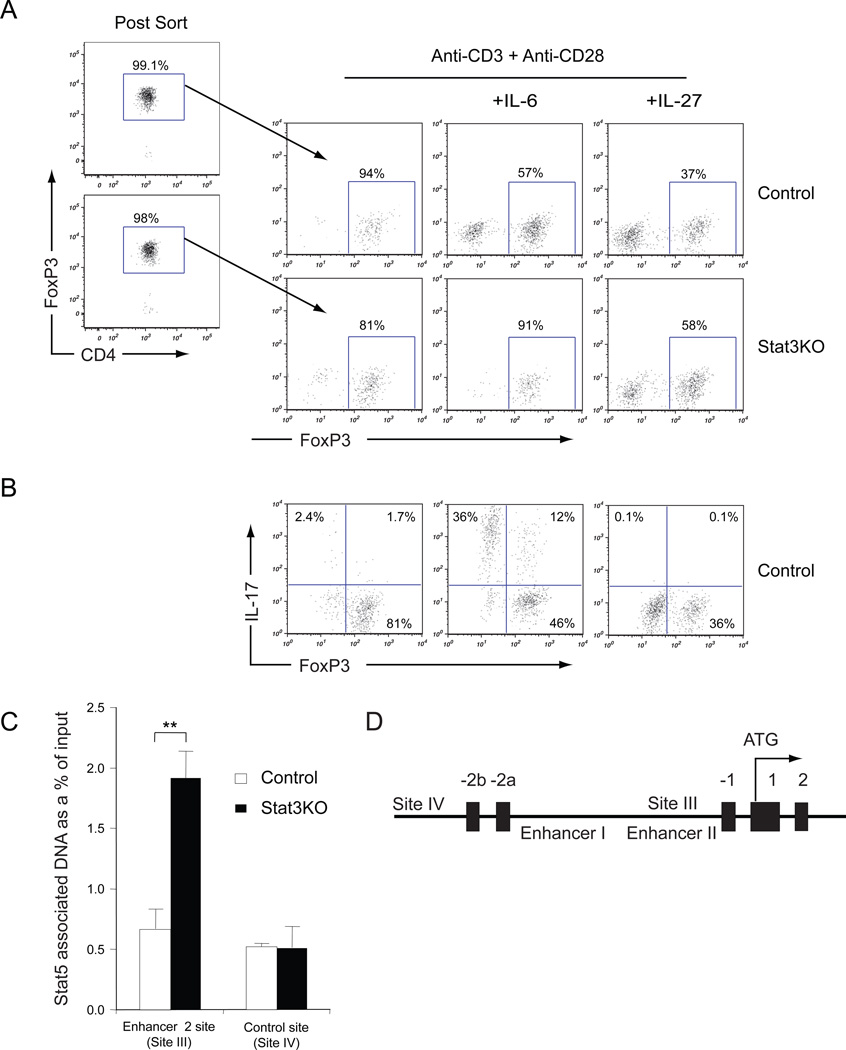
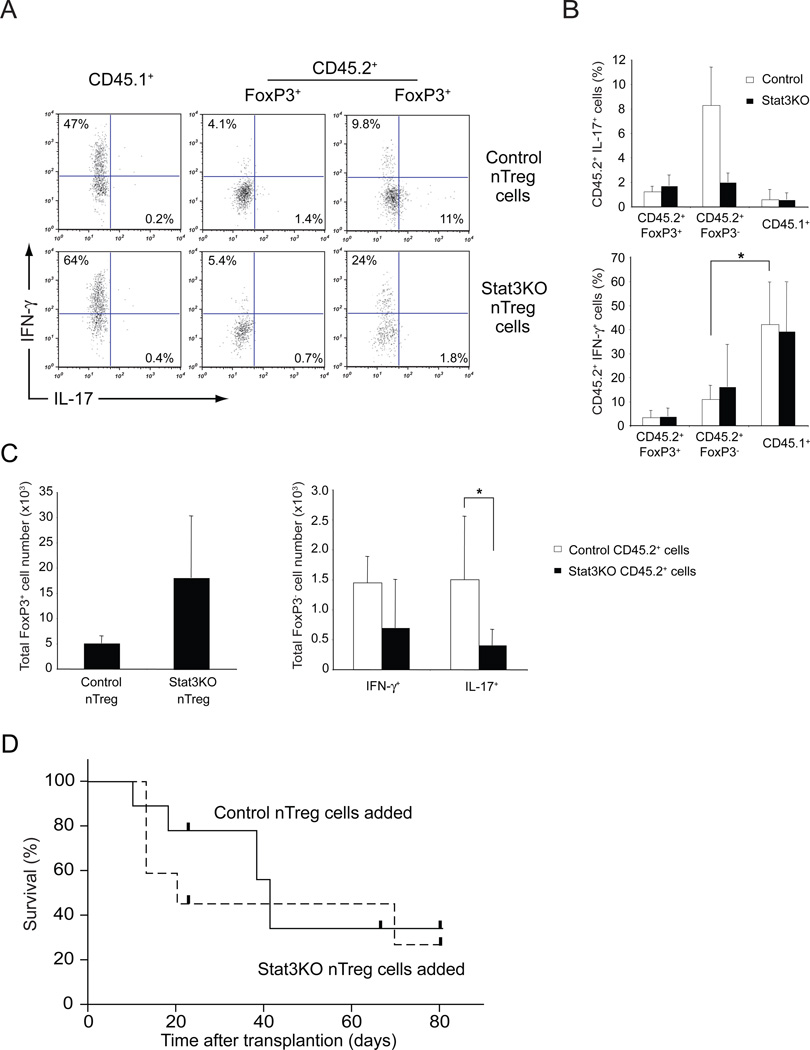
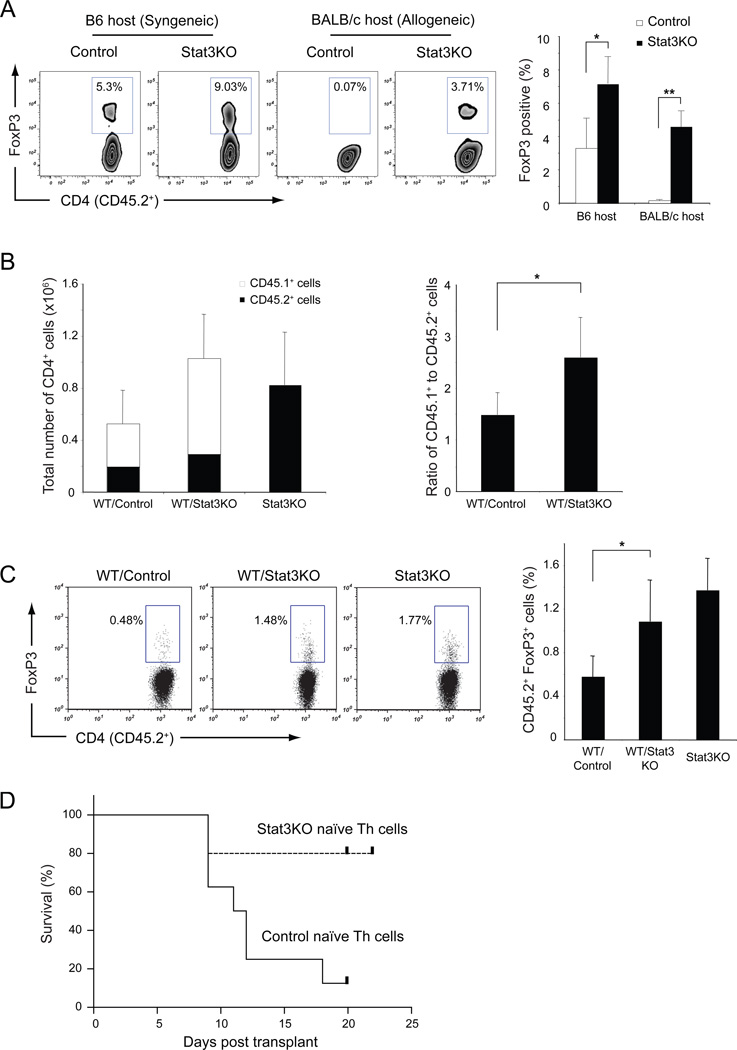
Acute graft-versus-host disease (GvHD) is a major cause of mortality in allogeneic bone marrow transplantation (BMT), for which administration of FoxP3(+) regulatory T (Treg) cells has been proposed as a therapy. However, the phenotypic stability of Treg cells is controversial, and STAT3-dependent cytokines can inhibit FoxP3 expression. We assessed whether the elimination of STAT3 in T cells could limit the severity of GvHD. We found STAT3 limited FoxP3(+) Treg cell numbers following allogeneic BMT by two pathways: instability of natural Treg (nTreg) cells and inhibition of induced Treg (iTreg) cell polarization from naive CD4(+) T cells. Deletion of STAT3 within only the nTreg cell population was not sufficient to protect against lethal GvHD. In contrast, transfer of STAT3-deficient naive CD4(+) T cells increased FoxP3(+) Treg cells post-BMT and prevented lethality, suggesting that the consequence of STAT3 signaling may be greater for iTreg rather than nTreg cells during GvHD.


Figures

Figure 1
Figure 1. Transplantation with STAT3-deficient T cells is associated with enhanced survival and reduction in acute-GvHD
Three independent experiments, each with at least four recipients per cohort, were performed whereby irradiated BALB/c mice were transplanted with T-depleted BM cells alone (bone marrow only) or with 2.5×10⁶ un-fractionated T cells from either Foxp3-GFP;Stat3fl/fl (Control) or Foxp3-GFP;CD4-Cre;Stat3fl/fl mice (Stat3KO). (A) Survival post transplantation. A representative experiment is shown (n=7 mice per cohort) (B) Weight loss, expressed as a percentage of the pre-transplant weight. This figure depicts a second representative experiment (n=4 per cohort). Statistics were determined using a two-way ANOVA test; error bars denote the s.e.m. (C) In a third experiment, cohorts were evaluated for evidence of GvHD by histology at day 14 post-BMT. Histology criteria for scoring GvHD are listed in Figure S1 (0, no disease; 4, severe disease).
Figure 2
Figure 2. Acute GvHD is not associated with the presence of Th17 cells
Irradiated syngeneic (B6) or allogeneic (BALB/c) mice were transplanted with CD45.1+ B6 T-depleted BM cells together with 2.5×10⁶ CD4+ CD45.2+ un-fractionated T cells from either Foxp3-GFP;Stat3fl/fl (Control) or Foxp3-GFP;CD4-Cre;Stat3fl/fl (Stat3KO) mice. IL-17 and IFN-γ expression was determined by intracellular staining in the CD4+ CD45.2+ T cell population in spleens and peripheral lymph nodes at day 12 post-BMT. The flow cytometry plots show a representative sample (A); the histogram depicts mean values pooled from four mice. (B). Data are representative of two separate experiments. The experiment was repeated two additional times, and IL-17 and IFN-γ expression was determined by intracellular staining in the CD4+ CD45.2+ T cell population isolated from the colonic lamina propria. The flow cytometry plots show a representative sample (C) and the histogram depicts mean values pooled from four mice. (D).
Figure 3
Figure 3. STAT3 promotes the loss of Treg cells during acute-GvHD
Irradiated syngeneic (B6) or allogeneic (BALB/c) mice were transplanted with CD45.1+ B6 T-depleted BM cells together with 2.5×10⁶ CD45.2+ un-fractionated T cells from either Foxp3-GFP;Stat3fl/fl (indicated as littermate controls: Control) or Foxp3-GFP;CD4-Cre;Stat3fl/fl mice (indicated as STAT3 knockout: Stat3KO). FoxP3 expression was determined in the CD45.2+ CD45.1 CD4+ population from spleen and peripheral lymph nodes at day 14 post-BMT. The flow cytometry plots show a representative sample and the histograms denote mean values from four mice derived from two separate experiments. (A). In separate experiments, FoxP3 expression was determined in the CD45.2+ CD45.1 CD4+ population from the colonic lamina propria, The flow cytometry plots show a representative sample pooled from three colons; the histogram columns denote mean values derived from four separate experiments. Significance was determined by paired t testing (B).
Figure 4
Figure 4. STAT3 promotes the loss of FoxP3 expression in nTreg cells during acute-GvHD
Irradiated allogeneic (BALB/c) mice were transplanted with CD45.1+ B6 T-depleted BM cells together with 0.5 × 10⁶ CD45.2+CD4+FoxP3-GFP+ T cells from either Foxp3-GFP;Stat3fl/fl (Control) or Foxp3-GFP;CD4-Cre;Stat3fl/fl mice (Stat3KO). FoxP3 expression was determined in the CD4+ CD45.2+ CD45.1H2kb+ population at day 14 post BMT. Flow cytometry plots show a representative sample; the histogram shows mean values from three mice pooled from two separate experiments (A). Irradiated syngeneic (B6) or allogeneic (BALB/c) mice were injected with CD45.1+B6 T-depleted BM cells together with 2x 10⁶ CD45.1+ CD25 wild-type B6 T cells and 0.5 × 10⁶ CD45.2+ CD4+ FoxP3-GFP+ T cells from Foxp3-GFP;Stat3fl/fl mice. FoxP3 expression was determined in the CD4+ CD45.2+ CD45.1 population at day 10 post BMT. Flow cytometry plots show a representative sample; the histogram represents mean values from three mice each derived from an independent experiment. Significance was determined by a two-tailed paired t test (B). Irradiated allogeneic (BALB/c) mice were injected with CD45.1+ B6 T-depleted BM cells together with 2 × 10⁶ CD45.1+ CD25 wild-type B6 T cells and 0.5 × 10⁶ CD45.2+ CD4+ FoxP3-GFP+ T cells from either Foxp3-GFP;Stat3fl/fl (Control) or Foxp3-GFP;CD4-Cre;Stat3fl/fl (Stat3KO) mice. FoxP3 expression was determined in the CD4+ CD45.2+ CD45.1 H2Kb+ population at day 10 post-BMT. The flow cytometry plots show a representative sample; the histogram indicates mean values pooled from three mice derived from two separate experiments (C).
Figure 5
Figure 5. STAT3 promotes the loss of FoxP3 expression in nTreg cells in vitro
CD4+ FoxP3-GFP+ cells were isolated from Control and Stat3KO mice (left panels) and stimulated with anti-CD3 and anti-CD28 for six days in the presence of media alone or with IL-6 or IL-27. FoxP3 expression was determined by GFP expression. Data are representative of two experiments (A). The control cells were subsequently stained for FoxP3 and IL-17 expression, the data are representative of two separate experiments (B). Sorted CD4+ FoxP3+ iTreg cells were stimulated with IL-2 and IL-6, cross-linked and immunoprecipitated with anti-STAT5. Target site III within the Foxp3 locus was amplified along with a control site (Site IV). Histograms denote mean values from a single experiment, and the data are representative of two separate experiments (C). Cartoon representation of the Foxp3 locus illustrating target site III and IV by Yao et al (Yao et al., 2007) and the enhancer sites identified by Xu et al (Xu et al., 2010) (D).
Figure 6
Figure 6. nTreg cells that loose FoxP3 expression acquire a cytokine expression that is distinct from effector T cells
Irradiated allogeneic (BALB/c) mice were transplanted with CD45.1+ B6 T-depleted BM cells together with 2.0 × 10⁶ CD45.1+ CD4+ naïve (CD62L+ CD44CD25) wild-type B6 T cells and 0.5 × 10⁶ CD45.2+ CD4+ FoxP3-GFP+ T cells from either Foxp3-GFP;Stat3fl/fl (Control) or Foxp3-GFP;CD4-Cre;Stat3fl/fl mice (Stat3KO). Mice were assessed 10 days post transplant. IL-17 and IFN-γ expression was determined in the FoxP3CD4+CD45.1+CD45.2H2Kb+ population (effector T cell population - left panels), the FoxP3+CD4+CD45.2+CD45.1H2Kb+ population (middle panels) and the FoxP3CD4+CD45.2+CD45.1H2Kb+ population (right panels). Flow cytometry plots show a representative sample (A); the histogram shows mean values pooled from four mice derived from two separate experiments (B). The total recovered CD4+CD45.2+ cells that expressed FoxP3 (left histogram) and the total number of CD4+CD45.2+FoxP3 cells that express IFN-γ or IL-17 (right histogram) are shown. The histograms denote mean values pooled from four mice derived from two separate experiments (C). Irradiated BALB/c mice were transplanted with CD45.1+ B6 T depleted BM cells and 1×10⁶ CD25 CD4+ T cells with 0.5×10⁶ FoxP3+ CD4+ cells from either Foxp3-GFP;Stat3fl/fl donors (Control, solid line; n=9) or Foxp3-GFP;CD4-Cre;Stat3fl/fl donors (Stat3KO, dotted line; n=7). Mice were assessed for survival. Data represent survival curves pooled from three independent experiments (D).
Figure 7
Figure 7. The generation of FoxP3+ iTreg cells in the absence of STAT3 correlates with survival in GvHD
Irradiated syngeneic (B6) or allogeneic (BALB/c) mice were transplanted with CD45.1+ B6 T depleted BM cells together with 2.5 × 10⁶ CD45.2+ CD4+ naïve (CD62L+ CD44 FoxP3) T cells from either Foxp3-GFP;Stat3fl/fl (Control) or Foxp3-GFP;CD4-Cre;Stat3fl/fl mice (Stat3KO). FoxP3 expression was determined in the CD45.2+ CD45.1 CD4+ population. Mice were assessed 12 days post transplant. Flow cytometry plots show a representative sample; the histogram shows mean values pooled from four mice derived from two separate experiments (A). Irradiated allogeneic (BALB/c) mice were transplanted with CD45.1+ B6 T-depleted BM cells together with 1×10⁶ CD45.1+ CD4+ naïve (CD62L+ CD44 CD25) wild-type B6 T cells and 1×10⁶ CD45.2+ CD4+ naïve (CD62L+ CD44 FoxP3) T cells from either Foxp3-GFP;Stat3fl/fl (WT/Control) or Foxp3-GFP;CD4-Cre;Stat3fl/fl mice (WT/Stat3KO) or transplanted CD45.1+ B6 T depleted BM cells together with 2 × 10⁶ CD45.1+ CD4+ naïve (CD62L+ CD44 FoxP3) T cells (Stat3KO) alone. The total number of CD45.1+ CD4+ and CD45.2+ CD4+ T cells were determined in all three groups 10 days post transplant (left histogram) and the ratio of CD45.1+ to CD45.2+ T cells is indicated in the WT/Control and WT/Stat3KO groups (right histogram); the histograms represent pooled data from four mice (B). FoxP3 expression was determined in the CD4+ CD45.2+ CD45.1H2Kb+ populations in all three groups. Flow cytometry plots show a representative sample; the histogram represent mean values pooled from four mice derived from two separate experiments. (C). Irradiated BALB/c mice were rescued with T-depleted BM cells and 2.5 × 10⁶ CD4+ naïve (CD62L+ CD44 FoxP3) T cells from either Foxp3-GFP;Stat3fl/fl (Control, n=8) or Foxp3-GFP;CD4-Cre;Stat3fl/fl mice (Stat3KO, n=5). Transplanted mice were assessed for survival. Data represent survival curves pooled from two independent experiments (D).

Similar articles

Cited by

References

    1. Amarnath S, Costanzo CM, Mariotti J, Ullman JL, Telford WG, Kapoor V, Riley JL, Levine BL, June CH, Fong T, et al. Regulatory T cells and human myeloid dendritic cells promote tolerance via programmed death ligand-1. PLoS Biol. 2010;8:e1000302. - PMC - PubMed
    1. Atkinson K. Bone marrow transplantation. Med J Aust. 1992;157:408–411. - PubMed
    1. Bettelli E, Carrier Y, Gao W, Korn T, Strom TB, Oukka M, Weiner HL, Kuchroo VK. Reciprocal developmental pathways for the generation of pathogenic effector TH17 and regulatory T cells. Nature. 2006;441:235–238. - PubMed
    1. Bettelli E, Korn T, Kuchroo VK. Th17: the third member of the effector T cell trilogy. Curr Opin Immunol. 2007;19:652–657. - PMC - PubMed
    1. Bucher C, Koch L, Vogtenhuber C, Goren E, Munger M, Panoskaltsis-Mortari A, Sivakumar P, Blazar BR. IL-21 blockade reduces graft-versus-host disease mortality by supporting inducible T regulatory cell generation. Blood. 2009;114:5375–5384. - PMC - PubMed

Publication types

MeSH terms