. 2012 Sep 21;37(3):475-86.
doi: 10.1016/j.immuni.2012.07.009. Epub 2012 Aug 23.

A broad range of self-reactivity drives thymic regulatory T cell selection to limit responses to self

Affiliations

A broad range of self-reactivity drives thymic regulatory T cell selection to limit responses to self

Hyang-Mi Lee et al. Immunity. .

Abstract

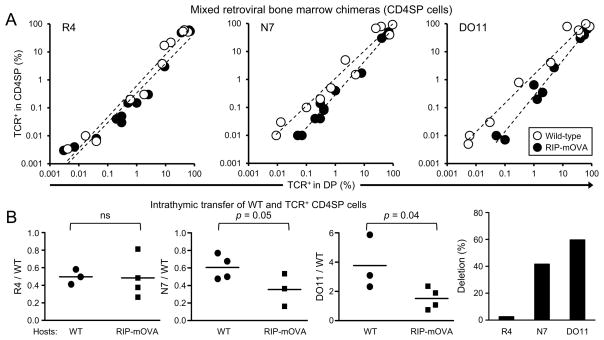
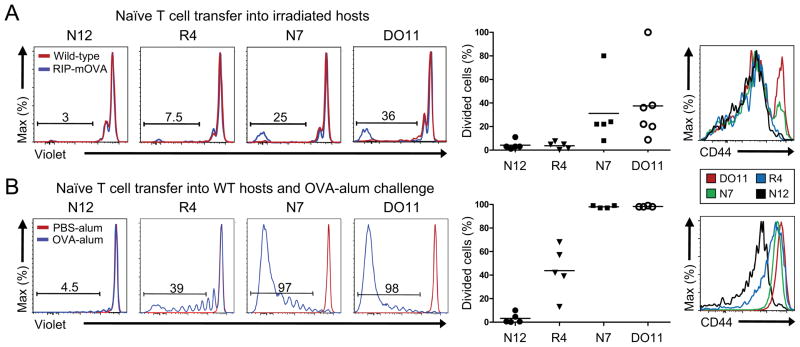
The degree of T cell self-reactivity considered dangerous by the immune system, thereby requiring thymic selection processes to prevent autoimmunity, is unknown. Here, we analyzed a panel of T cell receptors (TCRs) with a broad range of reactivity to ovalbumin (OVA(323-339)) in the rat insulin promoter (RIP)-mOVA self-antigen model for their ability to trigger thymic self-tolerance mechanisms. Thymic regulatory T (Treg) cell generation in vivo was directly correlated with in vitro TCR reactivity to OVA-peptide in a broad ~1,000-fold range. Interestingly, higher TCR affinity was associated with a larger Treg cell developmental "niche" size, even though the amount of antigen should remain constant. The TCR-reactivity threshold to elicit thymic negative selection and peripheral T cell responses was ~100-fold higher than that of Treg cell differentiation. Thus, these data suggest that the broad range of self-reactivity that elicits thymic Treg cell generation is tuned to secure peripheral tolerance to self.


Figures

Figure 1
Figure 1. In vitro and in vivo analysis of OVA-reactive TCRs
(A) In vitro assessment of TCR sensitivity to OVA peptide. NFAT-GFP reporter hybridomas expressing each of 9 TCRs, including DO11 (red) were tested against OVA peptide presented by Flt3L induced dendritic cells. Data shown are the frequency of NFAT-GFP+ cells normalized to the maximum value seen with DO11 in that experiment. Data are representative of three independent experiments. (B,C) In vivo assessment of thymic Treg cell development in WT mice. Double-negative (DN) thymocytes from Foxp3gfpRag1−/− mice were retrovirally transduced with each TCR and transferred into the thymuses of WT mice, and analyzed for Treg cell generation 14-days post transfer. Representative flow cytometry plots are shown in (B) and summarized in (C) of 3–6 mice for each TCR from at least 2 independent experiments. Each dot represents data from an individual recipient.
Figure 2
Figure 2. Defining efficiency of OVA recognition using hybridoma and primary T cells
(A) Hybridoma assays. Hybridoma cells were assessed for NF-κB-GFP expression (left) and IL-2 production (right) in response to OVA peptide presented by TA3 APCs. (B) Assays of TCR reactivity using primary cells. T cells were obtained from retroviral bone marrow chimeras using WT hosts. CD4SP thymocytes were assessed for CD25 upregulation (left), and peripheral CD4+ T cells were tested for in vitro proliferation (right), in response to OVA-peptide presented by Flt3L DCs. Calculated ΔEC50 is summarized in Table 1. Graphs shown are representative of three independent experiments. (C) Binding of OVA:I-Ad tetramer to hybridoma cells expressing OVA-reactive TCRs. Representative plots are shown on the left, and summarized on the right (mean ± s.d., n=3 independent experiments). As the lines were generated via retroviral transduction of TCRs, the cells shown are gated on TCR+ cells. MFI was calculated from all TCR+ cells. 3K:I-Ab tetramer was used as a control.
Figure 3
Figure 3. Thymic Treg cell generation is instructed by the extent of TCR reactivity to self-antigen
(A) Treg cell generation by OVA-reactive TCRs in the presence of RIP-mOVA. Retrovirally transduced Rag1−/− DN cells were transferred into the thymuses of RIP-mOVA mice, and analyzed at 2 weeks as in Figure 1B. (B) Data in (A) are summarized, with each dot representing the frequency (left) and absolute number (right) of Foxp3+ cells from an individual recipient. The plot in the middle shows the mean Foxp3+ percentage (± S.E.M.). The middle and right plots are correlated with the ΔLog(EC50) of the TCR for NFAT-GFP activation as compared with DO11. P1 was not plotted on the right because no Foxp3+ cells were observed. (C) Correlation of Treg cell generation with in vitro sensitivity to OVA. To determine whether TCR affinity is directly correlated with the efficiency of Treg cell selection in vivo, we plotted the absolute number of Treg cells versus the ΔLog(EC50) of the TCR as compared with DO11, and analyzed it by linear regression. For tetramer binding, we used the Log(MFI) as compared with DO11. Each symbol represents an individual TCR indicated in the legend. (D) The frequency of Foxp3CD25hi CD4SP cells in the experiments described in (A) are shown (mean ± s.d., 5 independent experiments). (E) Correlation of Foxp3CD25hi CD4SP cells with sensitivity of TCR to OVA peptide. Frequencies of Foxp3CD25hi cells shown in (D) are plotted as per (C).
Figure 4
Figure 4. A role for TCR affinity in the thymic Treg cell selection “niche”
(A) Inverse relationship between clonal frequency and Treg cell development. Thymic Treg cell development was assessed in mixed bone marrow chimeras with varying ratios of WT to retrovirally transduced bone marrow. Data shown are the percentage of Foxp3+CD4SP cells versus the clonal frequency in the CD4SP subset for the indicated TCR. Each symbol represents data from an individual recipient from 3–5 independent experiments for each TCR. Data points in the dashed red boxes fall outside of the previously described inverse relationship. (B) Data from the experiment shown in (A) are plotted log-log to illustrate the similar slopes, with differences in the intercept. Note that the points in the red boxes are not shown in this plot. (C) Absolute number of Treg cells from the data shown in (B) are plotted versus clonal frequency. (D) Correlation of Treg cell selection niche size to TCR affinity. The number of Foxp3+ cells was analyzed by linear regression with OVA-reactivity measured by NFAT activation (upper) and tetramer binding (lower) as per Figure 3. Each symbol represents an individual TCR as indicated in the legend.
Figure 5
Figure 5. Treg cell development coincident with negative selection by high affinity TCRs
(A) Analysis of mixed bone marrow chimeras. Data from Figure 4 are plotted to compare the frequency of TCR+ cells (Thy1.1+CD45.1+CD45.2) amongst total DP (x-axis) and CD4SP (y-axis) cells in WT versus RIP-mOVA recipients. Each dot represents data from an individual recipient. (B) Negative selection of CD4SP thymocytes. TCR expressing CD4SP thymocytes and Cell-Trace Violet labeled WT cells were intrathymically injected into WT and RIP-mOVA mice. Flow cytometry was performed 3 days later. Negative selection was assessed by the ratio of OVA-specific CD4SP cells to WT cells added as an injection control. Each dot represents an individual recipient, with 2 independent experiments per TCR. Statistical differences were accessed by unpaired t test (left). The percent difference in the mean values from WT compared with RIP-mOVA hosts is shown for each TCR (right).
Figure 6
Figure 6. High affinity TCR recognition of peripheral self-antigen is required to elicit peripheral naive T cell responses
(A) Peripheral T cells responses to RIP-mOVA. Naive peripheral Foxp3CD4+ T cells were intravenously transferred into sublethally irradiated RIP-mOVA recipients. Representative flow cytometry plots are shown of the transferred splenic T cells after 14 days to determine proliferation via dilution of Cell-Trace Violet dye (left). Frequencies of proliferated cells are summarized for each TCR (middle), and CD44 expression is shown (right). Each dot represents data from a single recipient, with 2 independent experiments per TCR. (B) Peripheral T cell responses to abundant antigen. Naive peripheral Foxp3CD4+ T cells were intravenously transferred into normal WT recipients immunized with OVA protein-Alum, and proliferation of the transferred T cells in the spleen was analyzed after 7 days. Representative flow cytometric plots of proliferation are shown on the left and summarized in the middle graph. Each dot represents an individual recipient, with 2–3 independent experiments per TCR. Representative CD44 expression is shown on the right.

Comment in

References

    1. Apostolou I, Sarukhan A, Klein L, von Boehmer H. Origin of regulatory T cells with known specificity for antigen. Nature Immunology. 2002;3:756–763. - PubMed
    1. Atibalentja DF, Byersdorfer CA, Unanue ER. Thymus-blood protein interactions are highly effective in negative selection and regulatory T cell induction. J Immunol. 2009;183:7909–7918. - PMC - PubMed
    1. Bautista JL, Lio CW, Lathrop SK, Forbush K, Liang Y, Luo J, Rudensky AY, Hsieh CS. Intraclonal competition limits the fate determination of regulatory T cells in the thymus. Nat Immunol. 2009;10:610–617. - PMC - PubMed
    1. Bouneaud C, Kourilsky P, Bousso P. Impact of negative selection on the T cell repertoire reactive to a self-peptide: a large fraction of T cell clones escapes clonal deletion. Immunity. 2000;13:829–840. - PubMed
    1. Bredemeyer AL, Helmink BA, Innes CL, Calderon B, McGinnis LM, Mahowald GK, Gapud EJ, Walker LM, Collins JB, Weaver BK, et al. DNA double-strand breaks activate a multifunctional genetic program in developing lymphocytes. Nature. 2008;456:819–823. - PMC - PubMed

Publication types

MeSH terms