. 2012 Sep 27;2(3):674-84.
doi: 10.1016/j.celrep.2012.07.011. Epub 2012 Aug 23.

Identification of cytoplasmic capping targets reveals a role for cap homeostasis in translation and mRNA stability

Affiliations

Identification of cytoplasmic capping targets reveals a role for cap homeostasis in translation and mRNA stability

Chandrama Mukherjee et al. Cell Rep. .

Abstract

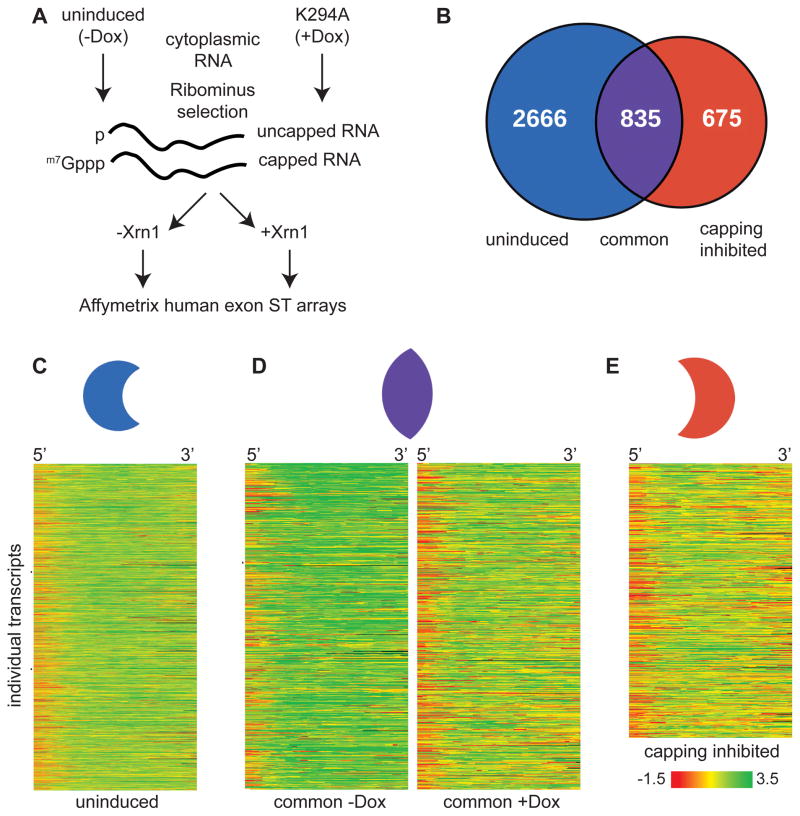
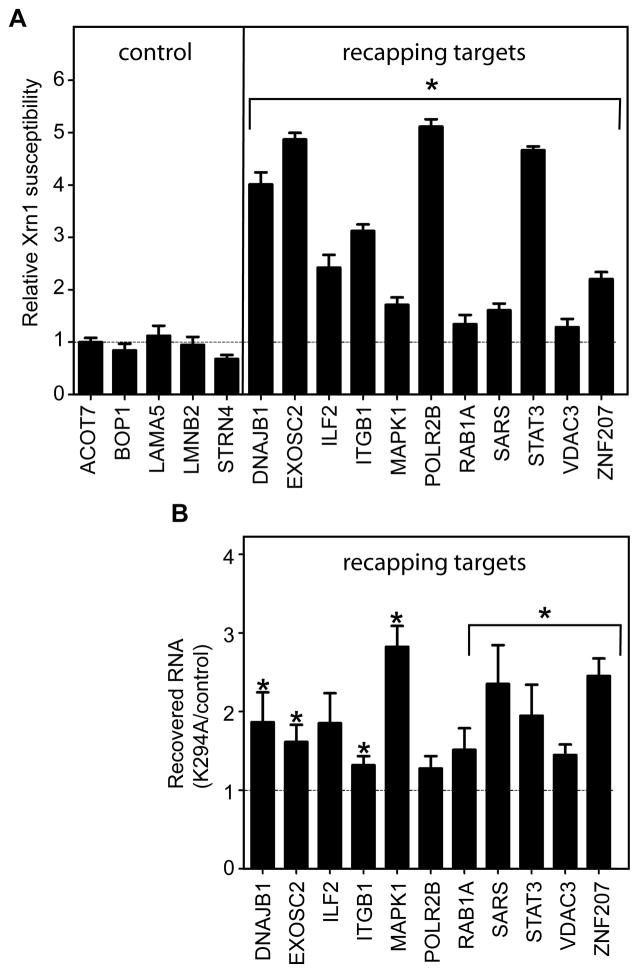
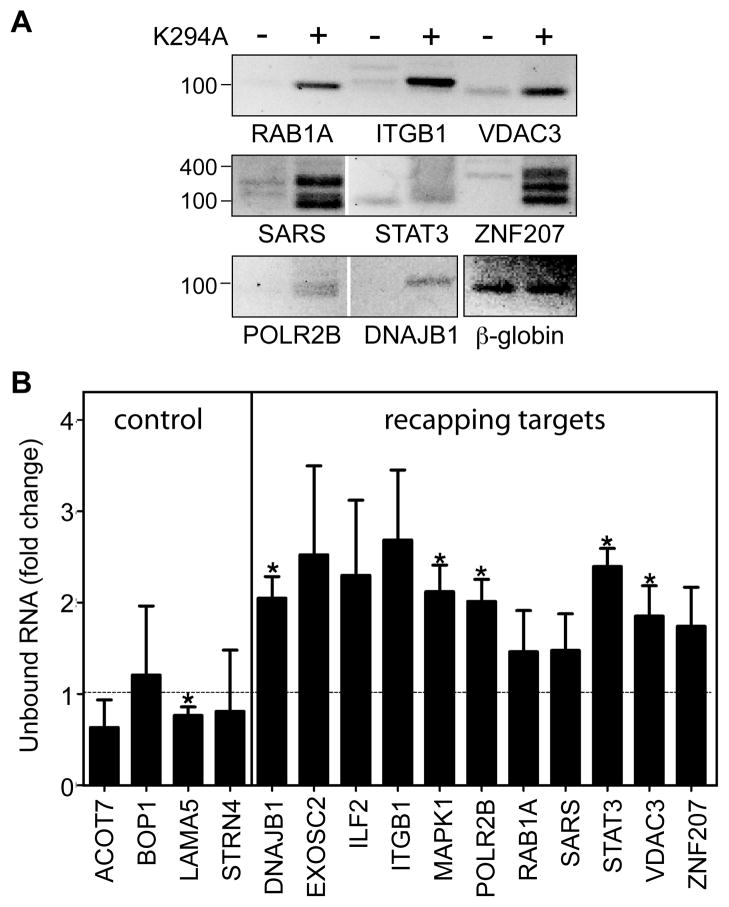
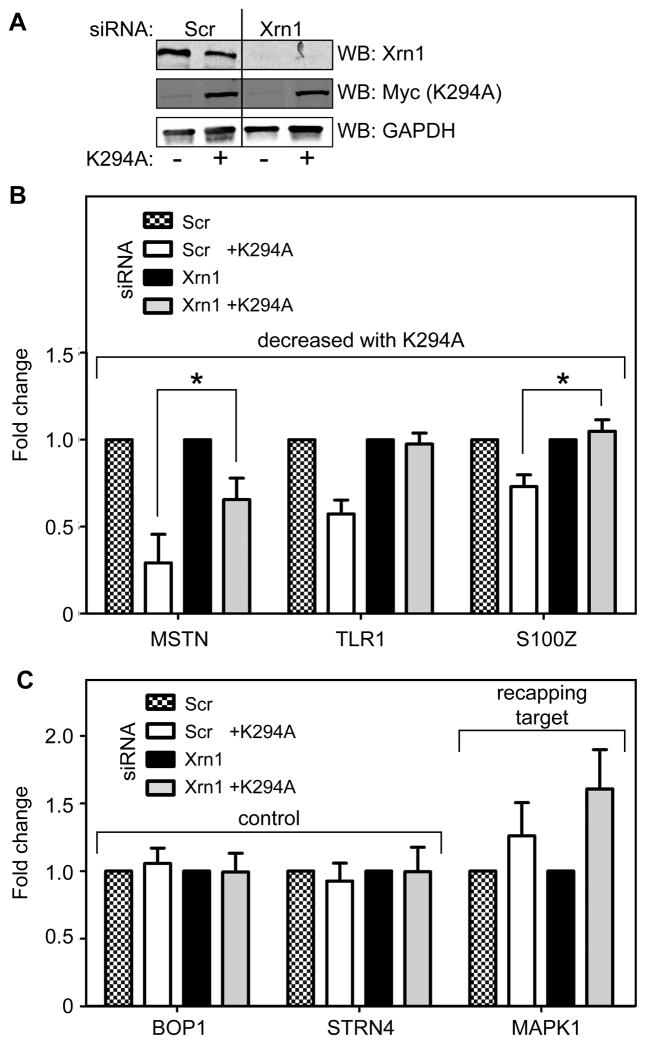
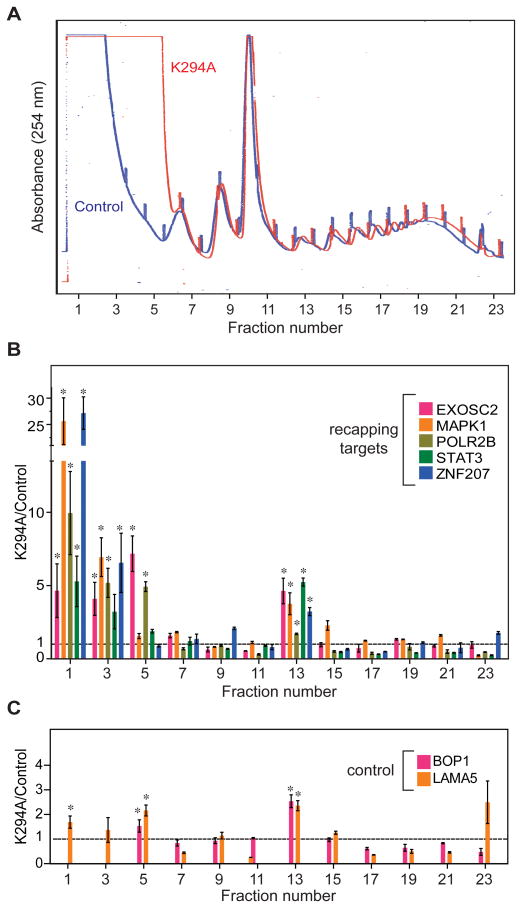
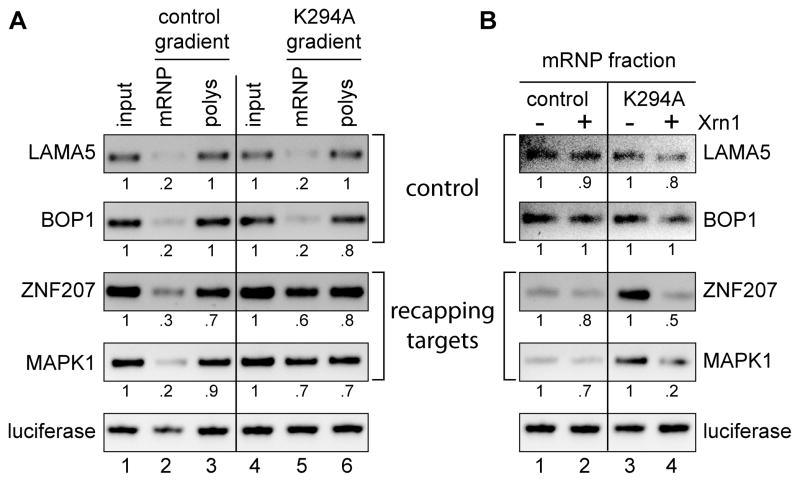
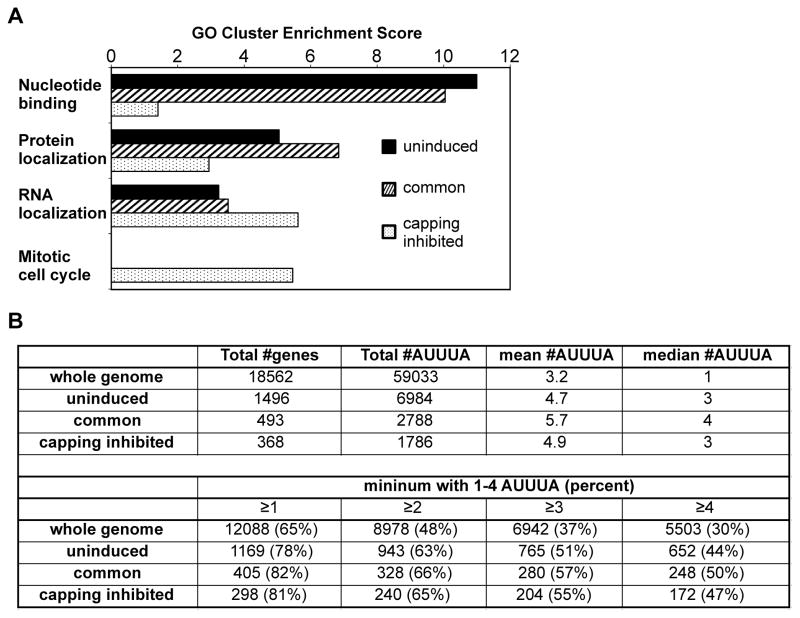
The notion that decapping leads irreversibly to messenger RNA (mRNA) decay was contradicted by the identification of capped transcripts missing portions of their 5' ends and a cytoplasmic complex that can restore the cap on uncapped mRNAs. In this study, we used accumulation of uncapped transcripts in cells inhibited for cytoplasmic capping to identify the targets of this pathway. Inhibition of cytoplasmic capping results in the destabilization of some transcripts and the redistribution of others from polysomes to nontranslating messenger ribonucleoproteins, where they accumulate in an uncapped state. Only a portion of the mRNA transcriptome is affected by cytoplasmic capping, and its targets encode proteins involved in nucleotide binding, RNA and protein localization, and the mitotic cell cycle. The 3' untranslated regions of recapping targets are enriched for AU-rich elements and microRNA binding sites, both of which function in cap-dependent mRNA silencing. These findings identify a cyclical process of decapping and recapping that we term cap homeostasis.


Figures

Figure 1
Figure 1. Identification of cytoplasmic capping targets
(A) The flowchart depicts the strategy used to identify uncapped transcripts from cells that were stably transfected with an inducible form of cytoplasmic capping enzyme in which the active site lysine was changed to alanine (K294A). Cytoplasmic RNA was isolated from triplicate cultures that were treated without and with doxycycline to induce K294A expression. After removal of ribosomal RNA one-half of each preparation was treated with Xrn1 to degrade uncapped RNA, and each preparation was analyzed on individual Affymetrix Human Exon ST 1.0 microarrays. (B) Venn diagram illustrating the number of transcripts identified as having uncapped forms only in cells in which K294A was not expressed (uninduced, blue), those having uncapped forms only in K294A-expressing cells (capping inhibited, red) and those that were identified in both populations (common, purple). The individual transcripts in each of these groups are listed in Table S1. (C,D,E) Heat maps of each of the transcript sets for uninduced, common and K294A datasets. Each line represents the average difference in probe intensity as a function of Xrn1 digestion across the first 1500 nucleotides of individual transcripts. Different transcripts are represented in (C) and (E), however in (D) the same transcripts of the Common set are compared between control and K294A-expressing cells.
Figure 2
Figure 2. Validation of cytoplasmic capping enzyme targets based on changes in 5′-monophosphate ends
(A) Five controls and 11 transcripts that were identified as recapping targets in Fig. 1 were selected for validation of changes in cap status as a function of K294A expression. Poly(A)-selected RNA from triplicate cultures of control and K294A-expressing cells was treated ±Xrn1 and analyzed by qRT-PCR using primers close to the 5′ end of the transcripts (see Supplemental Materials and Methods). β-actin was used as an internal control and the change in Xrn1 susceptibility is presented as ΔXK294A/ΔXControl ratio, where ΔXControl is the relative loss of transcript 5′ ends in control, and ΔXK294A is their relative loss in K294A-expressing cells. A ratio of 1 indicates no change in Xrn1 susceptibility as a consequence of K294A expression and all of the results are normalized to this value. (B) Selective ligation-mediated recovery of uncapped transcripts as a function of K294A expression. Poly(A) selected cytoplasmic RNA from triplicate cultures of control and K294A-expressing cells was ligated to an RNA adaptor. This was hybridized to a complementary biotinylated antisense DNA oligonucleotide, the duplex was recovered on streptavidin paramagnetic beads, and the recovered RNA was analyzed by qRT-PCR using the same primers as in (A). The Ct values for each gene were normalized against the internal control uncapped β-globin RNA present in each sample prior to ligation, and the normalized Ct value for RNA from control cells was arbitrarily set to 1. For (A) and (B) statistical significance (paired two-tailed Student’s t-test (* p<0.05)) was determined by comparing the values to those of control, which included relative standard deviations calculated from technical and biological replicates. The results represent the mean ±standard deviation for 3 independent biological replicates.
Figure 3
Figure 3. 5′-RACE and cap affinity chromatography confirm uncapped transcripts accumulate in K294A-expressing cells
(A) 5′-RACE was performed on the pooled primer-ligated RNAs from Figure 2B using a primer complementary to the ligated RNA adapter and a downstream primer within the body of each transcript. RACE products were separated on a 1.2% agarose gel and visualized by staining. The panel at the bottom right of the figure shows the 5′-RACE products of the internal uncapped β-globin mRNA control. (B) Cytoplasmic RNA from control and K294A-expressing cells was incubated with glutathione Sepharose bound with a heterodimer of GST-eIF4E plus GST-tagged eIF4E-binding domain of eIF4G. qRT-PCR was performed on unbound RNA using the same primers as in Figure 2, and Ct values for each transcript were normalized to the internal uncapped β-globin RNA control. The normalized Ct value for control samples was set to 1, and statistical analysis was performed as in Figure 2 (* p<0.05). The results are presented as mean ±standard deviation for 3 independent biological replicates.
Figure 4
Figure 4. A role for cytoplasmic capping in maintaining transcript stability
(A) Cells were transfected with siRNAs against Xrn1 (Xrn1) or a scrambled control (Scr) prior to inducing K294A in half of the cultures. Western blotting with antibodies to Xrn1 and the Myc tag on K294A was used to assess the effectiveness of Xrn1 knockdown and K294A induction, and GAPDH was also analyzed as a loading control. (B) qRT-PCR was used to assess changes in the steady-state levels of 3 of the transcripts that showed the greatest degree of loss between control and K294A-expressing cells (see Supplemental Table S2), and the impact of Xrn1 knockdown on this. The relative amount of each transcript (MSTN and S100Z, * p<0.05, paired two-tailed Student’s t-test) was increased by knockdown of Xrn1 in K294A-expressing cells. (C) A similar analysis was performed on two control transcripts (BOP1, STRN4), and one of the recapping targets analyzed in Figures 2 and 3 (MAPK1). In each of these analyses the level of a particular transcript in uninduced cells transfected with the scrambled control siRNA was arbitrarily set to one. Results in (B) and (C) are shown as the mean ±standard deviation for 3 independent biological replicates.
Figure 5
Figure 5. Expression of K294A alters the distribution of recapping targets between polysomes and non-translating mRNP
(A) Cytoplasmic extracts from control (blue) and K294A-expressing cells (red) were fractionated on 10–50% sucrose gradients. The gradients were collected from the top with continuous monitoring of absorbance at 254 nm. These profiles are representative of gradients done with extracts from 3 independent cultures. (B) Prior to isolating RNA each fraction received an equal amount of a dephosphorylated firefly luciferase RNA with a 98 nt poly(A) tail as a normalization control. RNA recovered from odd-numbered fractions of each gradient was analyzed as in Figures 2–4 by qRT-PCR using primers for 5 recapping targets (EXOSC2, MAPK1, POLR2B, STAT3, ZNF207). The primer sets in this experiment were located near the 3′ end of each transcript (Supplemental Experimental Procedures) to avoid loss of signal from 5′ end trimming, and results are presented as the amount of each transcript in a particular fraction from K294A-expressing cells compared to the transcript in the same gradient fraction from control cells. (C) The same analysis was performed as in (B) using primers for 2 control transcripts (BOP1, LAMA5). The results from individual fractions were analyzed by paired two-tailed Student’s t-test (* p<0.05), and the data are presented as the mean ±standard deviation from 3 independent replicates.
Figure 6
Figure 6. The recapping targets that accumulate in non-translating mRNP are uncapped
(A) RNA was recovered from each of the input cytoplasmic extracts from Figure 5 (input), and pooled mRNP (1,3,5) and polysome fractions (13,15,17,19,21) from each gradient. Each pool received an equal amount of dephosphorylated firefly luciferase RNA as an internal control prior to RNA purification, which was followed by cDNA synthesis, and the cDNAs were analyzed by semi-quantitative RT-PCR using the same 3′-weighted primers as in Figure 5(B and C). The products were separated on a 1.2% agarose gel and quantified using a BioRad GelDoc Imager and Quantity One 1-D gel analysis software. Results were normalized to the internal luciferase control. (B) Sucrose step gradients were used to recover mRNP fractions from triplicate cultures of control and K294A-expressing cells. An equal amount of dephosphorylated firefly luciferase RNA was added to each sample as an Xrn1-resistant control and the recovered RNA was treated Xrn1 to degrade uncapped transcripts. Individual samples were amplified by semi-quantitative RT-PCR using primers located near the 5′ ends of two recapping targets (ZNF207, MAPK1) and two controls (BOP1, LAMA5), the pooled products were separated on a 1.2% agarose gel and visualized and quantified as in (A).
Figure 7
Figure 7. Properties of recapping targets
(A) Gene ontology analysis of transcripts in the uninduced, common and capping inhibited transcripts sets was performed using the NIH DAVID tool with default settings and high stringency. The top 4 cluster groupings are shown as a function of each of the transcript sets, with additional groupings in Supplemental Table S3. (B) A python script was developed to search the AREsite database for AUUUA elements present in the 3′-UTRs of the genes that correspond to the 55,662 Ensembl transcripts that were analyzed in Figure 1. The upper panel details the total number of AUUUA elements and the mean and median number of elements per transcript in each dataset, and in the lower panel these are broken down by the percentage of transcripts with different numbers of AUUUA elements.

References

    1. Anderson P, Kedersha N. Stressful initiations. J Cell Sci. 2002;115:3227–3234. - PubMed
    1. Bazzini AA, Lee MT, Giraldez AJ. Ribosome profiling shows that miR-430 reduces translation before causing mRNA decay in Zebrafish. Science. 2012;336:233–237. - PMC - PubMed
    1. Bremer KA, Stevens A, Schoenberg DR. An endonuclease activity similar to Xenopus PMR1 catalyzes the degradation of normal and nonsense-containing human beta-globin mRNA in erythroid cells. RNA. 2003;9:1157–1167. - PMC - PubMed
    1. Chu C, Shatkin AJ. Apoptosis and autophagy induction in mammalian cells by siRNA knockdown of mRNA capping enzymes. Mol Cell Biol. 2008;28:5829–36. - PMC - PubMed
    1. Das Gupta J, Gu H, Chernokalskaya E, Gao X, Schoenberg DR. Identification of two cis-acting elements that independently regulate the length of poly(A) on Xenopus albumin pre-mRNA. RNA. 1998;4:766–776. - PMC - PubMed

Publication types

Associated data