. 2012 Aug 31;150(5):1002-15.
doi: 10.1016/j.cell.2012.07.017. Epub 2012 Aug 23.

A bistable circuit involving SCARECROW-RETINOBLASTOMA integrates cues to inform asymmetric stem cell division

Affiliations

A bistable circuit involving SCARECROW-RETINOBLASTOMA integrates cues to inform asymmetric stem cell division

Alfredo Cruz-Ramírez et al. Cell. .

Abstract

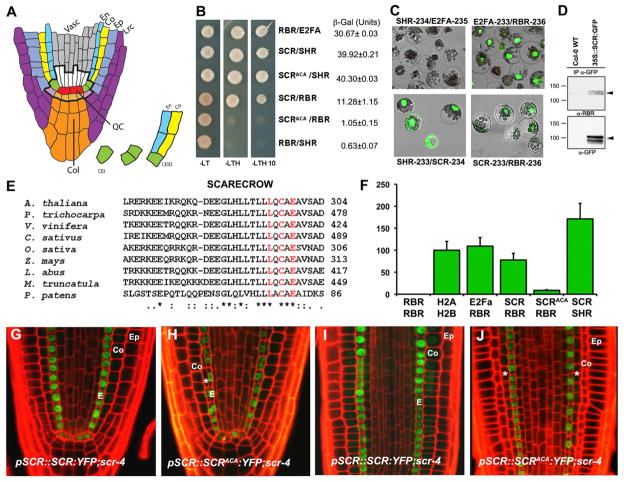
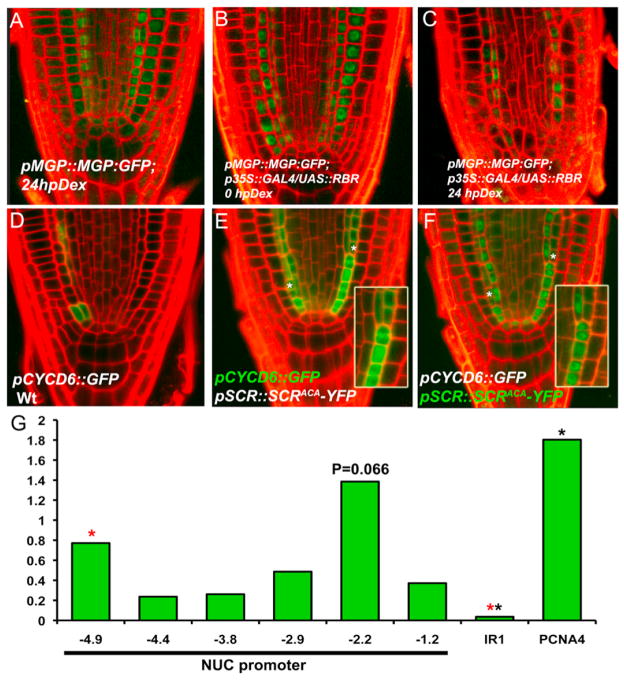
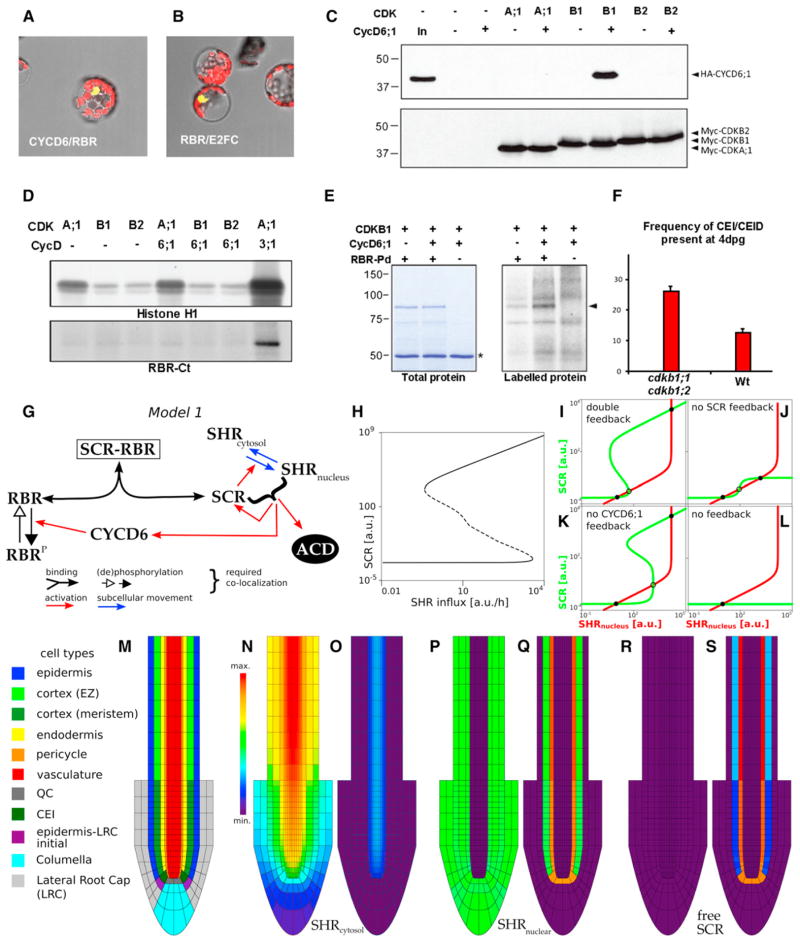
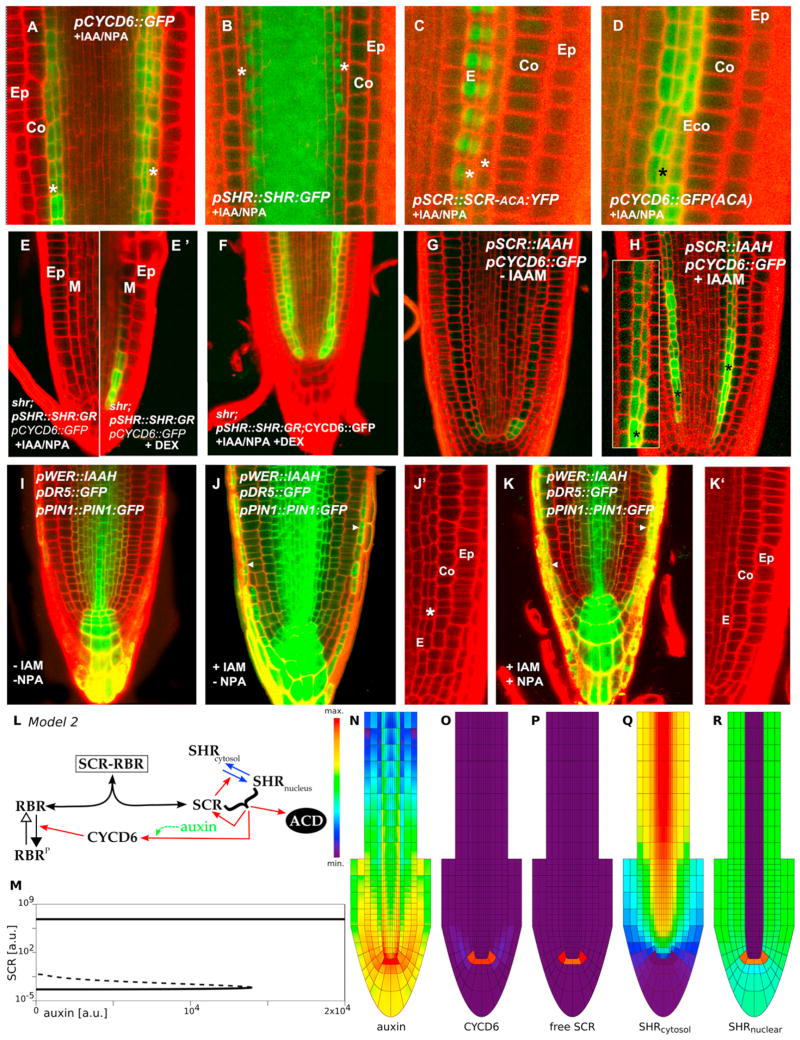
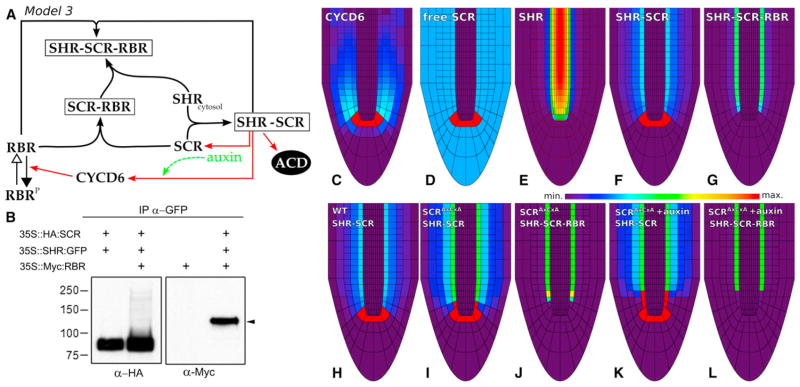
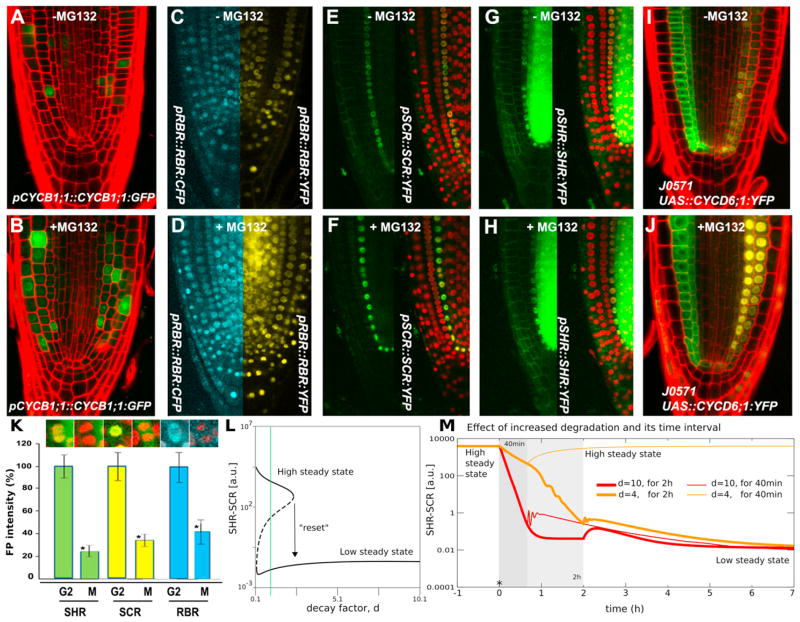
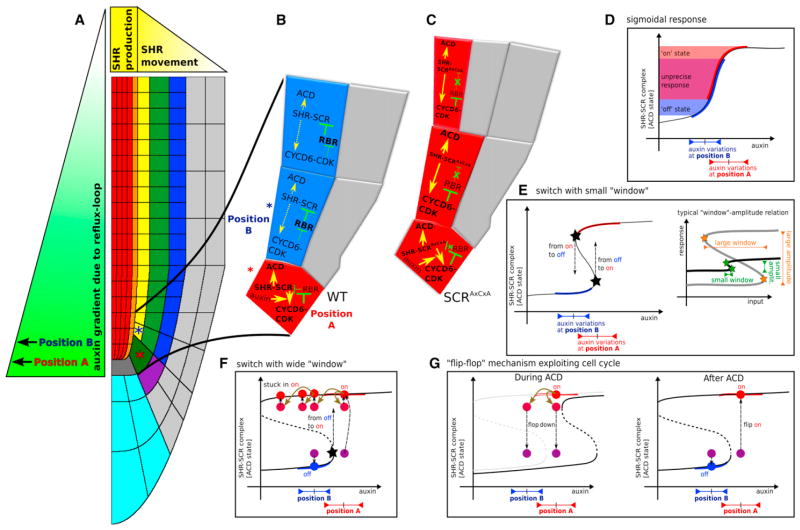
In plants, where cells cannot migrate, asymmetric cell divisions (ACDs) must be confined to the appropriate spatial context. We investigate tissue-generating asymmetric divisions in a stem cell daughter within the Arabidopsis root. Spatial restriction of these divisions requires physical binding of the stem cell regulator SCARECROW (SCR) by the RETINOBLASTOMA-RELATED (RBR) protein. In the stem cell niche, SCR activity is counteracted by phosphorylation of RBR through a cyclinD6;1-CDK complex. This cyclin is itself under transcriptional control of SCR and its partner SHORT ROOT (SHR), creating a robust bistable circuit with either high or low SHR-SCR complex activity. Auxin biases this circuit by promoting CYCD6;1 transcription. Mathematical modeling shows that ACDs are only switched on after integration of radial and longitudinal information, determined by SHR and auxin distribution, respectively. Coupling of cell-cycle progression to protein degradation resets the circuit, resulting in a "flip flop" that constrains asymmetric cell division to the stem cell region.


Figures

Figure 1
Figure 1. A Conserved LxCxE Motif in SCR Mediates Direct Binding to RBR
(A) Root stem cell niche organization and cell transitions and divisions defining ground tissue lineages. (B) Yeast two-hybrid analyses showing and quantifying SCR-RBR interaction. RBR-E2FA and SCR-SHR combinations are positive controls, and RBR-SHR is the negative control. (C) SCR-RBR binding by BiFC in Arabidopsis mesophyll protoplasts. RBR-E2FA and SCR-SHR are positive controls. (D) Coimmunoprecipitation of RBR with α-GFP antibody in WT and 35S::SCR:GFP root extracts. Black arrow marks endogenous RBR in top panel and SCR-GFP in lower panel. (E) Protein sequence alignment of SCR orthologs in seed plants and P. patens moss showing conservation of the LxCxE motif. (F) In vivo interaction strengths from split Renilla luciferase assay in mesophyll protoplasts. RLUs were normalized to H2A-H2B interaction strength. Arrow bar represents SEM. (G–J) Confocal laser scanning microscope (CLSM) of longitudinal root sections of 5 dpg. scr4-1 plants complemented with WT SCR (G and I) and SCRAxCxA (H and J). Ep, epidermis; Co, cortex; E, endodermis;*, extra ground tissue layer. See also Figure S1.
Figure 2
Figure 2. RBR-SCR Interaction Affects the Expression of SCR-SHR Direct Targets
(A–C) pMGP::MGP:GFP protein fusion expression in WT (A) and inducible RBR overexpressor line before (B) and after transfer for 24 hr (C) to Dex-amethazone (hpDex). (D–F) pCYCD6;1::GFP fusion expression in WT (D) and in scr4-1;SCRAxCxA (E); note the correlation between expansion of pCYCD6;1::GFP expression domain and appearance of extra ACDs, marked with asterisks; asymmetric segregation of pSCR::SCRAxCxA:YFP in the same plant (F). (G) ChIP-qPCR using RBR antibody and primers to specific regions of NUC, PCNA, and IR1 promoters. Black asterisks, Student’s t test (p < 0.05); fragment −2.2 showed variable enrichment in biological replicates.
Figure 3
Figure 3. Specific Interaction between CDKB1 and CYCD6;1 Forms a Protein Complex that Phosphorylates RBR
(A and B) BiFC assays for in vivo interaction between CYCD6 and RBR (A) with E2FC/RBR as positive control (B). (C) Myc-CDK and HA-CYCD6;1 proteins expressed in Arabidopsis protoplasts. Protein gel blots of complexes immunoprecipitated with anti-c-Myc antibodies using anti-HA and anti-c-Myc antibodies to detect CYCD6;1 binding and CDK expression, respectively. (D) Myc-CDK expressed in Arabidopsis protoplasts either alone or together with HA-CYCD6;1 or HA-CYCD3;1 and precipitated with anti-c-Myc antibody. Kinase activity of immunocomplexes in the presence of [γ-32P]ATP using histone H1 and GST-RBR-Ct proteins as substrates and detected by autoradiography of protein gels. (E) Kinase activity of CDKB1 and CDKB1-CYCD6;1 expressed in protoplasts in the presence of [γ-32P]ATP using GST-RBR pocket domain (GST-RBR-Pd) as substrate, detected by autoradiography. Asterisk marks IgG heavy chain. (F) Frequency of undivided CEI and CEIDs in roots of WT and ckdb1;1 cdkb1;2 seedlings 4 dpg. Differences are significant (t test < 0.05); error bars indicate SEM. (G) Schematic of model 1. (H) Bifurcation diagram with equilibrium levels of free SCR as a function of SHR influx into the cell. Dashed line indicates unstable equilibria. Both a high and a low stable SCR level exist over a wide range of influx. (I–L) Phase plane analysis of model 1 using quasi-steady-state assumptions (see Figure S2). (I) Model 1 presents two stable equilibria (solid black circles, one of high SCR and nuclear SHR levels and the other of low SCR and nuclear SHR levels) separated by an unstable equilibrium (open circle). (J and K) When the activation mediated by CYCD6;1 or the feedback of SCR and nuclear SHR on SCR transcription is turned off, the model continues presenting bistability. (L) Without either of these feedbacks, no bistability occurs for any parameter setting. (M) Root layout for all spatial simulations. (N–S) Cytosolic SHR (N and O), nuclear SHR (P and Q), and free SCR (R and S) for weak (N, P, and R) and strong (O, Q, and S) activation mediated by CYCD6;1 (see “Modeling Procedures,” Figure S2, and Tables S1 and S2). Molecular weight standards are indicated in kilodaltons.
Figure 4
Figure 4. Network Model within Tissue Context Presents Bistable Switch Where Auxin-Dependent CYCD6;1 Activation by SHR-SCR Limits ACD to the CEI
(A–K) IAA+NPA treatments in Col-0;pCYCD6;1::GFP (A), Col-0;pSHR::SHR:GFP (B), and scr4-1;ACA; pCYCD6;1::GFP (C) and (D). shr;pSHR::SHR:GR; pCYCD6;1::GFP seedlings treated with IAA+NPA (E), same seedling after SHR induction by Dex treatment showing pCYCD6;1::GFP expression (E′), and seedling treated with both IAA+NPA and Dex for 24 hr (F). Effect of local increase of auxin levels in endodermis revealed in the pSCR::IAAH; pCYCD6;1::GFP line in absence (G) and presence (H) of the substrate IAM. Phenotype and expression patterns of Col-0;pWER::IAAH;pPIN1::PIN1:GFP;pDR5::GFP roots of 5 dpg seedlings grown in MS media and transferred for 2 days to media in absence (I) and presence of the substrate IAM (J and J′) and in the presence of IAM and NPA (K and K′). Arrowheads in (J) and (K) point to increased pDR5::GFP expression in the LRC, indicating auxin synthesis. Ep, epidermis; Co, cortex; E, endodermis; Eco, extra cortex layer; M, mixed identity ground tissue layer; *, extra ground tissue layer. (L) Schematic of model 2. The green arrow indicates the extension of the model, which takes the effect of auxin into account. (M) Bifurcation diagram showing equilibrium levels of free SCR as a function of auxin levels. A switch-like behavior occurs when auxin levels are increased, but the system does not “turn off” when the levels are subsequently decreased. (N–R) The spatial simulations show the triggering of the ACD cell state in the QC and CEI/CEID cells. (N) auxin; (O) CYCD6;1; (P) free SCR; (Q) cytosolic SHR; and (R) nuclear SHR levels. (See also “Modeling Procedures,” Figure S3, and Tables S2 and S3.)
Figure 5
Figure 5. Auxin Concentration Influences CYCD6;1 Expression and Modulates Ground Tissue ACDs
(A) Schematic of model 3. (B) Complex formation between SHR-GFP, HA-SCR, and Myc-RBR proteins expressed in Arabidopsis protoplasts and purified by binding to GFP affinity beads. (C–G) Spatial simulations show the triggering of the ACD cell state in the QC and CEI/CEID cells and the confinement of SHR in the endodermis. Profiles within the root tip of (C) CYCD6;1; (D) free SCR; (E) SHR; (F) SHR-SCR; and (G) SHR-SCR-RBR levels. (See also “Modeling Procedures,” Figure S4, and Movie S1.) (H–J) A 75% reduction of the binding of SCR to RBR, as to mimic the SCR (see also Movie S2). (K and L) Treatment of the SCR with auxin (see also Movie S2). Color bar represents relative concentration levels. See Supplemental Information, Figure S4, and Table S4 for full details.
Figure 6
Figure 6. Protein Degradation Turns “Off” the Switch
(A–K) Expression patterns prior to and after MG132 treatment for pCYCB1;1:: CYCB1;1:GFP (A and B), pRBR::RBR:CFP/pRBR::RBR:YFP (C and D), pSCR::SCR:YFP/p35S::H2B:RFP (E and F), pSHR::SHR:YFP/p35S::H2B:RFP (G and H), and J0571/pUAS::CYCD6;1:YFP (I and J). Quantification of total fluorescence intensity before and after mitosis for pSHR::SHR:YFP/p35S::H2B:RFP, pSCR::SCR:YFP/p35S::H2B:RFP, and pRBR::RBR:CFP/p35S::H2B:RFP plants (K); Student’s t test was used to assess the statistical significance of the distributions (*p < 0.05). Arrow bar represents SEM. (L) Bifurcation diagram showing equilibrium SHR-SCR levels as a function of the level of enhanced protein degradation, d. (M) Time dynamics for intermediate (40 min, thin lines) and long (2 hr, thick lines) time span of enhanced protein degradation. Red, d = 10; orange, d = 4. See also Figure S5.
Figure 7
Figure 7. “Flip-Flop” Mechanism Exploiting Cell Cycle
(A–C) Schematic of root with SHR and auxin gradient. Red asterisk indicates CEI/CEID cell in ACD “on” state, receiving higher auxin levels (position A); blue asterisk indicates endodermal/cortex cell in CEI “off” state, receiving lower auxin levels (position B). (D) Due to natural auxin variations at position A and B, a sigmoidal response would lead to an imprecise outcome. (E) (left) With a bistable switch, a small window of bistability would be required to change the ACD cell state (right). Such a small window of bistability, combined with highly distinct cell differentiation states, lacks robustness. (F) A robust wide window of bistability leads to sustained ACDs in the endodermal cells. (G) Enhanced protein breakdown during cell cycle shifts the window of bistability, causing ACD cell states in the daughter cells to turn down (flop); a rapid collapse in sustenance of the ACD cell state (left). Afterward, a rapid recovery of the ACD cell state (flip on) can take place in CEI/CEID cells due to high auxin levels, but not in endodermal and cortex cells, which turn off their ACD cell state (right).

References

    1. Abrash EB, Bergmann DC. Asymmetric cell divisions: a view from plant development. Dev Cell. 2009;16:783–796. - PubMed
    1. Alon U. Network motifs: theory and experimental approaches. Nat Rev Genet. 2007;8:450–461. - PubMed
    1. Berman SD, Yuan TL, Miller ES, Lee EY, Caron A, Lees JA. The retinoblastoma protein tumor suppressor is important for appropriate osteoblast differentiation and bone development. Mol Cancer Res. 2008;6:1440–1451. - PMC - PubMed
    1. Boniotti MB, Gutierrez C. A cell-cycle-regulated kinase activity phosphorylates plant retinoblastoma protein and contains, in Arabidopsis, a CDKA/cyclin D complex. Plant J. 2001;28:341–350. - PubMed
    1. Borghi L, Gutzat R, Fütterer J, Laizet Y, Hennig L, Gruissem W. Arabidopsis RETINOBLASTOMA-RELATED is required for stem cell maintenance, cell differentiation, and lateral organ production. Plant Cell. 2010;22:1792–1811. - PMC - PubMed

Publication types