. 2012 Oct;13(10):1010-9.
doi: 10.1038/ni.2402. Epub 2012 Aug 26.

Transcription factor Foxp3 and its protein partners form a complex regulatory network

Affiliations

Transcription factor Foxp3 and its protein partners form a complex regulatory network

Dipayan Rudra et al. Nat Immunol. 2012 Oct.

Abstract

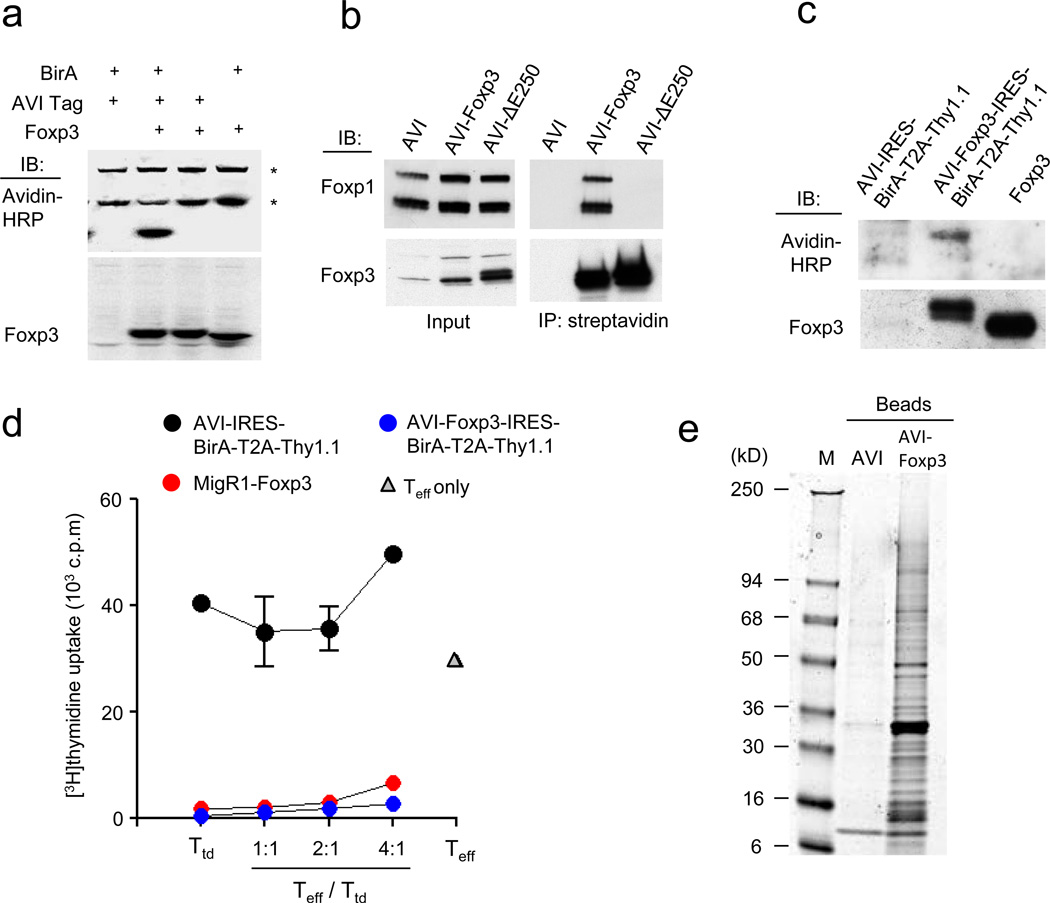
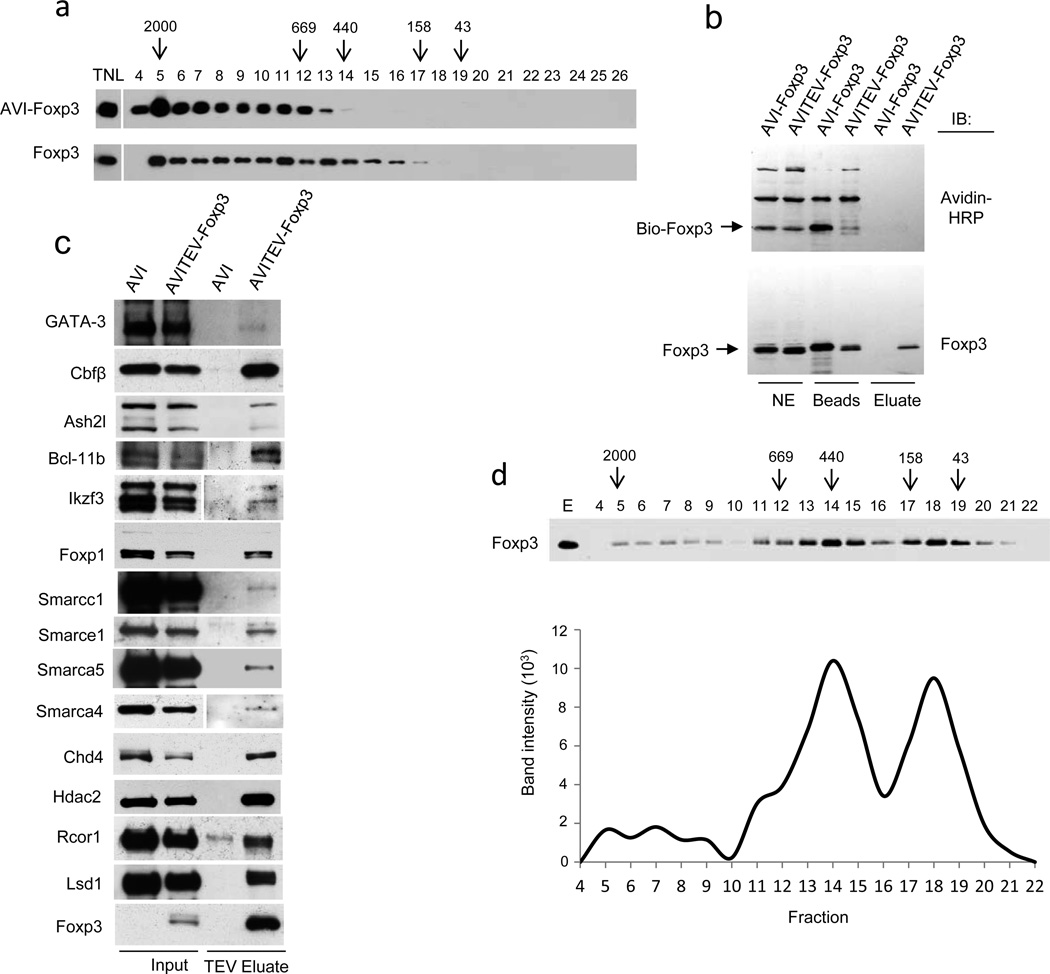
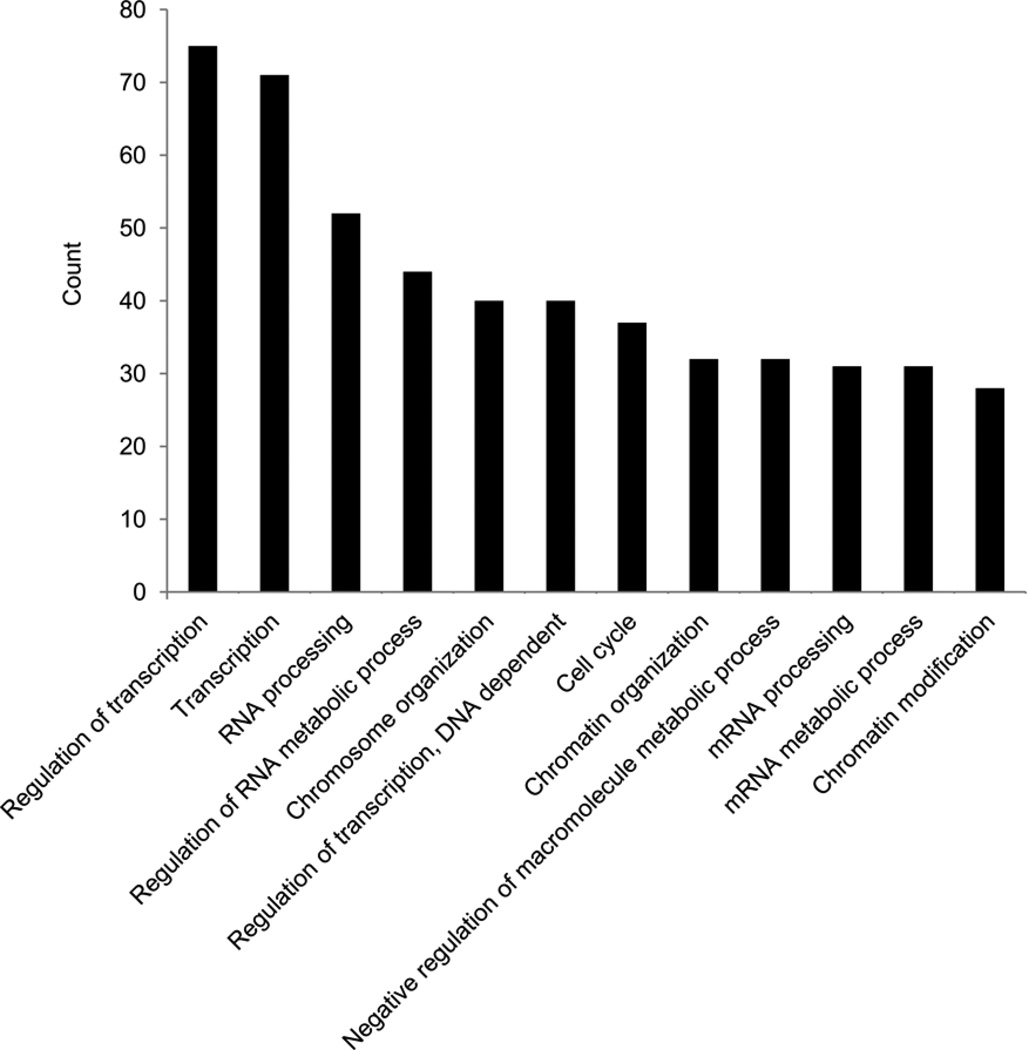
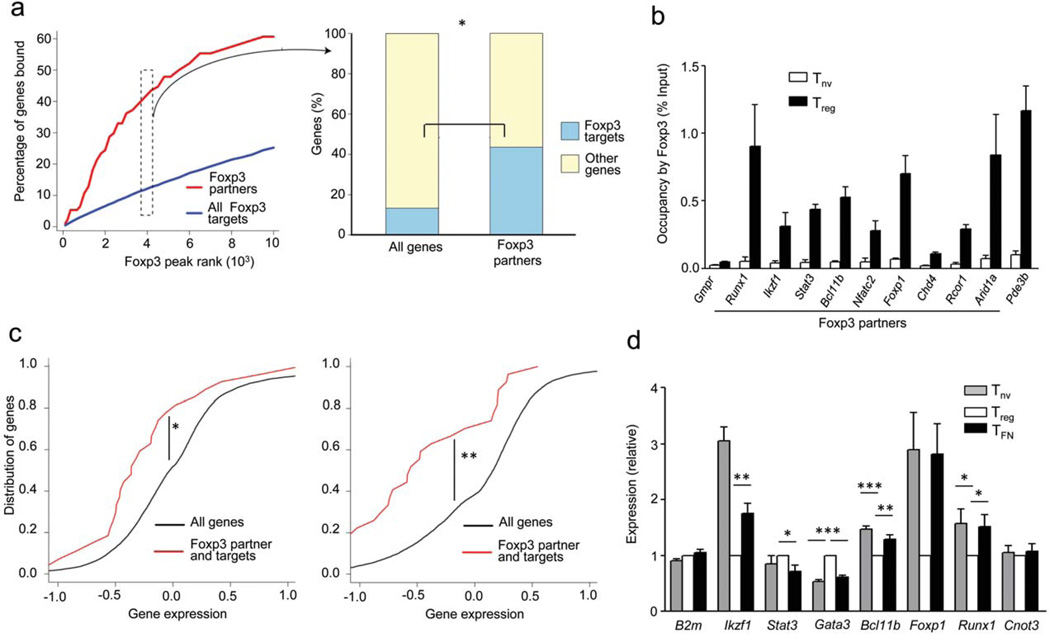
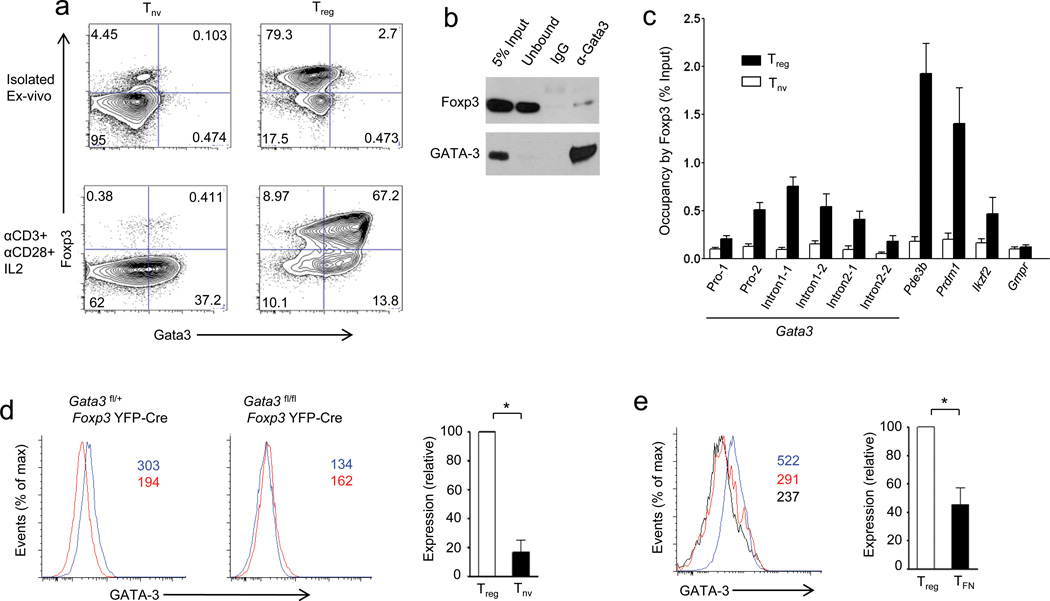
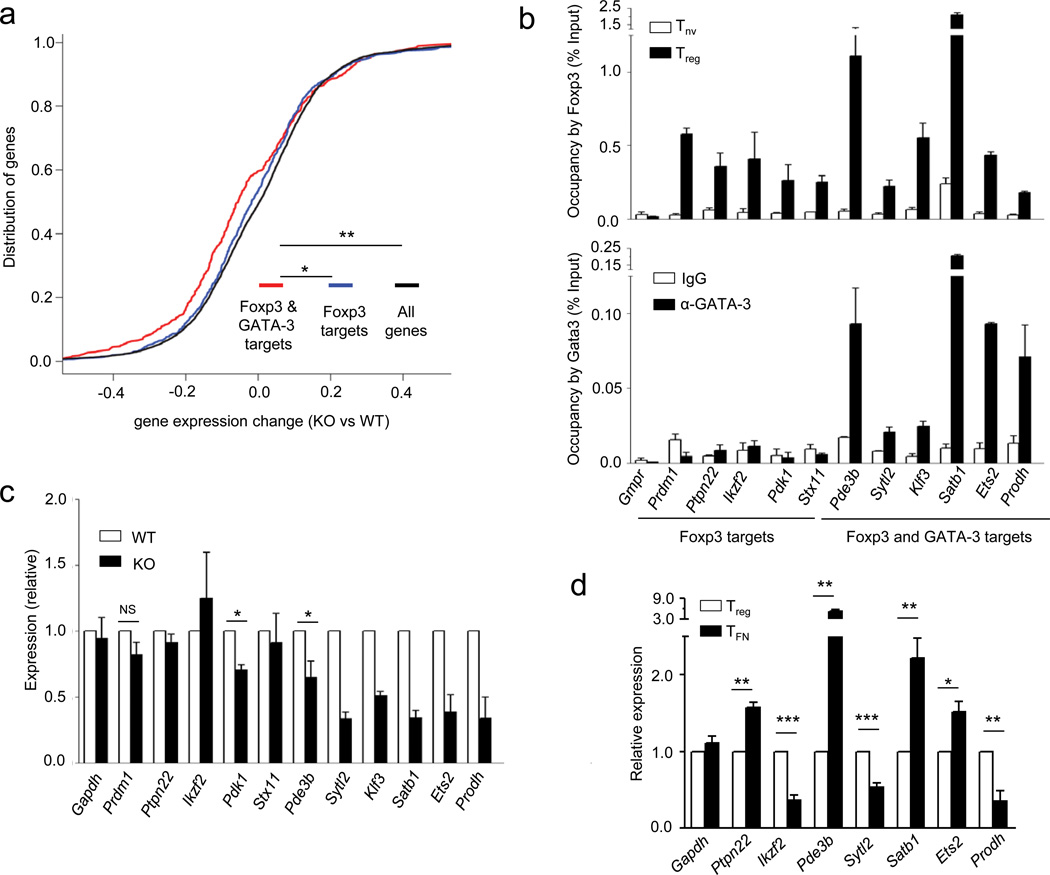
The transcription factor Foxp3 is indispensible for the differentiation and function of regulatory T cells (T(reg) cells). To gain insights into the molecular mechanisms of Foxp3-mediated gene expression, we purified Foxp3 complexes and explored their composition. Biochemical and mass-spectrometric analyses revealed that Foxp3 forms multiprotein complexes of 400-800 kDa or larger and identified 361 associated proteins, ∼30% of which were transcription related. Foxp3 directly regulated expression of a large proportion of the genes encoding its cofactors. Some transcription factor partners of Foxp3 facilitated its expression. Functional analysis of the cooperation of Foxp3 with one such partner, GATA-3, provided additional evidence for a network of transcriptional regulation afforded by Foxp3 and its associates to control distinct aspects of T(reg) cell biology.


Figures

Figure 1
Figure 1
Strategy for purification of Foxp3-associated proteins. (a) Immunoblot analysis of biotinylated AVI-Foxp3 in nuclear lysates prepared from TCli cells expressing AVI-Foxp3 and BirA. AVI-tag and BirA expressing cells were used as a control. * indicates endogenously biotinylated nuclear proteins. Data are representative of three independent experiments. (b) Immunoprecipitation of AVI-Foxp3 or AVI-ΔE250 Foxp3 mutant protein from nuclear lysates of TCli cells using streptavidin-conjugated magnetic beads. The presence of Foxp3 and its known partner Foxp1 was determined by immunoblot analysis. Data are representative of two independent experiments. (c) Immunoblot analysis of nuclear extracts prepared from activated CD4+CD25 T cells that were transduced with the indicated retroviral vectors. Data are representative of two independent experiments. (d) In vitro suppressor activity of the transduced T cells (Ttd) described in (c). Transduced T cells were co-cultured with CD4+Foxp3 (GFP) responder T cells (Teff) from Foxp3GFP mice at indicated ratios for 72 h in the presence of anti-CD3 and irradiated (2000 rads) T cell-depleted splenocytes. The data are shown as mean [3H]-thymidine incorporation in triplicate cultures and are representative of two independent experiments. (e) Fractionation of affinity purified Foxp3 protein complexes in SDS PAGE followed by Coomassie staining. Data are representative of three independent experiments.
Figure 2
Figure 2
Foxp3 forms large protein complexes with its partners. (a) Total nuclear lysates (TNL) prepared from TCli-AVI-Foxp3 cells (top) and magnetic bead purified Treg cells (bottom) were subjected to fractionation on a Superose 6 FPLC column and distribution of Foxp3 complexes in the resulting fractions was assessed by western blot analysis after ethanol precipitation. Fraction numbers and molecular weights of complexes (in kD) are indicated. Data are representative of two independent experiments. (b) Immunoblot analysis of biotinylated AVITEV-Foxp3 protein released from streptavidin-conjugated magnetic beads upon cleavage with TEV protease. AVI-Foxp3 protein lacking a TEV cleavage site was used as a control. Foxp3 proteins were visualized using anti-Foxp3. Data are representative of at least three independent experiments. (c) Immunoblot analysis of the TEV eluted Foxp3 complexes to confirm the presence of Foxp3 co-factors identified by mass-spectrometric analyses. Data are representative of two to three independent experiments. (d) Fractionation of TEV-cleaved Foxp3 complexes in a Superose 6 FPLC column. The intensities of the bands in different fractions were determined by the “Image J” software and shown in the lower panel. Data are representative of three independent experiments.
Figure 3
Figure 3
Functional annotation of Foxp3 associated proteins. (a) Analysis of GO term enrichment of the “biological process” category of Foxp3-associated proteins. Top 12 GO terms ranked according to the number of counts are plotted; full list of GO terms is shown in Supplementary Table 2b.
Figure 4
Figure 4
A large proportion of its associated factors are also transcriptional targets of Foxp3. (a) Analysis of genome-wide Foxp3 ChIP-seq data demonstrates that genes encoding Foxp3–transcription-related interaction partners are enriched as targets of Foxp3. The left panel shows percentage of genes bound by Foxp3 (Y-axis) sorted by Foxp3 peak read count in a 200 bp window (X-axis). The right panel shows the statistical enrichment in the top 4000 Foxp3 peaks, which correspond to 2705 out of 21289 refseq annotated genes and 41 out of 94 Foxp3 transcription-related cofactors. *P < 10−8 (Fisher’s exact test). (b) ChIP-qPCR analysis to demonstrate the occupancy of Foxp3 on the regulatory regions of genes encoding several of its interacting partners. Pde3b and Gmpr serve as positive and negative controls of Foxp3 occupied genes, respectively. Data represent two independent experiments. (c) Cumulative distribution analysis of the difference in expression of genes encoding Foxp3-associated factors between indicated cell types. *P < 0.0015 and **P < 0.00002 (One-tailed Kolmogorov-Smirnov test). (d) Real-time PCR analysis of mRNA encoded by genes of selected Foxp3 partners from indicated cell types isolated from heterozygous Foxp3GFPKO/WT female mice. B2m is an unrelated negative control gene and Cnot3 is a partner, but its encoding gene is not a significant target of Foxp3 according to ChIP-seq analysis. Data represents six to nine replicates from two to three independent experiments. *P < 0.05, **P < 0.005 and ***P < 0.0001 (Student’s t-test).
Figure 5
Figure 5
Foxp3-Gata3 gene regulatory module in Treg cells. (a) Purified CD4+CD25+ (Treg) and CD4+CD25 (Tnv) T cells were stimulated by plate-bound CD3 and CD28 antibodies for 24 h in the presence of IL-2 followed by flow cytometric analysis of intracellular Foxp3 and GATA-3 expression. (b) Co-immunoprecipitation of GATA-3 and Foxp3 from nuclear extracts of activated Treg cells (described in (a)) followed by immunoblot analysis of the indicated proteins. A representative of two independent experiments is shown. (IgG: immunoprecipitation with IgG, α-GATA-3: immunoprecipitation with anti-GATA-3). (c) Immunoprecipitation of Foxp3-bound chromatin isolated from purified CD4+CD25+ Treg cells and control CD4+CD25 T cells using rabbit anti-Foxp3. Foxp3 occupancy of the Gata3 locus was determined by qPCR. Foxp3 binding to Pde3b, Prdm1 and Helios served as positive and to Gmpr as negative controls, respectively. A representative of two independent experiments is shown. (d) GATA-3 expression in CD4+Foxp3+Treg cells (blue line) and CD4+Foxp3 naïve T cells (red line) in mice harboring GATA-3 -sufficient (left) and -deficient (right) Treg cells. (e) GATA-3 expression in Treg (blue line) and TFN (red line) cells from heterozygous female Foxp3GFPKO/WT mice compared to Treg cells lacking GATA-3 (black line). Absolute mean fluorescent intensity (MFI) values are indicated in red and blue in the histogram plots or relative expression (MFI of GATA-3 relative to GATA-3-deficient Treg cells) is shown in the bar graphs. Data are representative of three independent experiments. *P < 0.05 (Student’s t-test).
Figure 6
Figure 6
A subset of genes regulated by Foxp3 and Gata3 in Treg cells. (a) Cumulative distribution analysis of the differential gene expression in Gata3-sufficient and -deficient Treg cells for Foxp3- and Gata3-bound and Foxp3 only bound genes. *P < 0.00026 and **P < 5.4×10⁶ (One-tailed Kolmogorov-Smirnov test). (b) ChIP-qPCR analysis demonstrating overlapping occupancy of Foxp3 and Gata3 on some of the target genes identified by genome wide ChIP-sequencing. Data represents two to three independent experiments. (c) Real-time PCR analysis of mRNA encoded by representative genes co-occupied by Foxp3 or Foxp3 and Gata3 in Treg cells purified by flow cytometry from Gata3fl/+ Foxp3YFP-Cre (WT) or Gata3fl/flFoxp3YFP-Cre (KO) mice. Relative expression is calculated by dividing the Hprt normalized expression values for each mRNA in KO over those in WT Treg cells. Data are shown as averages of three independent experiments. *P < 0.05 (Student’s t-test). (d) Real-time PCR analysis of mRNA encoded by representative genes from indicated cells sorted from heterozygous female Foxp3GFPKO/WT mice. Data represents six to nine replicates from two to three independent experiments.*P < 0.05, **P < 0.005 and ***P < 0.005 (Student’s t-test).

Comment in

References

    1. Josefowicz SZ, Lu LF, Rudensky AY. Regulatory T Cells: Mechanisms of Differentiation and Function. Annu Rev Immunol. 2012;30:531–564. - PMC - PubMed
    1. Sakaguchi S, Yamaguchi T, Nomura T, Ono M. Regulatory T cells and immune tolerance. Cell. 2008;133:775–787. - PubMed
    1. Godfrey VL, Wilkinson JE, Russell LB. X-linked lymphoreticular disease in the scurfy (sf) mutant mouse. Am J Pathol. 1991;138:1379–1387. - PMC - PubMed
    1. Bennett CL, et al. The immune dysregulation, polyendocrinopathy, enteropathy, X-linked syndrome (IPEX) is caused by mutations of FOXP3. Nat Genet. 2001;27:20–21. - PubMed
    1. Wildin RS, Freitas A. IPEX and FOXP3: clinical and research perspectives. J Autoimmun. 2005;25(Suppl):56–62. - PubMed

Publication types

Substances

Associated data