. 2012 Oct;13(10):947-53.
doi: 10.1038/ni.2403. Epub 2012 Aug 26.

Lymphotoxin regulates commensal responses to enable diet-induced obesity

Affiliations

Lymphotoxin regulates commensal responses to enable diet-induced obesity

Vaibhav Upadhyay et al. Nat Immunol. 2012 Oct.

Abstract

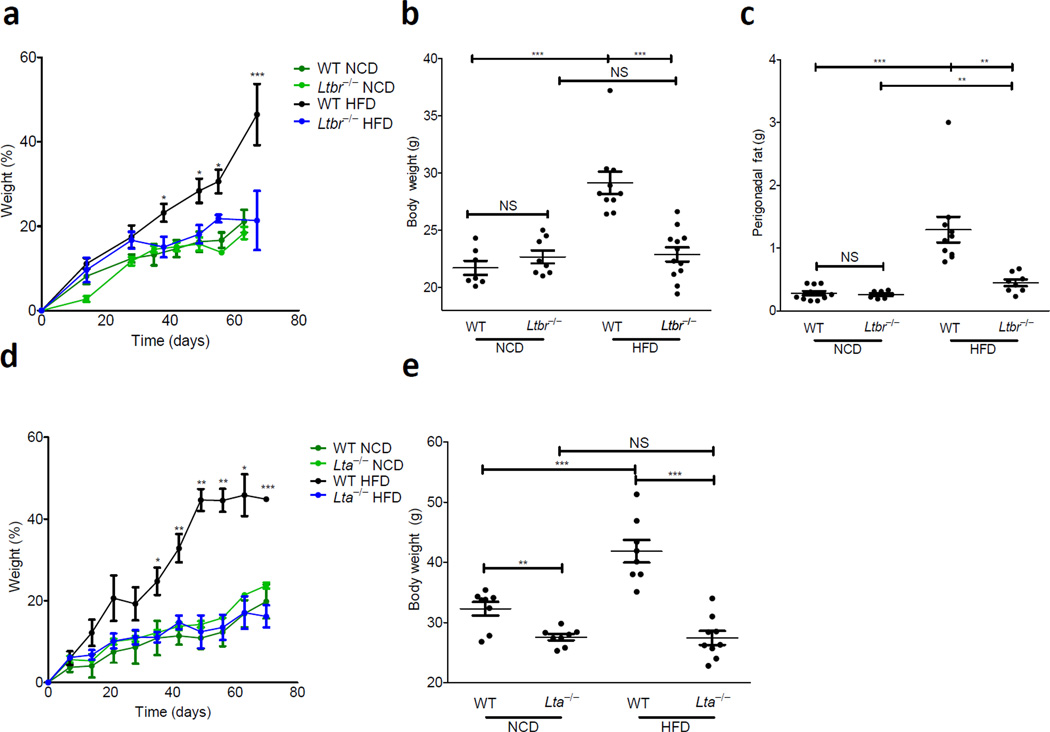
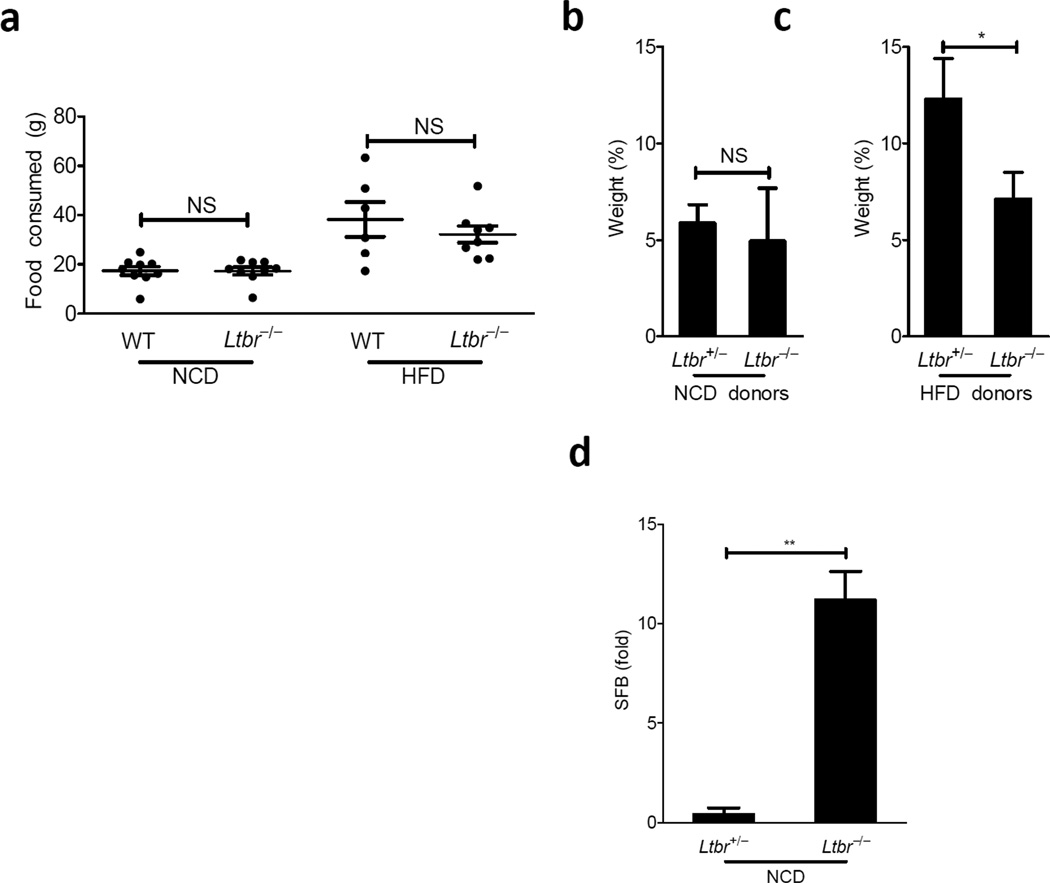
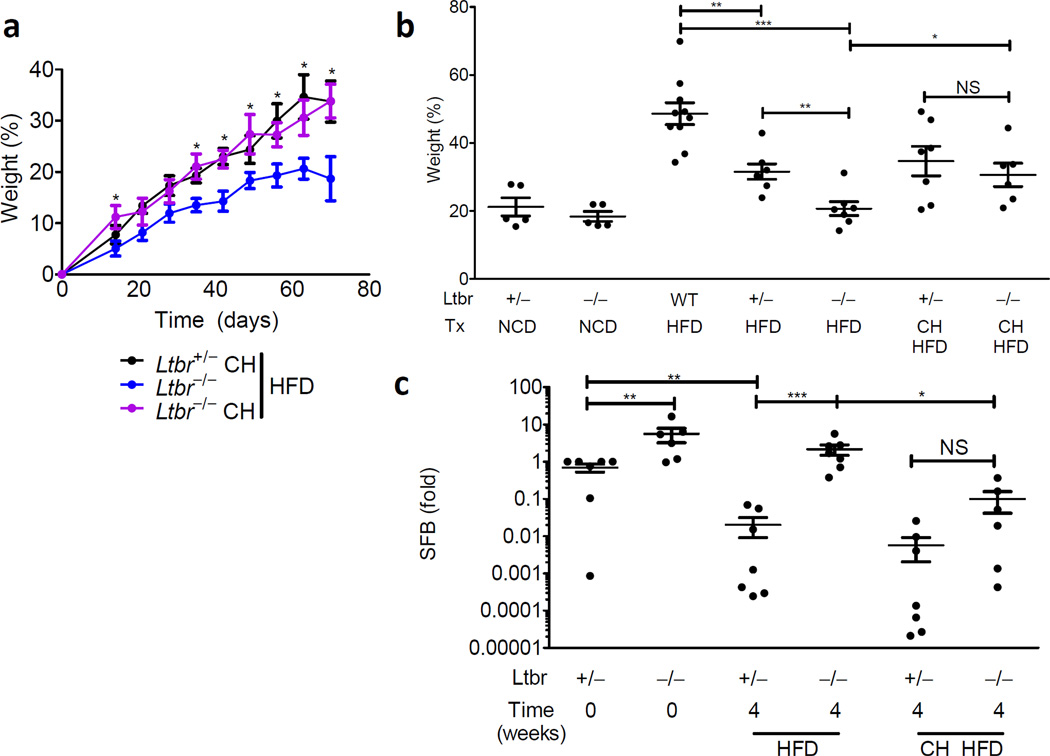
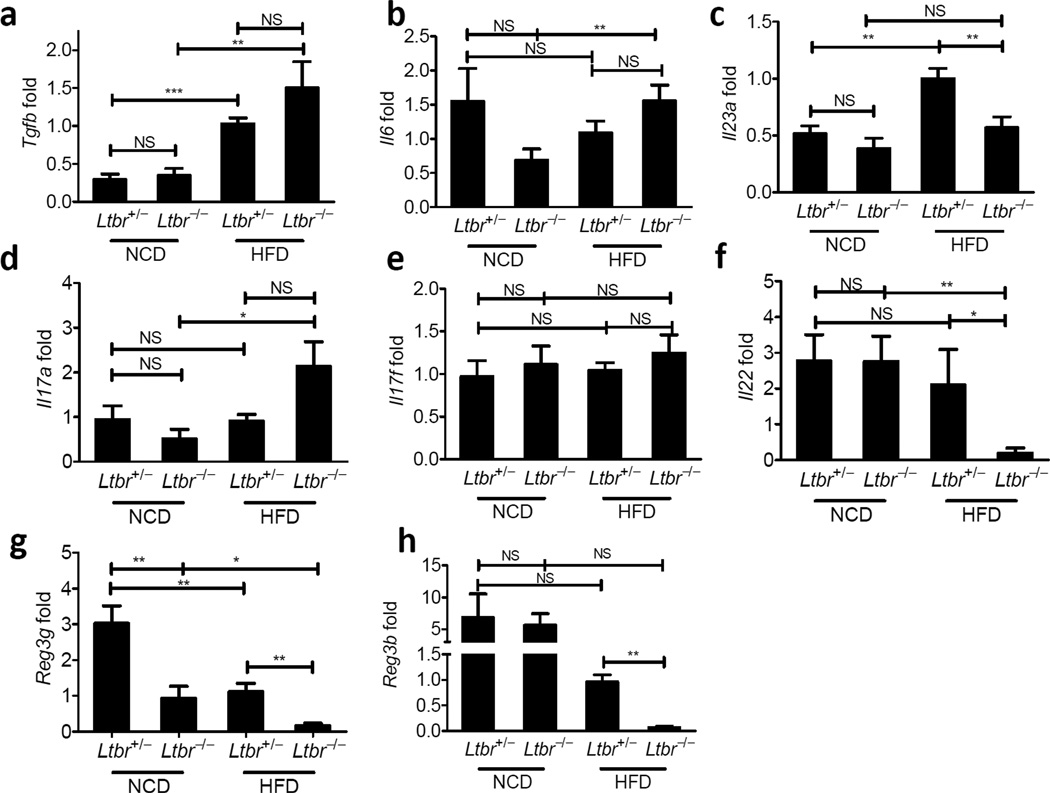
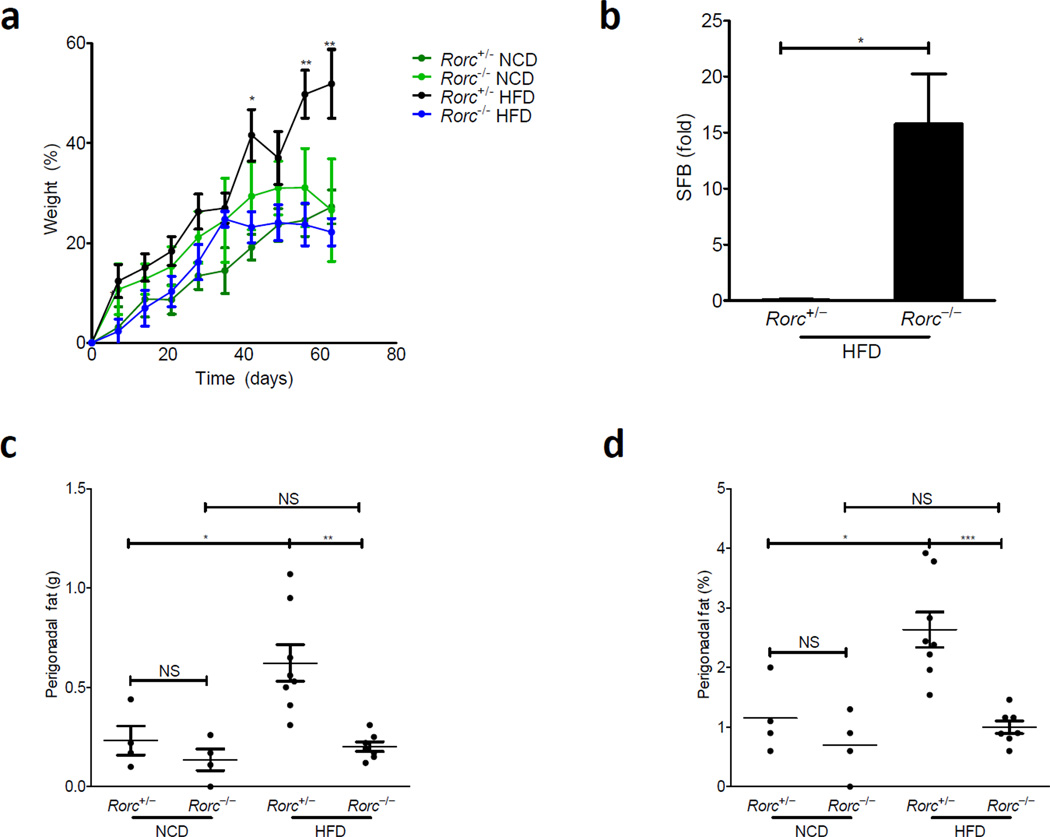
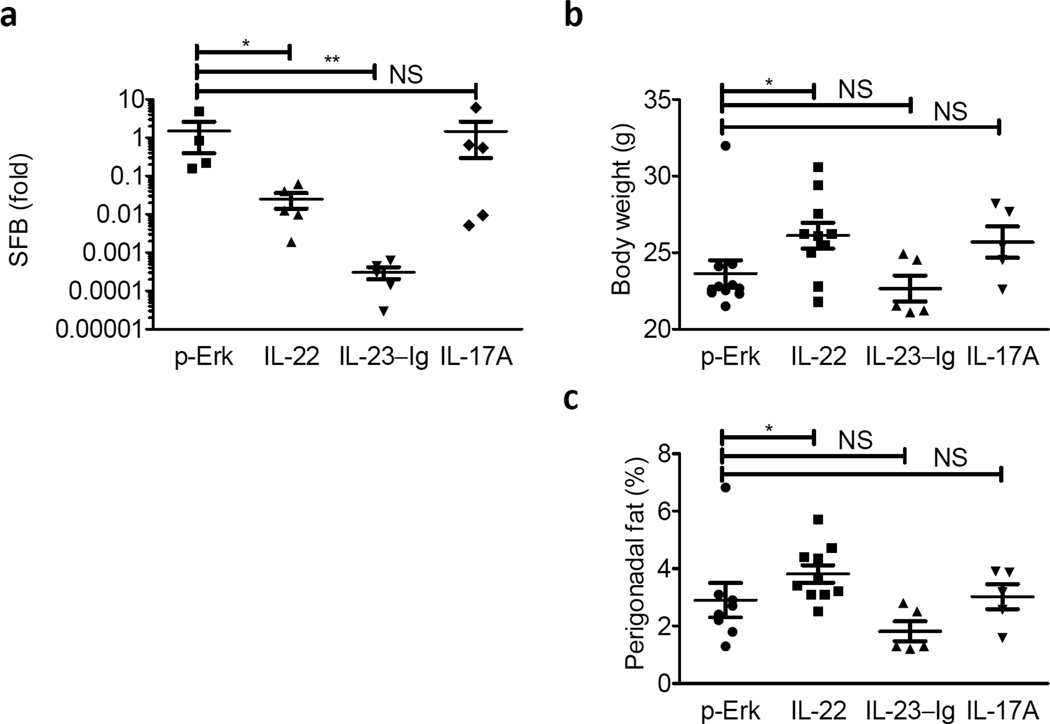
Microbiota are essential for weight gain in mouse models of diet-induced obesity (DIO), but the pathways that cause the microbiota to induce weight gain are unknown. We report that mice deficient in lymphotoxin, a key molecule in gut immunity, were resistant to DIO. Ltbr(-/-) mice had different microbial community composition compared to their heterozygous littermates, including an overgrowth of segmented filamentous bacteria (SFB). Furthermore, cecal transplantation conferred leanness to germ-free recipients. Housing Ltbr(-/-) mice with their obese siblings rescued weight gain in Ltbr(-/-) mice, demonstrating the communicability of the obese phenotype. Ltbr(-/-) mice lacked interleukin 23 (IL-23) and IL-22, which can regulate SFB. Mice deficient in these pathways also resisted DIO, demonstrating that intact mucosal immunity guides diet-induced changes to the microbiota to enable obesity.


Figures

Figure 1
Figure 1. LTβR is essential for weight gain in response to HFD
(a–e) 9 week old WT (C57BL6), Ltbr−/−, or Lta−/− animals were subject to a HFD or NCD for 9 weeks. (a) Weight gain as a percentage over starting weight is plotted (b) Absolute weight in grams at the end of diet. (c) Perigonadal fat was removed and weighed at the end of diet; weight of fat is plotted. (d) Weight gain as a percentage of starting weight is plotted against days on diet. (e) Weight at the end of diet for mice in E. (Data is reflective of 2–3 independent experiments per genotype, with n=5–12 mice in all groups; statistics demonstrate differences between HFD groups; Student’s t-test for individual points along growth curves; 1-Way Anova with Bonferonni post-test for dot plots: *P <0.05, ** P <0.01, *** P <0.001)
Figure 2
Figure 2. LTβR influences weight gain through changes in the microbiota
(a) Food consumed represents the weight difference of food between n and n+1 days of a given cage of mice over the course of the first two weeks on diet (b–c) Germ free mice were gavaged with cecal contents from Ltbr+/− or Ltbr−/− littermates maintained on NCD or HFD for 9–10 weeks starting at 9 weeks of age. Cecal contents from two donors was pooled. Recipients were kept on diets of similar compositions to donors. (b–c) Weight gain as a percentage of starting body weight is shown 20 days after gavage of germ free recipients from the NCD (b) and HFD (c) groups. (D) RT-PCR for SFB on DNA from stool collected from Ltbr+/− and Ltbr−/− mice 4 weeks after NCD start (n=4 mice per group, representative of 3 independent experiments for a and d; n=3–5 germ free mice/group, representative of 2 independent experiments Summary of p-values: * P <0.05, ** P <0.001, student’s t test for a and d, paired-t test for b and c)
Figure 3
Figure 3. Environmental exposure reveals horizontal transmissibility of the obese phenotype
(a–c) Ltbr+/− or Ltbr−/− were genotyped and weaned either separately or together (CH) at 3 weeks of age. (a) Weight gain as a percentage over starting weight is plotted for adult animals started on HFD at 9 weeks of age. (b) Weight gain as apercentage over starting weight after 9 weeks of diet; Tx indicates combination of diet and housing conditions. (c) RT-PCR for SFB in stool relative to Ltbr+/− littermates stool at diet start. (n=5–12 mice per group; growth curve is reflective of 3 independent experiments and statistics demonstrate differences between Ltbr−/− groups; Student’s t-test for individual points along growth curves and dot-plots: * P <0.05, ** P <0.01, *** P <0.001)
Figure 4
Figure 4. LTβR agonizes the innate IL23/IL22 axis
Ltbr+/− and Ltbr−/− animals were fed HFD for 10 weeks starting at 9 weeks of age. After challenge, PCR for targets was performed on cDNA from whole colon. Data is plotted relative to Ltbr+/− animals on NCD and normalized to HPRT. (a) Tgfb (b) Il6 (c) Il23a (d) Il17a (e) Il17f (f) Il22 (g) Reg3g (h) Reg3b: (n=3–9 mice per group, representative of 2 independent experiments, * P <0.05, ** P <0.01, student’s t test)
Figure 5
Figure 5. HFD induces LTβR-dependent IL23 which is essential for DIO
(a) WT (C57BL/6), Ltbr+/−, and Ltbr−/− animals were fed HFD for 10 weeks. At the end of diet, animals were sacrificed and colons were removed and cultured overnight. Supernatants were subjected to ELISA for IL23p19p40 and resulting data was normalized per milligram of colon cultured. (b–d) WT (C57BL/6) mice or Il23a−/− animals were challenged with HFD starting at 9 weeks of age or 9 weeks. (b) Weight as a percentage over starting weight is plotted. (c) Perigonadal fat was removed and weighed at the end of diet; weight of fat is plotted. (d) Fat from (c) is plotted as a percentage of body weight. Weight gain as a percentage of starting weight is plotted. (n=5–9 mice per group; growth curve is reflective of 2 independent experiments and statistics demonstrate differences between HFD groups; Student’s t-test for individual points along growth curves; 1-Way Anova with Bonferonni post-test for dot plots: * P <0.05, **P <0.01)
Figure 6
Figure 6. The transcription factor, RORγt, is required for weight gain and SFB homeostasis in DIO
Rorc+/− or Rorc−/− littermates were challenged with HFD for 9 weeks starting at 5 weeks of age. (a) Weight as a percentage over starting weight is plotted. (b) RT-PCR for SFB in stool relative to Rorc+/− littermates after 4 weeks of HFD normalized to levels at diet start (n=4 mice in each group). (c) Perigonadal fat was removed and weighed at the end of diet; weight of fat is plotted. (d) Fat from (c) is plotted as a percentage of body weight. Weight gain as a percentage of starting weight is plotted (n=7–8 mice per group; growth curve is reflective of 3 independent experiments and statistics demonstrate differences between HFD groups; Student’s t-test for individual points along growth curves and SFB levels; 1-Way Anova with Bonferonni post-test for dot plots: * P <0.05, ** P <0.01, *** P <0.001)
Figure 7
Figure 7. IL22 Restores SFB homeostasis and perigonadal fat pad expansion in LTβR−/− mice
LTβR−/− females were treated with 10 µg of plasmid encoding empty vector (p-Erk), IL-22, IL-23-Ig, or IL-17A at the start of diet. (a) RT-PCR for SFB normalized to Day 0 of diet are plotted. (b–c) (B) total body weight and (c) perigonadal fat pads were weighed and are plotted as a percentage of final weight. (n=5–10 mice per group; Student’s t-test for log-transformed data for SFB; Two-tailed Mann-Whitney test for body weight and perigonadal fat due to outlier in p-ERK group; * P <0.05, ** P <0.01)

Comment in

References

    1. Wang Y, Beydoun MA, Liang L, Caballero B, Kumanyika SK. Will All Americans Become Overweight or Obese? Estimating the Progression and Cost of the US Obesity Epidemic. Obesity. 2008;16:2323–2330. - PubMed
    1. Centers for Disease Control and Prevention. 2010 < http://www.cdc.gov/obesity/data/trends.html#State>.
    1. Flegal KM, Carroll MD, Ogden CL, Curtin LR. Prevalence and Trends in Obesity Among US Adults, 1999–2008. JAMA. 2010;303:235–241. - PubMed
    1. Stunkard AJ, Foch TT, Hrubec Z. A Twin Study of Human Obesity. JAMA. 1986;256:51–54. - PubMed
    1. Stunkard AJ, et al. An Adoption Study of Human Obesity. NEJM. 1986;314:193–198. - PubMed

Publication types

MeSH terms