. 2012 Oct;13(10):954-62.
doi: 10.1038/ni.2397. Epub 2012 Aug 26.

Type I interferon induces necroptosis in macrophages during infection with Salmonella enterica serovar Typhimurium

Affiliations

Type I interferon induces necroptosis in macrophages during infection with Salmonella enterica serovar Typhimurium

Nirmal Robinson et al. Nat Immunol. 2012 Oct.

Abstract

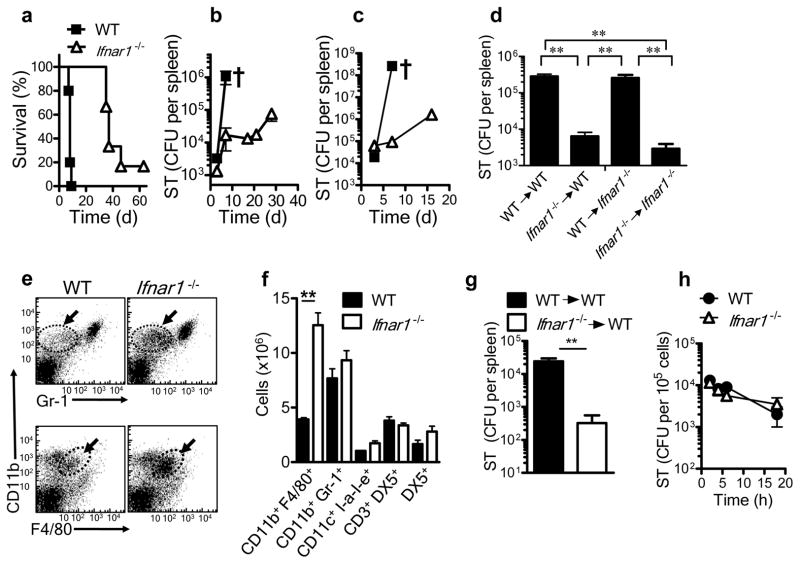
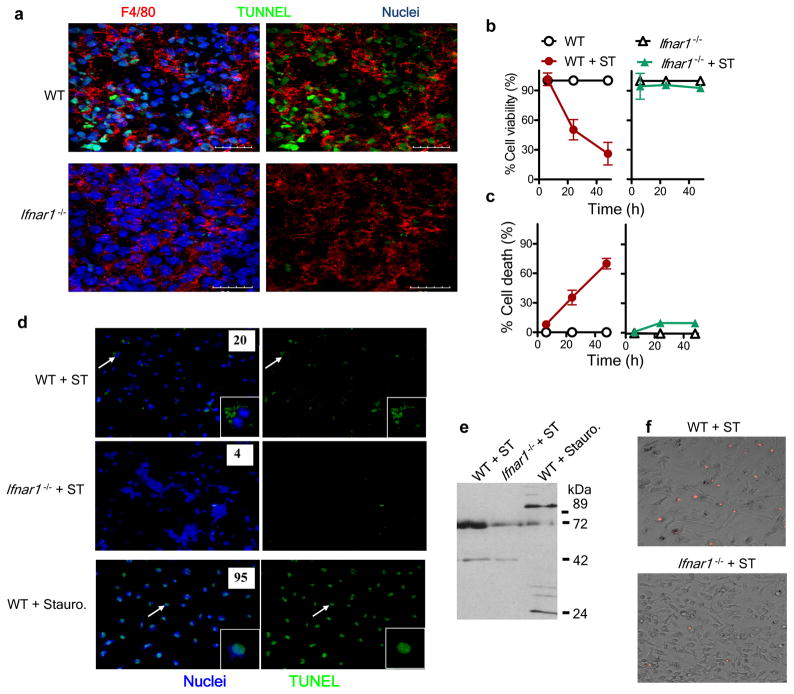
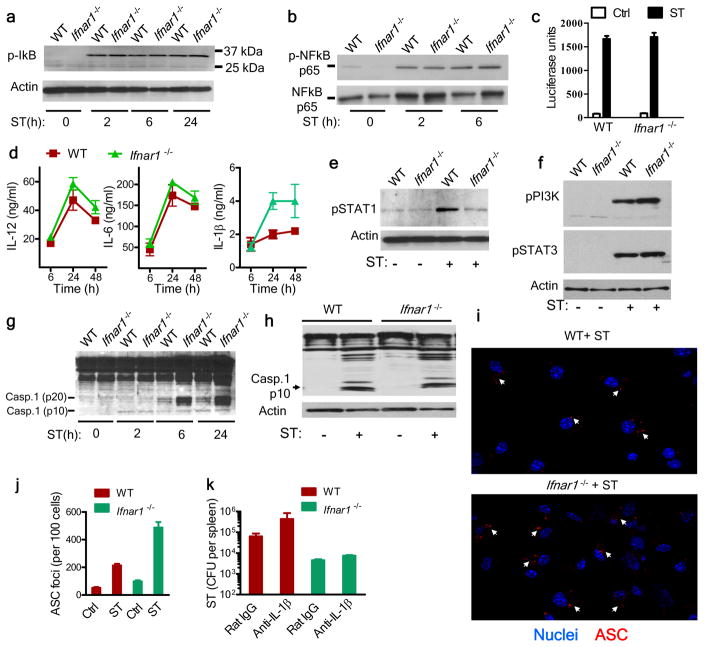
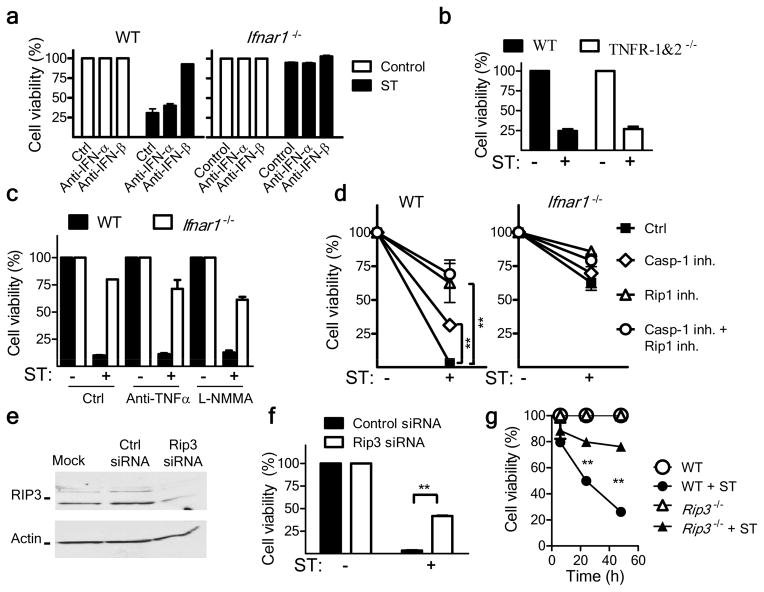
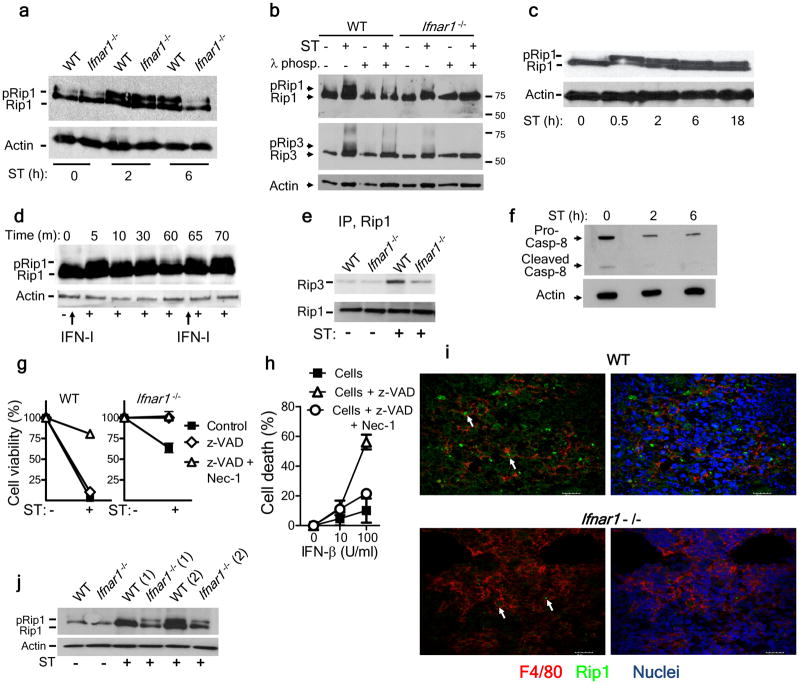
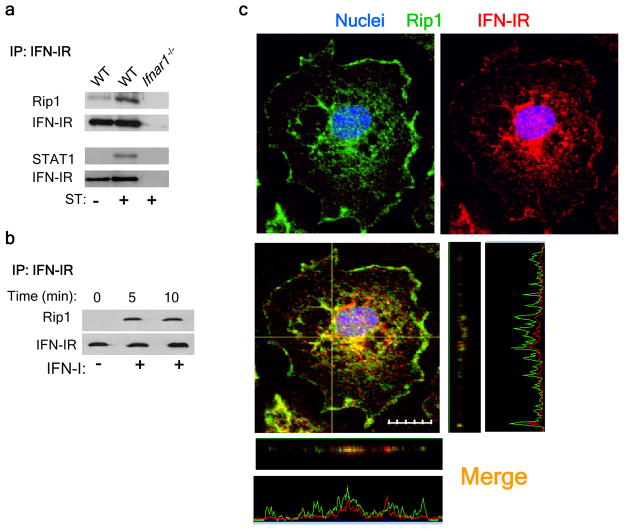
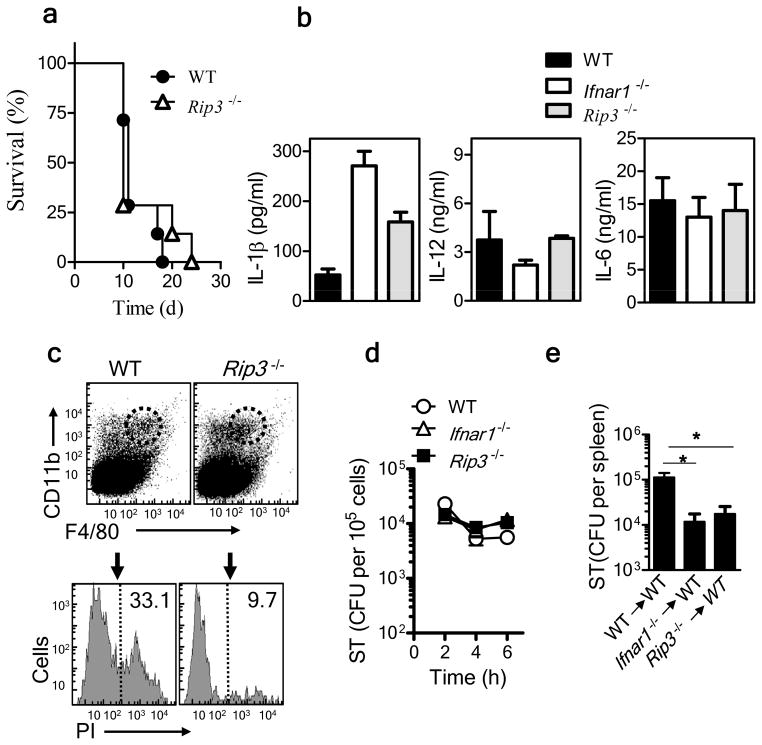
Salmonella enterica serovar Typhimurium (S. Typhimurium) is a virulent pathogen that induces rapid host death. Here we observed that host survival after infection with S. Typhimurium was enhanced in the absence of type I interferon signaling, with improved survival of mice deficient in the receptor for type I interferons (Ifnar1(-/-) mice) that was attributed to macrophages. Although there was no impairment in cytokine expression or inflammasome activation in Ifnar1(-/-) macrophages, they were highly resistant to S. Typhimurium-induced cell death. Specific inhibition of the kinase RIP1 or knockdown of the gene encoding the kinase RIP3 prevented the death of wild-type macrophages, which indicated that necroptosis was a mechanism of cell death. Finally, RIP3-deficient macrophages, which cannot undergo necroptosis, had similarly less death and enhanced control of S. Typhimurium in vivo. Thus, we propose that S. Typhimurium induces the production of type I interferon, which drives necroptosis of macrophages and allows them to evade the immune response.


Conflict of interest statement

COMPETING FINANCIAL INTERESTS

The authors declare no competing financial interests.

Figures

Figure 1
Figure 1
Prolonged survival of Ifnar1−/− mice to S. Typhimurium infection. (ac) Survival (a) and bacterial burden in the spleen (b,c) of wild-type (WT) and Ifnar1−/− mice infected intravenously with 1 × 10² S. Typhimurium (ST; a,b) or intraperitoneally with 1 × 10³ S. Typhimurium (c). † indicates death. CFU, colony-forming units. (d) Bacterial burden in the spleens of lethally irradiated wild-type or Ifnar1−/− recipient mice given bone marrow cells (1 × 10⁷) from wild-type or Ifnar1−/− donors, then challenged 3 months later by intravenous infection with 1 × 10² S. Typhimurium and assessed at day 5 after infection. (e,f) Flow cytometry of cells in the spleens of wild-type and Ifnar1−/− mice 5 d after intravenous infection with 1 × 10² S. Typhimurium. Arrows and outlined areas in e indicate CD11b+Gr-1 cells (top row) or CD11b+F4/80+ cells (bottom row). (g) Bacterial burden in the spleens of naive wild-type mice given intravenous injection of bone marrow–derived macrophages from wild-type or Ifnar1−/− mice (5 × 10⁶ cells), then challenged the next day by intraperitoneal infection with 1 × 10² S. Typhimurium and assessed 5 d after infection. (h) Intracellular survival of S. Typhimurium in bone marrow–derived macrophages after infection for 30 min in vitro (multiplicity of infection (MOI), 10). **P < 0.01 (one way ANOVA). Data are representative of two experiments with similar results, with three to five mice per group (mean and s.e.m. d,fh).
Figure 2
Figure 2
Ifnar1−/− macrophages are resistant to S. Typhimurium–induced cell death. (a) Confocal microscopy of frozen sections of spleens obtained from wild-type and Ifnar1−/− mice 5 d after intravenous infection with 1 × 10² S. Typhimurium and stained for F4/80 and by TUNEL. Scale bars, 20 μm. (b,c) Viability, assessed by uptake of neutral red (b), and death, assessed by lactate dehydrogenase–release assay (c), of wild-type and Ifnar1−/− bone marrow–derived macrophages plated in 96-well plates at a density of 1 × 10⁵ cells per well and infected with S. Typhimurium (MOI, 10), then treated with gentamicin at 30 min after infection and assessed at 6, 24 and 48 h after infection. (d) Fluorescence microscopy of bone marrow–derived macrophages infected for 24 h with S. Typhimurium (+ ST) or treated for 3 h with staurosporine (+ stauro), then stained by TUNEL (green) and Hoechst nuclear dye (blue). Inset, enlargement of areas indicated by arrows. Original magnification, ×20 (main images) or ×60 (insets). Numbers in images indicate percent TUNEL+ cells (n ≥ 100 cells). (e) Immunoblot analysis of macrophages infected for 24h with S. Typhimurium or treated for 3 h with staurosporine, probed with antibody to cleaved PARP-1. (f) Fluorescence microscopy of bone marrow–derived macrophages infected for 24h with S. Typhimurium and stained with propidium iodide. Original magnification, ×20. Data are representative of three experiments with similar results (mean and s.e.m (b,c)).
Figure 3
Figure 3
Cytokine secretion and inflammasome activation are not impaired in Ifnar1−/− macrophages. (a,b) Immunoblot analysis of phosphorylated (p-) IκB (a) and total and phosphorylated NF-κB subunit p65 (b) in wild-type and Ifnar1−/− macrophages infected for various times (below lanes) with S. Typhimurium (MOI, 10). Actin serves as a loading control throughout. (c) Bioassay of type I interferon in supernatants of uninfected macrophages (control (Ctrl)) or macrophages infected for 24 h with S. Typhimurium (ST), assessed with the luciferase-expressing mouse fibroblast line L929-ISRE. (d) ELISA of IL-12, IL-6 and IL-1β in supernatants ofmacrophages infected for various times (horizontal axis) with S. Typhimurium. (e,f) Immunoblot analysis of STAT1 phosphorylated at Ser727 (e) and phosphatidylinositol-3-OH kinase (PI(3)K) phosphorylated at Tyr199 and STAT3 phosphorylated Tyr705 (f) in lysates of uninfected macrophages (ST −) or in macrophages 6 h after infection with S. Typhimurium (ST +). (g) Immunoblot analysis of the processing of caspase-1 (Casp1), probed with antibody to the caspase-1 p10 fragment. (h) Immunoblot analysis of caspase-1 in F4/80+ macrophages purified from the spleens of naive mice (ST −) and mice infected for 5 d with S. Typhimurium (ST +). (i) Confocal microscopy of macrophages grown on glass coverslips in 24 well-plates and infected for 30 min with S. Typhimurium (MOI, 10), then the extracellular bacteria were removed and cells cultured for 24h followed by fixation and staining with anti-ASC (red) and Hoechst nuclear stain (blue). Arrows indicate ASC foci. Original magnification, ×20. (j) Quantification of ASC foci in uninfected cells (Ctrl) (not shown) and in cells infected with ST as in i. (k) Bacterial burden in the spleens of mice infected intravenously with 1 × 10² S. Typhimurium, then given daily injection of rat immunoglobulin G (IgG) or neutralizing anti-IL-1β (100 μg per injection) for 4 d. Data are from one experiment with four mice per group (error bars (c,d,j,k), s.e.m.).
Figure 4
Figure 4
Type I interferon induces necroptosis in S. Typhimurium–infected macrophages. (a) Viability of wild-type and Ifnar1−/− bone marrow–derived macrophages incubated with no antibody (No Ab) or neutralizing anti-IFN-α or anti-IFN-β (10 μg/ml) and left uninfected (ST −) or infected for 48 h with S. Typhimurium (ST +), assessed by neutral red assay. (b) Viability of bone marrow–derived macrophages from wild-type mice (WT) and mice deficient in TNFR1 and TNFR2 (TNFR-KO), infected for 48 h with S. Typhimurium, assessed by neutral red assay. (c) Viability of macrophages left untreated (Ctrl) or incubated with anti-TNF (20 μg/ml) or L-NMMA (20 μg/ml) during S. Typhimurium infection for 48 h, assessed as in b. (d) Viability of macrophages cultured with no inhibitors (Ctrl) or with an inhibitor of caspase-1 (Casp1 inh; 50 μM) or RIP1 (RIP1 inh; 33 μM) or both inhibitors and left uninfected (ST −) or infected for 48 h with S. Typhimurium (ST +), presented relative to that of inhibitor-treated uninfected cells. (e) Immunoblot analysis of RIP3 in the commonly used mature macrophage cell line (J774A.1) mock transfected (Mock) or transfected for 24 h with control or RIP3-specific small interfering RNA (siRNA). (f) Viability of macrophages transfected as in e, then infected for 24 h with S. Typhimurium, assessed as in b. (g) Viability of wild-type and Rip3−/− macrophages infected and assessed as in b. **P < 0.01 (two-way ANOVA). All experiments involved analysis of triplicate samples from a single experiment, and data is representative of two to three similar experiments. (ag; error bars, s.e.m.).
Figure 5
Figure 5
Infection of macrophages with S. Typhimurium leads to type I interferon–dependent phosphorylation of RIP1 and RIP3. (a) Immunoblot analysis of total and phosphorylated RIP1 in lysates of uninfected macrophages (ST 0 h) or macrophages infected for 2 or 6 h (below lanes) with S. Typhimurium. (b) Immunoblot analysis of total and phosphorylated RIP1 and RIP3 lysates of uninfected macrophages (ST −) or macrophages infected for 24 h with S. Typhimurium (ST +), with (+) or without (−) treatment of lysates with λ-phosphatase (λ-phos). (c,d) Immunoblot analysis of total and phosphorylated RIP1 in lysates of IC-21 macrophages infected with S. Typhimurium (MOI, 10; c) or cultured with type I interferon as indicated by arrows pointing upwards (d). (e) Immunoblot analysis of lysates of S. Typhimurium–infected macrophages after immunoprecipitation (IP) with anti-RIP1, probed with anti-RIP3 or anti-RIP1. (f) Immunoblot analysis of lysates for the processing of caspase-8 in uninfected and S. Typhimurium–infected wild-type macrophages. (g) Viability of wild-type and Ifnar1−/− macrophages left untreated (Ctrl) or treated with the antiapoptotic compound z-VAD alone (z-VAD) or z-VAD and necrostatin (z-VAD + Nec-1) and left uninfected or infected with S. Typhimurium, assessed by neutral red assay. (h) Death of uninfected J774 macrophages treated as in g (key) in the presence of various concentrations of IFN-β (horizontal axis), assessed as in g. (i) Confocal microscopy of frozen sections of spleens from mice 5 d after intravenous infection with 1 × 10² S. Typhimurium, immunostained for F4/80 (red) and RIP1 (green) and with Hoechst nuclear dye (blue). Arrows indicate RIP1 expression in macrophages. Scale bars, 20 μm. (j) Immunoblot analysis of total and phosphorylated RIP1 in lysates of F4/80+ macrophages purified from the spleens of uninfected mice or mice 5 d after infection with S. Typhimurium. RIP1 expression was measured in macrophages purified from two mice (1 and 2).Data are representative of 2 (a,b,f,g,h,j,j) or 3 (c,d,e) experiments (error bars (g,h), s.e.m.).
Figure 6
Figure 6
Engagement of IFNAR leads to necroptosis. (a,b) Immunoassay of wild-type and Ifnar1−/− bone marrow–derived macrophages left uninfected or infected for 6 h with S. Typhimurium (a) or of IC-21 macrophages left untreated or treated with IFN-β (5,000 U/ml; b), immunoprecipitated with anti-IFNAR and analyzed by immunoblot with anti-RIP1 (a,b) and anti-STAT1 (a). (c) Confocal microscopy of wild-type bone marrow–derived macrophages grown on glass coverslips in 24 well-plates and infected for 30 min with S. Typhimurium (MOI, 10), then incubated for 24 h in gentamicin-containing media, fixed and stained with anti-IFNAR (red) and anti-RIP1 (green) and Hoechst (blue). The picture shows the 3 planes of the recorded z-stack image. The x and y planes are represented by the yellow lines drawn in the microscopic image. The z-plane corresponding to the x and y planes are represented in the horizontal and vertical image to the bottom and right of the microscopic image respectively. Original magnification, × 60.; scale bar, 10 μm. Data are representative of 3 (a,b) or 2 (c) experiments.
Figure 7
Figure 7
Inhibition of necroptosis in macrophages leads to less macrophage death and enhanced bacterial control. (a) Survival of wild-type and Rip3−/− mice after intravenous infection with 1 × 10² S. Typhimurium. (b) ELISA of IL-1β, IL-12 and IL-6 in supernatants of wild-type, Ifnar1−/− and Rip3−/− bone marrow–derived macrophages infected for 48 h in vitro with S. Typhimurium (MOI, 10). (c) Flow cytometry of spleen cells obtained from wild-type and Rip3−/− mice 3 d after intravenous infection with 1 × 10² S. Typhimurium and stained with anti-CD11b and anti-F4/80 (top), followed by staining of CD11b+F4/80+ macrophages (dashed outline, top) with propidium iodide (PI) for analysis of cell death (bottom). [Numbers at right of dashed vertical lines (bottom) indicate percent propidium iodide–positive dead cells. (d) Bacterial burden in wild-type, Ifnar1−/− and Rip3−/− macrophages at various times after in vitro infection with S. Typhimurium. (e) Bacterial burden in the spleens of naive wild-type mice given intravenous injection of wild-type, Ifnar1−/− or Rip3−/− bone marrow–derived macrophages (5 × 10⁶ cells per mouse), then challenged intraperitoneally with 1 × 10² S. Typhimurium and assessed 5 d after infection. *P < 0.05 (one way ANOVA).Data are representative of 2 experiments (a–e). Error bars (b,d,e);s.e.m.).

Similar articles

Cited by

References

    1. Jones BD, Falkow S. Salmonellosis: host immune responses and bacterial virulence determinants. Annu Rev Immunol. 1996;14:533–561. - PubMed
    1. Vidal S, et al. The Ity/Lsh/Bcg locus: natural resistance to infection with intracellular parasites is abrogated by disruption of the Nramp1 gene. J Exp Med. 1995;182:655–666. - PMC - PubMed
    1. Sad S, et al. Pathogen proliferation governs the magnitude but compromises the function of CD8 T cells. J Immunol. 2008;180:5853–5861. - PMC - PubMed
    1. Luu RA, et al. Delayed expansion and contraction of CD8+ T cell response during infection with virulent Salmonella typhimurium. J Immunol. 2006;177:1516–1525. - PMC - PubMed
    1. Albaghdadi H, Robinson N, Finlay B, Krishnan L, Sad S. Selectively reduced intracellular proliferation of Salmonella enterica serovar typhimurium within APCs limits antigen presentation and development of a rapid CD8 T cell response. J Immunol. 2009;183:3778–3787. - PMC - PubMed

Publication types

MeSH terms

Substances