. 2012 Nov 15;63(3):1162-70.
doi: 10.1016/j.neuroimage.2012.08.035. Epub 2012 Aug 18.

Decoding the perception of pain from fMRI using multivariate pattern analysis

Affiliations

Decoding the perception of pain from fMRI using multivariate pattern analysis

Kay H Brodersen et al. Neuroimage. .

Abstract

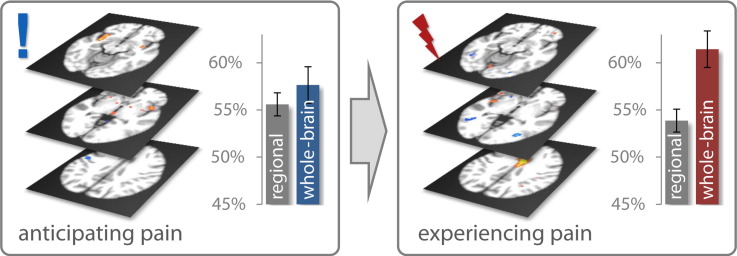
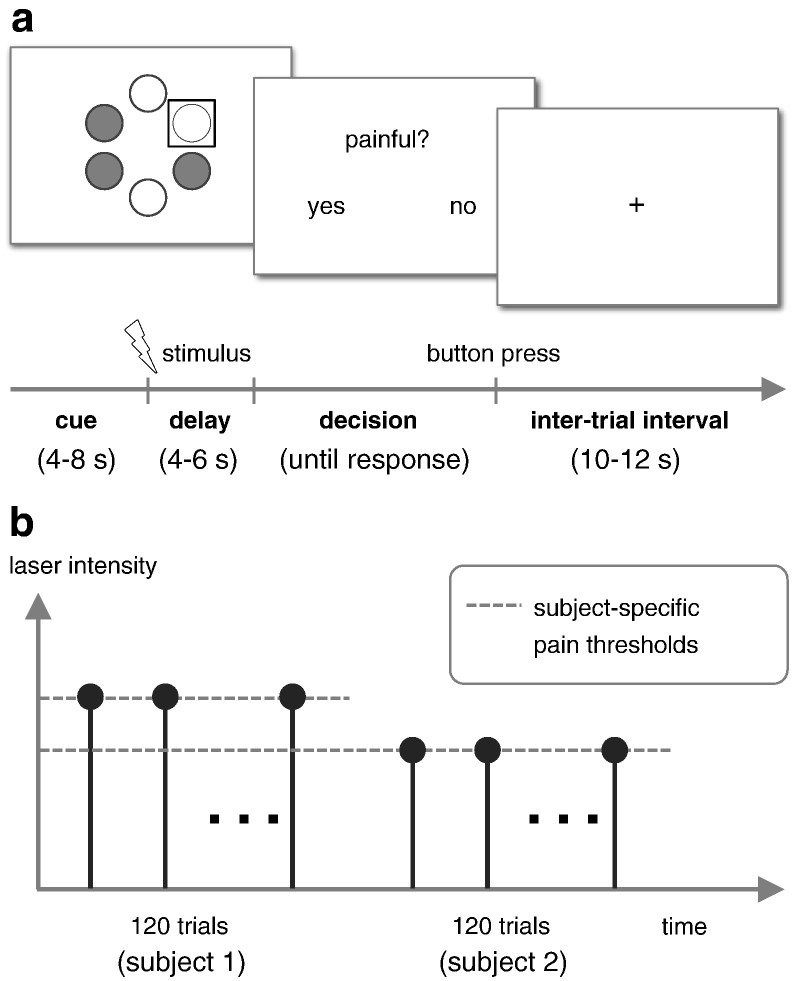
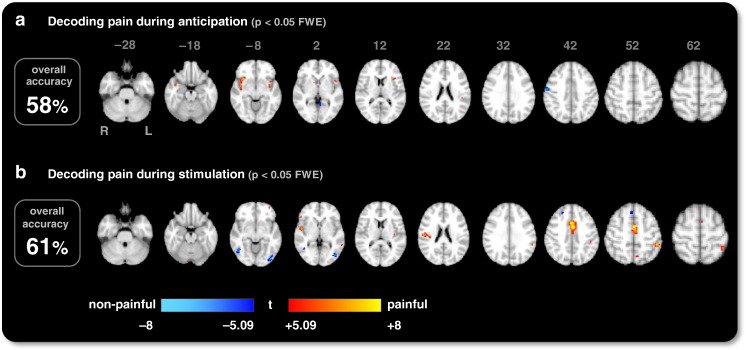
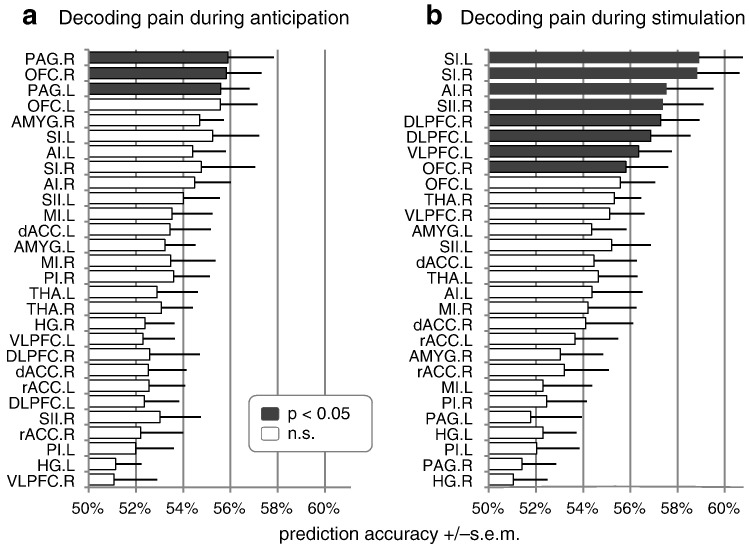
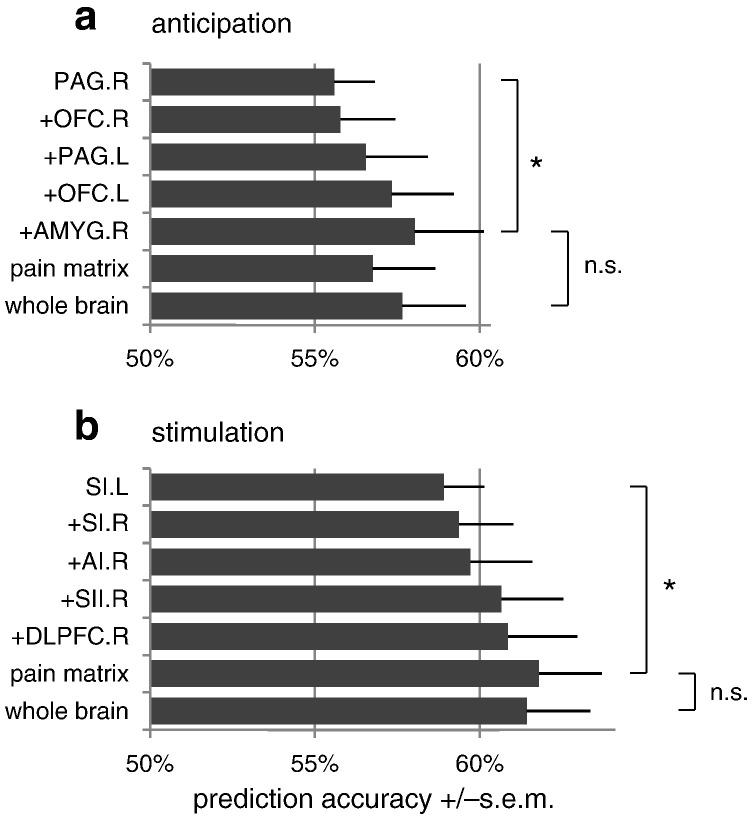
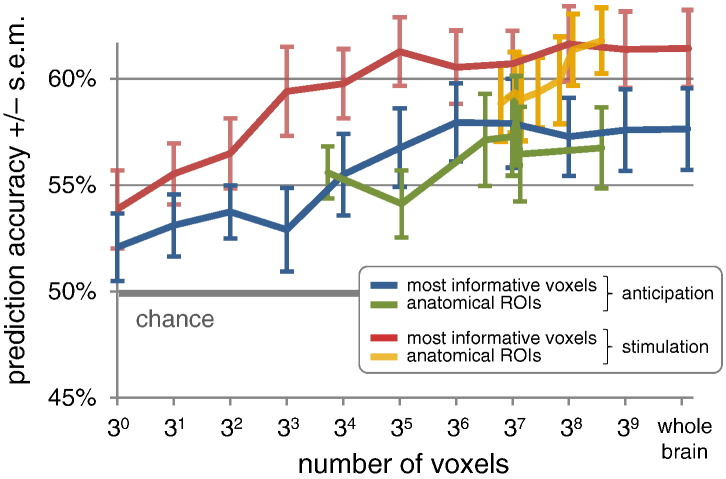
Pain is known to comprise sensory, cognitive, and affective aspects. Despite numerous previous fMRI studies, however, it remains open which spatial distribution of activity is sufficient to encode whether a stimulus is perceived as painful or not. In this study, we analyzed fMRI data from a perceptual decision-making task in which participants were exposed to near-threshold laser pulses. Using multivariate analyses on different spatial scales, we investigated the predictive capacity of fMRI data for decoding whether a stimulus had been perceived as painful. Our analysis yielded a rank order of brain regions: during pain anticipation, activity in the periaqueductal gray (PAG) and orbitofrontal cortex (OFC) afforded the most accurate trial-by-trial discrimination between painful and non-painful experiences; whereas during the actual stimulation, primary and secondary somatosensory cortex, anterior insula, dorsolateral and ventrolateral prefrontal cortex, and OFC were most discriminative. The most accurate prediction of pain perception from the stimulation period, however, was enabled by the combined activity in pain regions commonly referred to as the 'pain matrix'. Our results demonstrate that the neural representation of (near-threshold) pain is spatially distributed and can be best described at an intermediate spatial scale. In addition to its utility in establishing structure-function mappings, our approach affords trial-by-trial predictions and thus represents a step towards the goal of establishing an objective neuronal marker of pain perception.


Figures

None
Graphical abstract
Fig. 1
Fig. 1
Experimental design. Subjects were engaged in a simple perceptual decision-making task (Wiech et al., 2010). (a) At the beginning of each trial, a graphical representation of the 6 potential stimulation sites was shown before stimulus application. ‘Fully approved’ sites were shown in a different color than sites that were ‘approved with reservations.’ The site stimulated on the current trial was highlighted by a square. Following a brief laser stimulus, participants were prompted to indicate by a button press whether the stimulus had been perceived as painful (here: left button for ‘pain’, right button for ‘no pain’). Assignment of buttons was randomized across all 120 trials. (b) Within each subject, the laser intensity was calibrated to match the individual pain threshold.
Fig. 2
Fig. 2
Pain perception in individual voxels. This discriminative map shows the statistical significance of voxel weights obtained by training a linear support vector machine (16 subjects). Separate analyses were conducted based on brain activity (a) before and (b) during stimulus application. Regions highlighted in red represent voxels whose activity is higher on subjectively painful trials than on non-painful trials, whereas blue regions represent voxels whose activity is higher on non-painful trials than on painful trials (p < 0.05, FWE-corrected, see Methods section). Results are overlaid onto a standard structural scan in MNI152 space. The percentages on the left indicate the resulting classification accuracies when using a whole-brain feature space. Both are significantly above chance (p < 0.001; see main text).
Fig. 3
Fig. 3
Pain perception in individual regions of interest. The figure shows prediction accuracies obtained in 26 regions of interest for the differentiation between trials experienced as painful or non-painful (a) before and (b) during stimulation (plus two control regions, HG.L and HG.R). Results are given in terms of mean accuracy +/− standard error of the mean, based on 16 subjects. Statistical inference is based on a nonparametric permutation test with N = 2600 permutations and Bonferroni correction for multiple testing. Note that regions are sorted by the significance of prediction accuracies (p-values), not by their magnitude. AI/MI/PI = anterior/mid/posterior insula; AMYG = amygdala; dACC/rACC = dorsal/rostral anterior cingulate cortex; DLPFC/VLPFC = dorsolateral/ventrolateral prefrontal cortex; HG = Heschl's gyrus; OFC = orbitofrontal cortex; PAG = periaqueductal gray; SI/SII = primary/secondary somatosensory cortex; THA = thalamus; *.R = right; *.L = left.
Fig. 4
Fig. 4
Pain perception in combinations of highly predictive regions. The figure shows prediction accuracies for the classification of painful versus non-painful trials, using different sizes of search space, (a) before and (b) during stimulation, based on 16 subjects. Results are given in terms of mean accuracy +/− standard error of the mean. All accuracies are significantly above chance (p < 0.01; nonparametric permutation test; N = 1000). Additional significances are indicated between accuracies on different sets of regions (*p < 0.05; permutation test).
Fig. 5
Fig. 5
Pain perception across different scales. The two diagrams show the role of different spatial scales in relating brain activity to the perception of pain (a) before (blue) and (b) during (red) stimulus application, based on 16 subjects. Results are given in terms of mean accuracy +/− standard error of the mean. The gray horizontal bar indicates chance level (50%). All accuracies from 31 (3) voxels onwards are significantly above chance (p < 0.05; nonparametric permutation test; N = 1000). For direct comparison of different strategies for feature selection, we imported the results from Fig. 4. Specifically, for each ROI shown in Fig. 4, we determined the number of voxels in the underlying anatomical mask (averaged across subjects). We then plotted the ROI-based accuracies at the corresponding locations on the x-axis (green and yellow lines).

References

    1. Albanese M.-C., Duerden E.G., Rainville P., Duncan G.H. Memory traces of pain in human cortex. J. Neurosci. 2007;27(17):4612–4620. - PMC - PubMed
    1. Apkarian A.V., Bushnell M.C., Treede R.-D., Zubieta J.-K. Human brain mechanisms of pain perception and regulation in health and disease. Eur. J. Pain. 2005;9(4):463–484. - PubMed
    1. Brodersen K.H., Schofield T.M., Leff A.P., Ong C.S., Lomakina E.I., Buhmann J.M., Stephan K.E. Generative embedding for model-based classification of fMRI data. PLoS Comput. Biol. 2011;7(6):e1002079. - PMC - PubMed
    1. Brooks J.C.W., Zambreanu L., Godinez A., Craig A.D.B., Tracey I. Somatotopic organisation of the human insula to painful heat studied with high resolution functional imaging. Neuroimage. 2005;27(1):201–209. - PubMed
    1. Davatzikos C., Ruparel K., Fan Y., Shen D.G., Acharyya M., Loughead J.W., Gur R.C. Classifying spatial patterns of brain activity with machine learning methods: application to lie detection. Neuroimage. 2005;28(3):663–668. - PubMed

Publication types