. 2012 Sep;9(5):390-8.
doi: 10.1038/cmi.2012.28. Epub 2012 Aug 27.

SAHA, an HDAC inhibitor, synergizes with tacrolimus to prevent murine cardiac allograft rejection

Affiliations

SAHA, an HDAC inhibitor, synergizes with tacrolimus to prevent murine cardiac allograft rejection

Xin Zhang et al. Cell Mol Immunol. 2012 Sep.

Abstract

Suberoylanilide hydroxamic acid (SAHA), as a histone deacetylase (HDAC) inhibitor (HDACi), was recently found to exhibit an immunosuppressive effect. However, whether SAHA can synergize with calcineurin inhibitors (CNIs) to inhibit allograft rejection and its underlying mechanism remain elusive. In this study, we demonstrated the synergistic effects of SAHA and non-therapeutic dose of tacrolimus (FK506) in prolonging the allograft survival in a murine cardiac transplant model. Concomitant intragraft examination revealed that allografts from SAHA-treated recipients showed significantly lower levels of IL-17 expression, and no discernable difference for IL-17 expressions was detected between SAHA- and SAHA/FK506-treated allograft as compared with allografts from FK506-treated animals. In contrast, administration of FK506 significantly suppressed interferon (IFN)-γ but increased IL-10 expression as compared with that of SAHA-treated animals, and this effect was independent of SAHA. Interestingly, SAHA synergizes with FK506 to promote Foxp3 and CTLA4 expression. In vitro, SAHA reduced the proportion of Th17 cells in isolated CD4⁺ T-cell population and decreased expressions of IL-17A, IL-17F, STAT3 and RORγt in these cells. Moreover, SAHA enhances suppressive function of regulatory T (Treg) cells by upregulating the expression of CTLA-4 without affecting T effector cell proliferation, and increased the proportion of Treg by selectively promoting apoptosis of T effector cells. Therefore, SAHA, a HDACi, may be a promising immunosuppressive agent with potential benefit in conjunction with CNI drugs.


Figures

Figure 1
Figure 1
SAHA prolongs the cardiac allograft survival in murine model. (a) Fully MHC-mismatched cardiac allograft recipients (BALB/C→C57BL/6) were treated with DMSO, SAHA (50 mg/kg/day), FK506 (1 mg/kg/day) or SAHA–FK506 combination by intraperitoneal injection since the day receiving transplantation until when cardiac arrest occurred. Graft survival was assessed every day. (b, c) Pathological examination of allografts harvested on day 7 post-transplantation. Shown are section graphs from the low power field (b) and high power field (c). NC, negative control represented cardiac graft from isotransplantation. (d) Statistical analysis of the pathological graphs in (c). Infiltrating cells (left panel) and myocardial destruction (right panel) per high field were counted from four mice per group. *P<0.05, **P<0.01, compared with DMSO group. DMSO, dimethylsulfoxide; FK506, tacrolimus; SAHA, suberoylanilide hydroxamic acid.
Figure 2
Figure 2
The effect of SAHA on the expressions of inflammatory cytokines and immunomolecules. (af) The allografts were harvested 7 days after transplantation and were homogenized. Foxp3, CTLA-4, IL-17, CD11b, IL-10 and IFN-γ mRNA were measured by qPCR. The data are expressed as mean±s.d. (n=3). *P<0.05, **P<0.01, compared with DMSO group. NC, negative control represented cardiac graft from isotransplantation. (gh) The recipient thymus, draining lymph nodes and spleens were harvested 7 days after transplantation. CD4+ T cells were isolated and CD25+ and Foxp3+ T cells were measured by flow cytometry. Shown are representative of three separate experiments. DMSO, dimethylsulfoxide; FK, tacrolimus; IFN, interferon; qPCR, quantitative PCR; SAHA, suberoylanilide hydroxamic acid.
Figure 3
Figure 3
SAHA regulates Th17/Treg balance. (a) Cardiac transplant was performed with Foxp3−/− B6 mice as recipients (BALB/C→Foxp3−/− C57BL/6) as described in Figure 1a. Shown was the graft survival curve. (b) Naive CD4+ T cells were isolated from mice spleen, and polarized for Th17 differentiation in the presence of different concentration of SAHA. IL-17A expressing CD4+ T cells were measured by flow cytometry. Shown are representative of three separate experiments. (c) The effect of SAHA on the expressions of STAT3, RORγt and Foxp3 measured by western blots. Shown are representative of three separate experiments. (d) Gene expressions of IL-17A, IL-17F, STAT3, RORγt, Foxp3 and CTLA-4 in CD4+ T cells measured by qPCR. The data are expressed as mean±s.d. (n=3). *P<0.05, **P<0.01, compared with Th17 group. DMSO, dimethylsulfoxide; qPCR, quantitative PCR; SAHA, suberoylanilide hydroxamic acid; Treg, regulatory T.
Figure 4
Figure 4
SAHA enhances Treg cell function without affecting T effector responsiveness. On the seventh post-transplant day, CD4+CD25+ and CD4+CD25 T cells were isolated from the recipient spleen with different treatment. (a) CD4+CD25 T cells were stimulated with anti-CD3/CD28 antibodies; the cell proliferation was examined by flow cytometry. (b) Statistical analysis for CD4+CD25 T cells proliferation in (a). The data are expressed as mean±s.d. (n=4). *P<0.05, **P<0.01. (c) CD4+CD25+ T cells were mixed with CFSE labeled CD4+CD25 T cells at different ratio. Cells division was measured by flow cytometric analysis. Shown are representative of three separate experiments. (d) Treg cells were collected from SAHA-treated and DMSO-treated mice, and analyzed the expressions of Foxp3 and CTLA-4 by qPCR. The data are expressed as mean±s.d (n=3). *P<0.05, **P<0.01, compared with DMSO group. DMSO, dimethylsulfoxide; qPCR, quantitative PCR; Teff, T effector; Treg, regulatory T; SAHA, suberoylanilide hydroxamic acid.
Figure 5
Figure 5
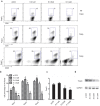
Low concentration of SAHA enhances Treg cell proportion without promoting Foxp3 expression in vitro. (a) Naive CD4+ T cells were isolated from mice spleen and activated with anti-CD3/CD28 in the presence or absence of TGF-β, with different concentrations of SAHA. The effect of SAHA on the generation of CD4+Foxp3+ T cells was assessed by flow cytometric analysis. (b) Statistical analysis for the effect of SAHA on the generation of CD4+Foxp3+ T cells in (a). The data are expressed as mean±s.d. (n=4). *P<0.05, **P<0.01, compared with α CD3 group. (c) Foxp3 expression assessed by qPCR. The data are expressed as mean±s.d. (n=3). *P<0.05, **P<0.01, compared with α CD3 group. (d) Foxp3 expression was assessed by western blots. Data are representative of three separate experiments. qPCR, quantitative PCR; TGF, transforming growth factor; Treg, regulatory T; SAHA, suberoylanilide hydroxamic acid.
Figure 6
Figure 6
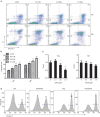
Low concentration of SAHA selectively induces apoptosis of Teff cells in vitro. (a) Naive CD4+ T cells were isolated from mice spleen, Treg (CD4+CD25+) and Teff (CD4+CD25) cells were then purified using magnetic beads and stimulated with anti-CD3/CD28 in the presence of different concentrations of SAHA for 24 or 48 h, cells apoptosis were analyzed by flow cytometry with PI and Annexin V staining. (b) Statistical analysis for the effect of SAHA on cell apoptosis in (a). The data are expressed as mean±s.d. (n=3). *P<0.05, **P<0.01, compared with α CD3 group. (c) Foxp3 expression in Treg cells (left) and Teff cells (right). The data are expressed as mean±s.d. (n=3). *P<0.05, **P<0.01, compared with SAHA (0 μM) group. (d) Apoptosis of Teff cells and Treg cells in low concentration of SAHA. Data are representatives of three separate experiments. qPCR, quantitative PCR; SAHA, suberoylanilide hydroxamic acid; Teff, T effector; Treg, regulatory T.

Similar articles

Cited by

References

    1. Nankivell BJ, Kuypers DR. Diagnosis and prevention of chronic kidney allograft loss. Lancet. 2011;378:1428–1437. - PubMed
    1. Hariharan S, Johnson CP, Bresnahan BA, Taranto SE, McIntosh MJ, Stablein D. Improved graft survival after renal transplantation in the United States, 1988 to 1996. N Engl J Med. 2000;342:605–612. - PubMed
    1. Pascual M, Theruvath T, Kawai T, Tolkoff-Rubin N, Cosimi AB. Strategies to improve long-term outcomes after renal transplantation. N Engl J Med. 2002;346:580–590. - PubMed
    1. Casey MJ, Meier-Kriesche HU. Calcineurin inhibitors in kidney transplantation: friend or foe. Curr Opin Nephrol Hypertens. 2011;20:610–615. - PubMed
    1. van de Wetering J, Koumoutsakos P, Peeters A, van der Mast BJ, de Kuiper P, Ijzermans JN, et al. Discontinuation of calcineurin inhibitors treatment allows the development of FOXP3+ regulatory T-cells in patients after kidney transplantation. Clin Transplant. 2011;25:40–46. - PubMed

Publication types

MeSH terms