. 2012 Sep;9(5):399-409.
doi: 10.1038/cmi.2012.29. Epub 2012 Aug 27.

Soluble ST2 protein inhibits LPS stimulation on monocyte-derived dendritic cells

Affiliations

Soluble ST2 protein inhibits LPS stimulation on monocyte-derived dendritic cells

Akihisa Nagata et al. Cell Mol Immunol. 2012 Sep.

Abstract

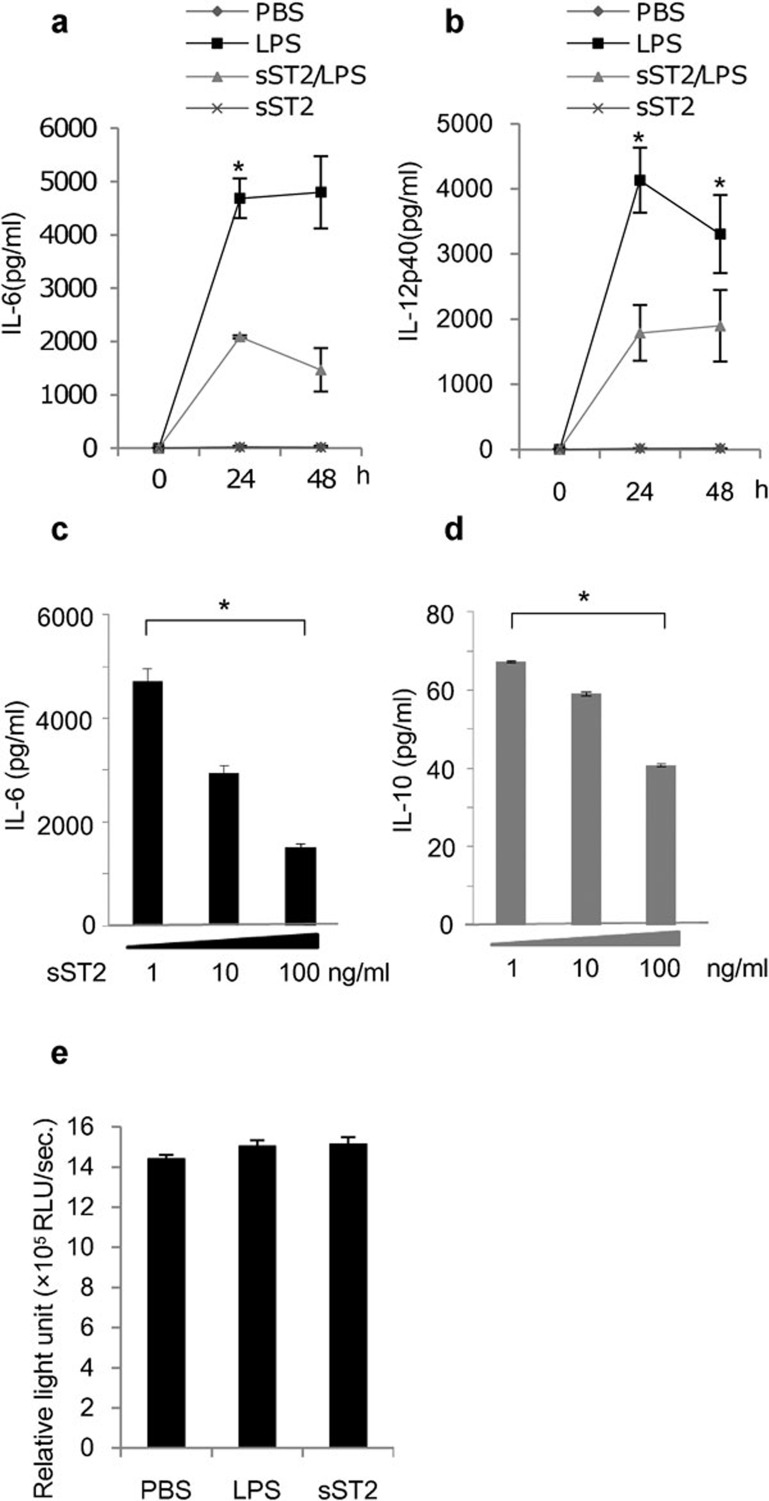
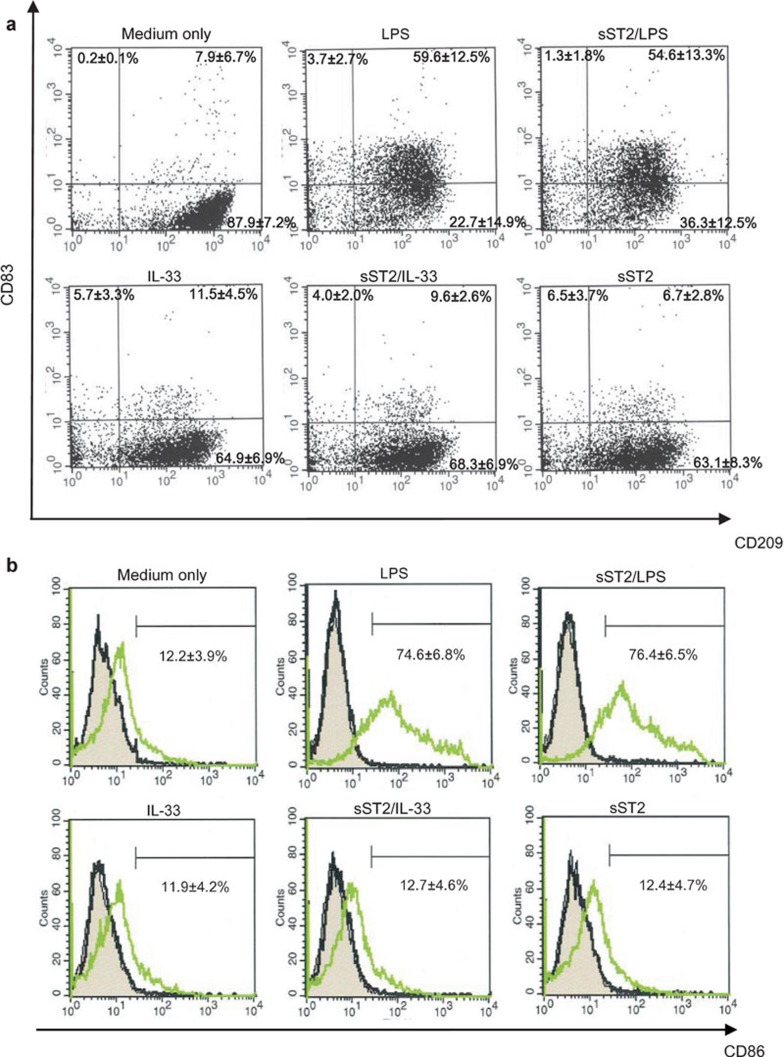
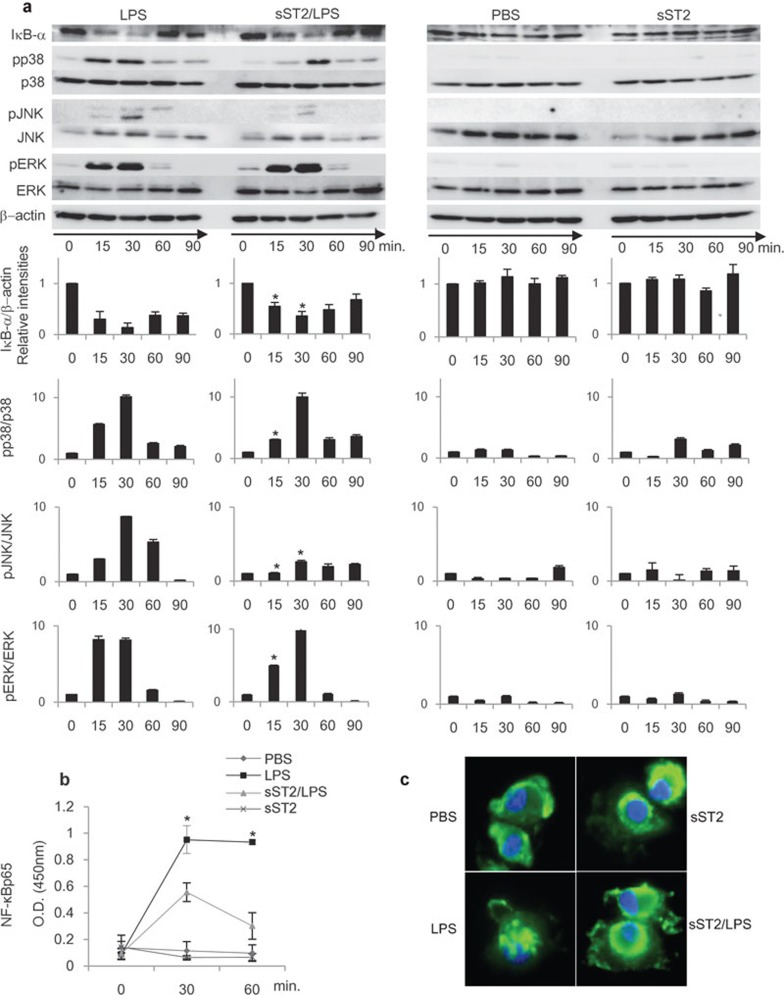
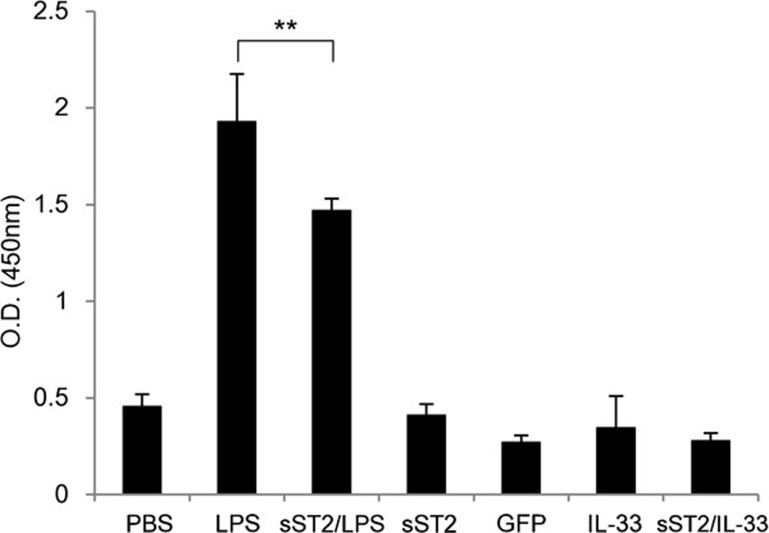
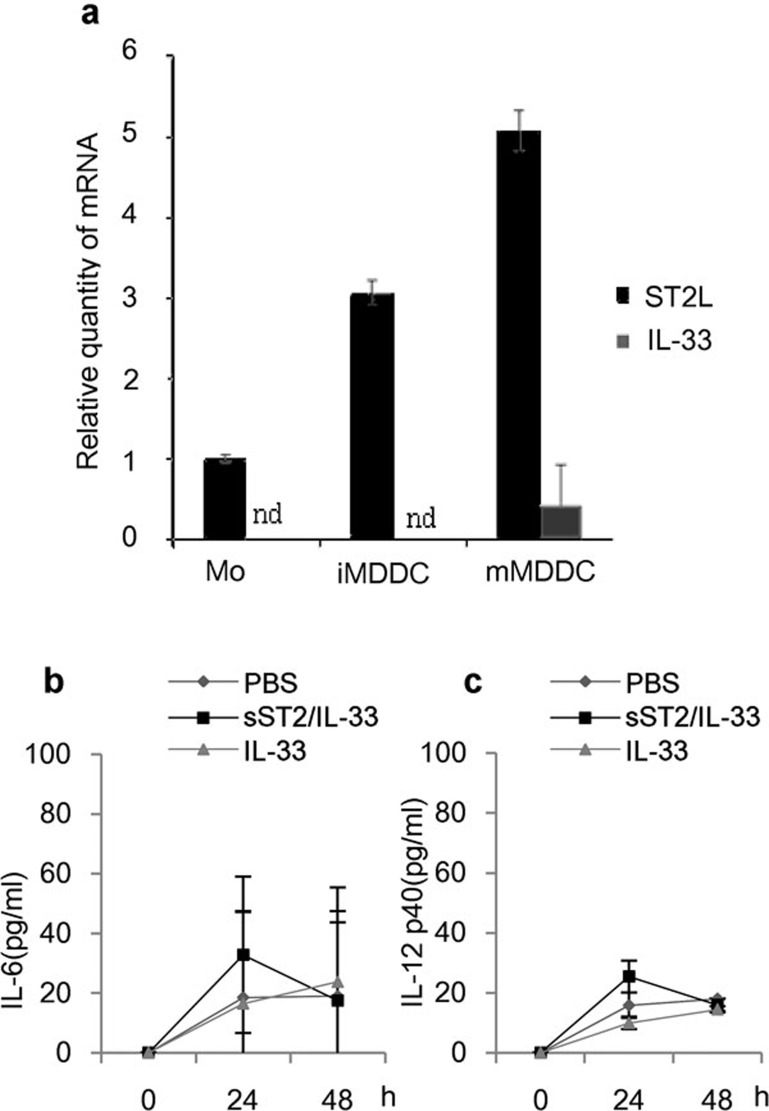
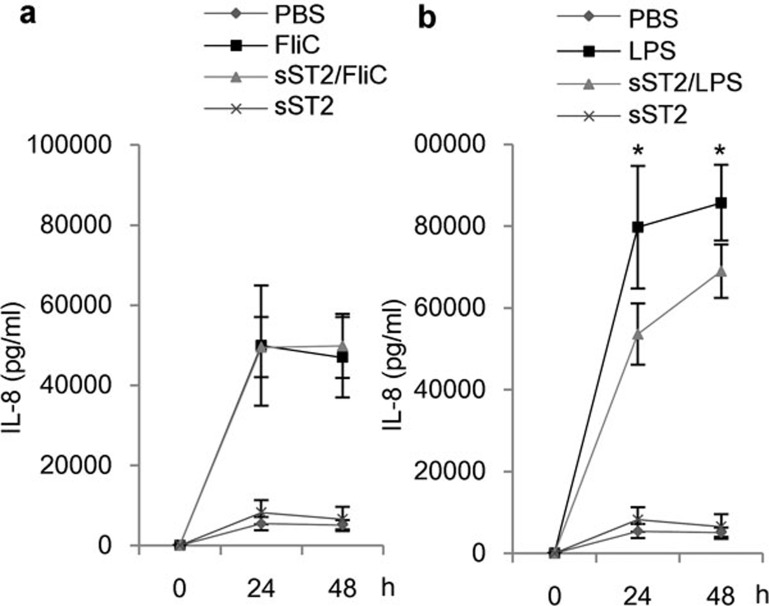
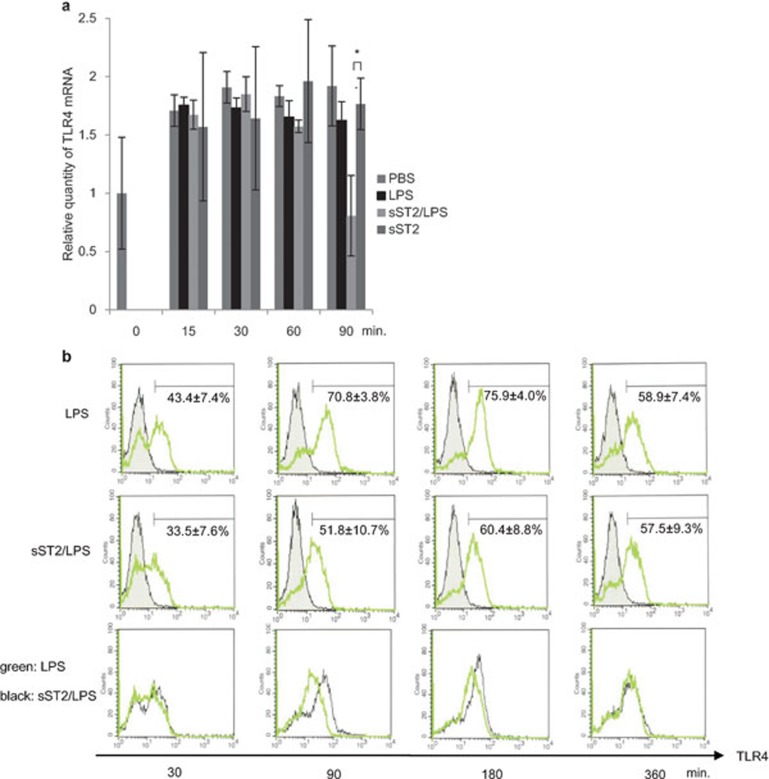
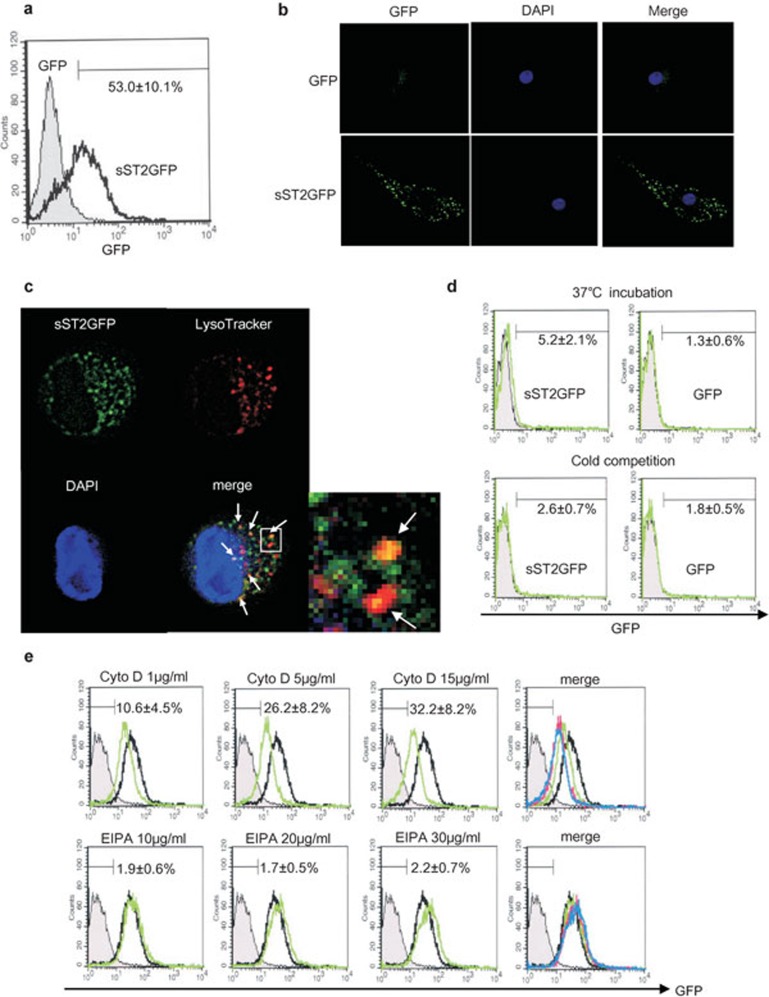
ST2 protein is a soluble splicing variant of ST2L protein, which is the receptor for interleukin-33 (IL-33). Previously, we reported that soluble ST2 suppressed the signal transduction of lipopolysaccharide (LPS) and cytokine production in monocytic cells. To investigate whether or not this inhibitory effect occurs in dendritic cells, which are the key players in innate and adaptive immunity, human monocyte-derived dendritic cells were pre-treated with soluble ST2 protein before LPS stimulation. Although soluble ST2 did not attenuate the LPS-induced maturation of dendritic cells, pre-treatment with soluble ST2 suppressed cytokine production and inhibited LPS signaling. Moreover, the proliferation of naive T cells was inhibited significantly by soluble ST2 pre-treatment. IL-33 had little effect on the cytokine production of immature monocyte-derived dendritic cells. Furthermore, soluble ST2 protein was internalized into dendritic cells, suggesting that soluble ST2 protein acts by a noncanonical mechanism other than the sequestration of IL-33.


Figures

Figure 1
Figure 1
sST2 inhibits the LPS-induced cytokine production of iMDDCs. (a) Time course of IL-6 secretion. iMDDCs (2.5×10⁵/well) were pre-treated for 1 h with or without sST2 (100 ng/ml), and then the cells were stimulated with LPS (100 ng/ml) for 24 or 48 h. The amount of IL-6 was determined by ELISA. (b) Time course of IL-12p40 secretion was measured as described in (a). (c) Dose dependency of the inhibitory effect of sST2 was tested at various concentrations (1, 10 and 100 ng/ml) against IL-6 production for 24 h after LPS stimulation. (d) Dose dependency of sST2 to IL-10 was also tested as (c). (e) Possible cytotoxicity of sST2 was assayed by measuring the amount of ATP in iMDDCs (3×10⁴/well) by the luciferase light-emitting method. The data are presented as the means of five experiments±s.d. Asterisks denote a statistically significant difference (*P<0.05). ATP, adenosine triphosphate; ELISA, enzyme-linked immunosorbent assay; IL, interleukin; iMDDC, immature monocyte-derived dendritic cell; LPS, lipopolysaccharide; sST2, soluble ST2 protein.
Figure 2
Figure 2
Characterization of MDDC phenotypes after various stimuli. iMDDCs were pre-treated for 1 h with or without sST2 (100 ng/ml), and the cells were stimulated with LPS (100 ng/ml) or IL-33 for 48 h at 37 °C. (a) The expression levels of CD83(PE) and CD209(APC) were detected by flow cytometry using the Mo-DC Differentiation Inspector. (b) The expression levels of CD86(PE) were detected using the anti-human CD86 antibody. A gray area is presenting MDDCs without staining after various stimuli. A black line shows MDDCs stained by mouse Ig-G1 as isotype control. A green line is MDDCs stained by anti-human CD86 antibody. The percentage of the each positive quadrant area is indicated as the means of three experiments±s.d. Mo-DC, monocyte-dendritic cell; IL, interleukin; iMDDCs, immature monocyte-derived dendritic cell; LPS, lipopolysaccharide; MDDC, monocyte-derived dendritic cell; sST2, soluble ST2 protein.
Figure 3
Figure 3
LPS signaling pathway was attenuated by sST2. (a) sST2 inhibited IκBα degradation and phosphorylation of MAPKs. iMDDCs with or without sST2 pre-treatment were stimulated by LPS (500 ng/ml) for 15, 30, 60, or 90 min, and the cell lysates were resolved by SDS–PAGE and transferred to PVDF membranes. The amounts of phosphorylated, total MAPKs, or IκBα were detected using specific antibodies. The relative intensities of the bands were calculated by LAS4000 and normalized with the values at 0 min. β-actin, p38, JNK, or ERK levels were used as control for equal loading. The representative result of three experiments is presented. Data indicated mean values±s.d. An asterisk denotes a statistically significant difference (*P<0.05). (b) Nuclear extracts were separated from iMDDCs with the same stimulus and time course for 15, 30, or 60 min as in (a), and then the amounts of NF-κBp65 in nuclear extracts were analyzed with NF-κBp65 transcription factor assay kit. The data are presented as means of three experiments±s.d. An asterisk denotes a statistically significant difference (*P<0.05). (c) sST2 inhibited nuclear translocation of NF-κBp65. iMDDCs were treated as indicated for 60 min, then incubated with anti-NF-κB p65 antibody for 60 min at room temperature. Representative data of three experiments are presented. iMDDCs, immature monocyte-derived dendritic cell; LPS, lipopolysaccharide; MAPK, MAP kinase; PVDF, polyvinylidene fluoride; SDS–PAGE, sodium dodecyl sulfate–polyacrylamide gel electrophoresis; sST2, soluble ST2 protein.
Figure 4
Figure 4
sST2 attenuates the proliferation of naive T-lymph cells by stimulated MDDCs autologously. iMDDCs were seeded at 2×10⁴/well in 96-well tissue culture plates and cocultured with naive CD4+ T cells at a 1:10 ratio with or without 500 ng/ml LPS, 100 ng/ml IL-33, or 500 ng/ml GFP for 5 days. LPS-induced mMDDCs without T cells and PBS-treated iMDDCs were employed as controls. BrdU incorporation was measured to assay the proliferation of naive CD4+ T cells. The data are presented as the means of three experiments±s.d. A double asterisk denotes a statistically significant difference (**P<0.01). GFP, green fluorescent protein; IL, interleukin; iMDDCs, immature monocyte-derived dendritic cell; LPS, lipopolysaccharide; MDDC, monocyte-derived dendritic cell; mMDDC, mature monocyte-derived dendritic cell; PBS, phosphate-buffered saline; sST2, soluble ST2 protein.
Figure 5
Figure 5
The involvement of IL-33/ST2L on cytokine production in iMDDCs. (a) IL-33 and ST2L mRNA levels were analyzed by real-time PCR in various maturation states of MDDCs. (b) iMDDCs were pre-treated for 1 h with or without sST2 (100 ng/ml), and then the cells were stimulated with IL-33 (50 ng/ml) for 24 or 48 h. The amount of IL-6 was determined by ELISA. (c) IL-12p40 production by IL-33 stimulation was assayed as described in (b). The data are presented as the means of three experiments±s.d. ELISA, enzyme-linked immunosorbent assay; IL, interleukin; iMDDCs, immature monocyte-derived dendritic cell; MDDC, monocyte-derived dendritic cell; sST2, soluble ST2 protein.
Figure 6
Figure 6
Flagellin stimulation was not inhibited by sST2. (a) iMDDCs were stimulated by flagellin (FliC, 100 ng/ml) for 24 or 48 h, and secreted IL-8 was determined by ELISA. The data are presented as the means of three experiments±s.d. (b) iMDDCs were stimulated by LPS (100 ng/ml), and the amount of IL-8 was determined as (a). Pre-treatment with sST2 decreased the amount of secreted IL-8 slightly. ELISA, enzyme-linked immunosorbent assay; IL, interleukin; iMDDCs, immature monocyte-derived dendritic cell; LPS, lipopolysaccharide; sST2, soluble ST2 protein.
Figure 7
Figure 7
TLR4 expression is suppressed by sST2. (a) Relative quantity of TLR4 mRNA was analyzed by real-time PCR after various stimuli (sST2, LPS, sST2/LPS) and normalized against endogenous β-actin. The data are presented as the means of three experiments±s.d. An asterisk denotes a statistically significant difference (*P<0.05). (b) iMDDCs were pre-treated with or without sST2 (100 ng/ml) and treated with LPS (500 ng/ml) for 30 to 360 min. TLR4 protein on the cell surface was analyzed by FACS with anti-TLR4-PE. The figures of the bottom column were showing the expression of TLR4 of LPS-stimulated iMDDCs (the upper column, red) superimposed on the middle column (sST2/LPS; green). Representative data of three experiments are presented. FACS, fluorescence-activated cell sorting; iMDDCs, immature monocyte-derived dendritic cell; LPS, lipopolysaccharide; sST2, soluble ST2 protein; TLR4, Toll-like receptor 4.
Figure 8
Figure 8
sST2-GFP is internalized into iMDDCs. (a) iMDDCs were incubated with sST2-GFP (100 ng/ml) for 16 h at 37 °C. The fluorescence intensity of GFP was analyzed by FACS. One of five similar experiments is presented. The percentage of positive cells are indicated as the means of three experiments±s.d. (b) sST2-GFP is attached to iMDDCs which were incubated with sST2-GFP or GFP as described in (a) and observed with a fluorescence microscope (green, sST2-GFP; blue, DAPI). (c) sST2-GFP and lysosomes were co-localized in iMDDCs. The lysosomes in iMDDCs treated with sST2-GFP were stained with LysoTracker probes (Red DND-99) and observed with a fluorescence microscope (green, sST2-GFP; red, lysosome; yellow, sST2-GFP and the lysosome merged). The representative data of three similar experiments are presented. (d) Cold competition of sST2-GFP binding to iMDDCs. iMDDCs were incubated with sST2-GFP on ice or at 37 °C for 1 h. The fluorescence intensity of GFP was analyzed by FACS (upper panel green, 37 °C; lower panel green, on ice; gray area, unstained control). The percentage of positive cells are indicated as the means of five experiments±s.d. (e) Inhibition of macropinocytosis. iMDDCs were pre-treated with cytochalasin D (1, 5 and 15 µg/ml) or EIPA (10, 20 and 30 µg/ml) for 30 min, then sST2-GFP (100 ng/ml) was added for 16-h culture. After incubation, the cells were washed twice with PBS, and then fluorescence was analyzed by FACS. The gray area shows the control without staining, and the black line shows iMDDCs incubated with sST2-GFP only. The merged panel presented cytochalasin D (green; 1 µg/ml, pink; 5 µg/ml, blue; 15 µg/ml) or EIPA (green; 10 µg/ml, pink; 20 µg/ml, blue; 30 µg/ml) lines. The percentage of positive cells are indicated as the means of five experiments±s.d. EIPA, 5-(N-ethyl-N-isopropyl)amirolide; DAPI, 4,6-diamidino-2-phenylindole; FACS, fluorescence-activated cell sorting; GFP, green fluorescent protein; iMDDCs, immature monocyte-derived dendritic cell; LPS, lipopolysaccharide; sST2, soluble ST2 protein.

Similar articles

Cited by

References

    1. Schmitz J, Owyang A, Oldham E, Song Y, Murphy E, McClanahan TK, et al. IL-33, an interleukin-1-like cytokine that signals via the IL-1 receptor-related protein ST2 and induces T helper type 2-associated cytokines. Immunity. 2005;23:479–490. - PubMed
    1. Hayakawa H, Hayakawa M, Kume A, Tominaga S. Soluble ST2 blocks interleukin-33 signaling in allergic airway inflammation. J Biol Chem. 2007;282:26369–26380. - PubMed
    1. Oshikawa K, Kuroiwa K, Tago K, Iwahana H, Yanagisawa K, Ohno S, et al. Elevated soluble ST2 protein levels in sera of patients with asthma with an acute exacerbation. Am J Respir Crit Care Med. 2001;164:277–281. - PubMed
    1. Lloyd CM. IL-33 family members and asthma - bridging innate and adaptive immune responses. Curr Opin Immunol. 2010;22:800–806. - PMC - PubMed
    1. Kuroiwa K, Arai T, Okazaki H, Minota S, Tominaga S. Identification of human ST2 protein in the sera of patients with autoimmune diseases. Biochem Biophys Res Commu. 2001;284:1104–1108. - PubMed