. 2012 Sep;7(9):602-8.
doi: 10.1038/nnano.2012.119. Epub 2012 Aug 26.

Single-protein nanomechanical mass spectrometry in real time

Affiliations

Single-protein nanomechanical mass spectrometry in real time

M S Hanay et al. Nat Nanotechnol. 2012 Sep.

Abstract

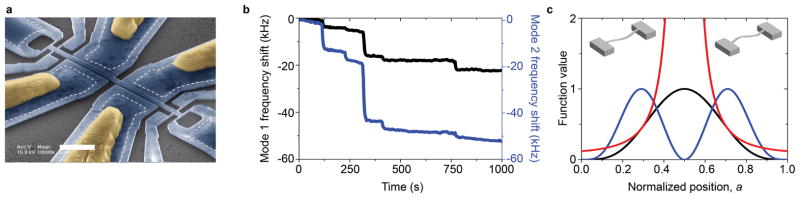
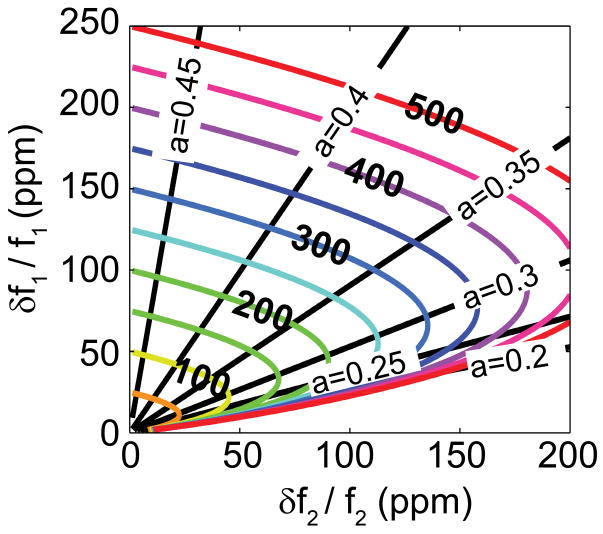
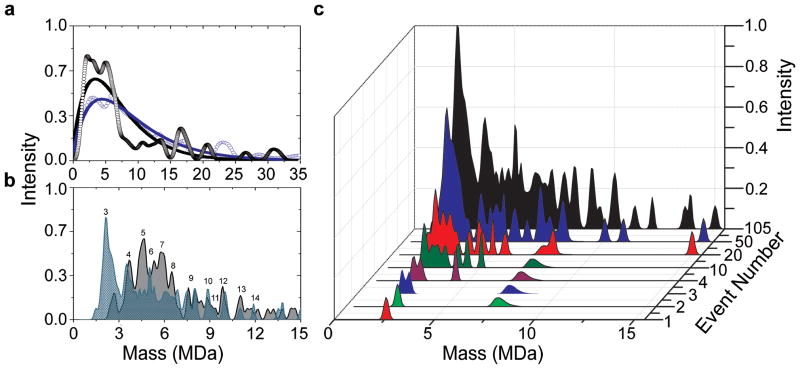
Nanoelectromechanical systems (NEMS) resonators can detect mass with exceptional sensitivity. Previously, mass spectra from several hundred adsorption events were assembled in NEMS-based mass spectrometry using statistical analysis. Here, we report the first realization of single-molecule NEMS-based mass spectrometry in real time. As each molecule in the sample adsorbs on the resonator, its mass and position of adsorption are determined by continuously tracking two driven vibrational modes of the device. We demonstrate the potential of multimode NEMS-based mass spectrometry by analysing IgM antibody complexes in real time. NEMS-based mass spectrometry is a unique and promising new form of mass spectrometry: it can resolve neutral species, provide a resolving power that increases markedly for very large masses, and allow the acquisition of spectra, molecule-by-molecule, in real time.


Conflict of interest statement

Competing Financial Interests

The authors declare no competing financial interests.

Figures

Figure 1
Figure 1. Multimode NEMS-based mass detection in real time
a, Colorized electron micrograph of a representative device used in this study. The white dotted line shows the boundaries of the region beneath the suspended device that anchors it to the substrate. Yellow regions represent Al/Si gate contacts. Positioned near the ends of the beam are narrow gauges that become strained with motion of the beam and thereby enable transduction of mechanical motion into electric resistance. The white scale bar is 2 microns. b, Time-correlated resonant frequency shifts of the two modes (mode 1 (black) and mode 2 (blue)) corresponding to individual gold nanoparticles landing on the NEMS. The frequency offsets are 44.6 MHz and 105.0 MHz for the first and second modes respectively. c, Responsivities of the first two modes of a doubly-clamped beam (black=mode 1, blue = mode 2) and their ratio, G (red). Insets: Mode shapes for the first and second in-plane modes.
Figure 2
Figure 2. Transformation from experimentally obtained, time-correlated, two-mode frequency jump data to analyte mass and position-of-adsorption
Pictured are universal mass and position contours in the correlated frequency jump |δf1/f1|,|δf2/f2| plane. The x and y axes represent the measured fractional frequency jumps, scaled in parts per million (ppm). The parametric curves displayed represent the following: i) Straight lines passing through the origin denote constant-adsorbate-position values. The beam center (a = 0.5) corresponds to the y-axis; the second mode has a node at this location. ii) Colored elliptical curves represent contours for constant adsorbate mass; these are labeled in units of mp/M and scaled in ppm. These parametric curves hold for the first two same-plane modes of a doubly-clamped beam, and assume only Euler-Bernoulli beam theory.
Figure 3
Figure 3. Joint probability distributions for analyte mass and position-of-adsorption
a, Experimental data of 5nm gold nanoparticles from the MALDI experiment. Each analyte captured by the NEMS resonator has an error disk that reveals its uncertainty in its mass and position-of-adsorption on the NEMS resonator. b, Monte-Carlo simulations of 5 and 10nm gold nanoparticles assuming a much lower size variance (~2%, no clustering) than the actual samples (~15–20%, with clustering). These simulations reveal the respective mass “bands” that would be expected for nearly monodisperse gold nanoparticle distributions.
Figure 4
Figure 4. The evolution of a NEMS-MS spectrum in real time
a, Mass spectra of 10nm gold nanoparticles from the ESI (blue, open circle) and the MALDI (black, open circle) setups. The solid lines represent best fits to the data with ESI (blue) d=9.8nm, σ=2.5nm and MALDI (black) d=10.7nm and σ=2.8nm. b, Mass spectra of 5nm gold nanoparticles from the MALDI setup showing results for samples prepared without glycerol (gray) and prepared with 10% glycerol (blue); the declustering effect from glycerol addition is evident. Peaks are labeled according to cluster size (e.g. the mass of 3 particles, 4 particles, 5 particles, etc.). c, Mass spectra of the ensemble of 5nm gold nanoparticles with glycerol as they arrive sequentially on the NEMS sensor. Each particle is represented as a spread in mass due to the measurement uncertainty. The event number refers to the number of particles that have accreted upon the device up to that point. The total, cumulative spectrum (black) is the additive result of 105 individually measured particles.
Figure 5
Figure 5. The nanomechanical mass spectra for Human IgM
a, Molecule-by-molecule acquisition of the mass spectra for human IgM. Analytes accumulating at different molecular weights correspond to different isoforms of the molecule. The final spectrum shown in black is the additive result of individual mass measurements on 74 accreted molecules and has readily identifiable sharp peaks corresponding to major isoforms of IgM typically found in human serum. b, Decomposition of the IgM spectra into different polymerization levels. Gray lines delineate the cut-off thresholds used in assigning the different forms of IgM. The most dominant form of IgM in the human serum is the pentameric form (M5) with a molecular weight of approximately 1 MDa, observed as the global maximum of the NEMS MS spectra. Subpopulations of other forms are also observed, at masses corresponding to M3, M4, and M6 through M12. Inset shows the histogram of the event masses binned according to mass resolution. The vertical axis of the inset corresponds to the number of events, while the horizontal axis is the mass in MDa. c, Mass spectra of individual subunits are displayed quantitatively with single-molecule accuracy. Intensity peaks of different polymerized forms of IgM (M3 to M12) yield the mathematically integrated composite mass spectrum (light grey) of the IgM sample. The numbers in parenthesis in the legend show the number of measured molecules for each isoform.

Similar articles

Cited by

References

    1. Andersson CO. Mass Spectrometric Studies on Amino Acid and Peptide Derivatives. Acta Chem Scand. 1958;12:1353.
    1. Beynon JH. The use of the mass spectrometer for the identification of organic compounds. Microchim Acta. 1956;44:437.
    1. Domon B, Aebersold R. Mass spectrometry and protein analysis. Science. 2006;312:212–217. - PubMed
    1. Benesch JLP, Robinson CV. Mass spectrometry of macromolecular assemblies: preservation and dissociation. Curr Opin Struc Biol. 2006;16:245–251. - PubMed
    1. Robinson CV, Benesch JLP, Ruotolo BT, Simmons DA. Protein complexes in the gas phase: Technology for structural genomics and proteomics. Chem Rev. 2007;107:3544–3567. - PubMed

Publication types