. 2012 Sep 13;489(7415):299-303.
doi: 10.1038/nature11321.

Activity in motor-sensory projections reveals distributed coding in somatosensation

Affiliations

Activity in motor-sensory projections reveals distributed coding in somatosensation

Leopoldo Petreanu et al. Nature. .

Abstract

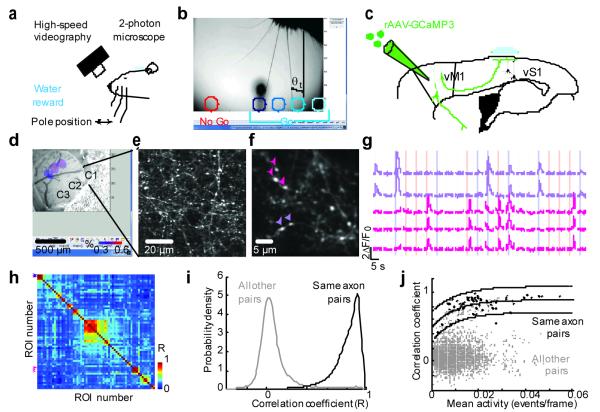
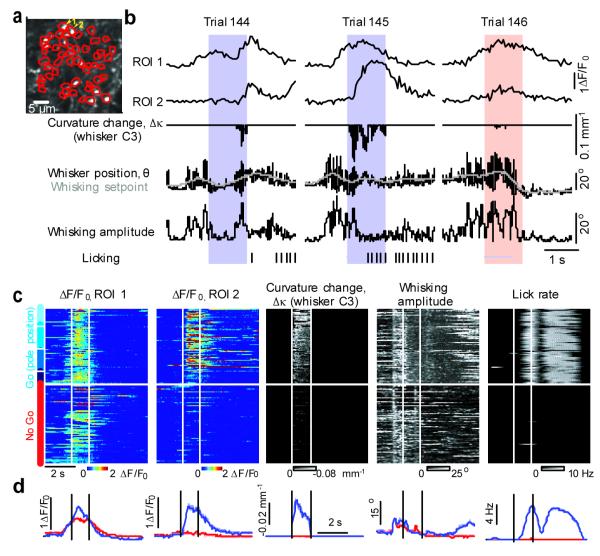
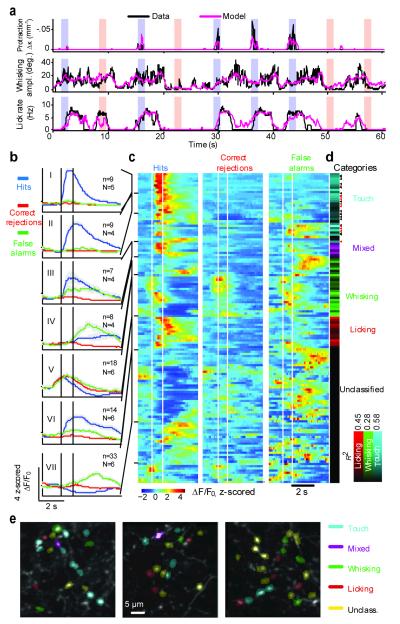
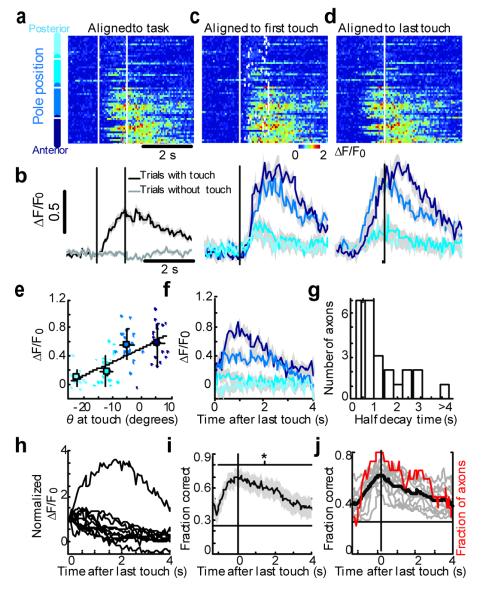
Cortical-feedback projections to primary sensory areas terminate most heavily in layer 1 (L1) of the neocortex, where they make synapses with tuft dendrites of pyramidal neurons. L1 input is thought to provide ‘contextual’ information, but the signals transmitted by L1 feedback remain uncharacterized. In the rodent somatosensory system, the spatially diffuse feedback projection from vibrissal motor cortex (vM1) to vibrissal somatosensory cortex (vS1, also known as the barrel cortex) may allow whisker touch to be interpreted in the context of whisker position to compute object location. When mice palpate objects with their whiskers to localize object features, whisker touch excites vS1 and later vM1 in a somatotopic manner. Here we use axonal calcium imaging to track activity in vM1-->vS1 afferents in L1 of the barrel cortex while mice performed whisker-dependent object localization. Spatially intermingled individual axons represent whisker movements, touch and other behavioural features. In a subpopulation of axons, activity depends on object location and persists for seconds after touch. Neurons in the barrel cortex thus have information to integrate movements and touches of multiple whiskers over time, key components of object identification and navigation by active touch.


Figures

Figure 1
Figure 1. Imaging activity in vM1 → vS1 axons during whisker-based object localization
a, Head-fixed mouse performing an object localization task under the microscope. b, One frame of a high-speed video sequence and typical pole positions corresponding to multiple Go (hues of blue) and a single No Go (red) locations. Whisker touch was possible for all object locations for the long posterior whiskers. The azimuthal angle, θ, describes whisker position (θt, azimuthal angle at first touch). c, vM1 neurons were infected with GCaMP3-expressing virus and their axons were imaged in layer 1 of vS1. d, Intrinsic optical imaging signals corresponding to deflections of whiskers C1, C2, and C3, overlaid on a brightfield image of the vasculature. e, 2-photon images showing vM1 axons in the C1 barrel column. f, Field of view used for in vivo imaging, showing varicosities (arrowheads, correspond to varicosities used for fluorescence time series on the right). g, Fluorescence dynamics over multiple behavioral trials. Colored bars indicate the sampling period, when the pole is within reach (blue, Go trials; red, No Go trials). h, Matrix of correlation coefficients for activity in different varicosities in one field of view. Arrowheads correspond to varicosities marked in h. i, Distribution of correlation coefficients for all fields of view. Black line, pairs of varicosities on the same axon (78 varicosities, 31 axons); grey line, all other varicosity pairs (51,325 varicosities). Correlation coefficients were computed over the entire session. j, Correlation coefficients as a function of mean activity level (black, pairs of varicosities on the same axon; grey, all other pairs). The solid line is a fit of the curve y= a * (1 − eb*x)+c to the black circles; the dashed lines represent the 95% confidence interval.
Figure 2
Figure 2. Motor and sensory signals in vM1 → vS1 axons
a, Image of the field of view and regions of interest (ROI, red) corresponding to all visible axonal varicosities. b, Activity (ΔF/F0) of two individual axons (ROI1 and ROI2) across three trials of one behavioral session, aligned with different behavioral features (whisker position, whisking setpoint, whisking amplitude, curvature change, licking (ticks)). Protraction forces correspond to negative curvature changes. Colored bars indicate the sampling period (blue, Go trials; red, No Go trials). c, Activity across an entire session for two axons (ΔF/F0 ROI 1; ΔF/F0 ROI 1). Each row corresponds to a trial. Dashed white lines indicate the sampling period when the pole is within reach. Trial type is indicated on the far left (hues of blue correspond to different object locations in Go trials, as indicated in Fig. 1b). Only correct trials are shown. Right, behavioral variables (see Methods). Curvature changes, Δκ, due to protractions; retractions are not shown. Whisking amplitude is the amplitude of the band-pass filtered (6-30 Hz) whisker angle. Lick rate is the instantaneous rate of tongue protractions. d, Activity (left) and behavioral variables (right) averaged across trial types.
Figure 3
Figure 3. Decoding behavioral variables based on axonal activity
a, Decoding based on populations of axons. Time series of behavioral features down-sampled to 16 Hz (black) and the Random Forests model prediction (pink) based on the activity of all axons in one field of view. Vertical bars indicate the sampling periods and the trial type. Top, whisker curvature change, Δκ, induced by touch during protractions (whisker C2), a measure of contact force. Center, whisking amplitude. Bottom, lick rate. b-e, Decoding behavioral features based on activity of individual axons. Axons were classified based on correlations with behavioral features (138 axons, 6 animals, 17 sessions). b, PSTHs averaged across axons with shared activity patterns and trial types, in standardized units (z-score). (‘Hits’ are correct Go trials, blue; ‘Correct rejections’ are correct No Go trials, red; ‘False alarms’ are incorrect No Go trials, green; Incorrect Go trials were rare and are thus not shown). Correct trials and error trials were used separately in classification. N, number of animals; n, number of axons. I) Touch axons. II) Touch axons with persistent activity. III) Mixed axons. IV) Whisking axons, late activity. V) Whisking axons, early activity. VI) Licking axons. VII) Axons that are selectively active during False alarms; these were unclassified using the behavioral features used. Shading, s.e.m. c, Rows correspond to axons. Task-aligned activity was averaged over trials of each type. Rows were ordered based on clustering by activity pattern (Methods). d, Correlation between the Random Forests model and different behavioral features (Ri2) after classification (Methods). The hue indicates the strongest correlation with one of the features (cyan, touch; magenta, mixed; green, whisking; red, licking). Arrowheads, axons showing object location-dependent activity; Red arrowheads, significantly persistent (Figure 4). e, Axons decoding different behavioral features were spatially intermingled (3 sessions from 3 different animals).
Figure 4
Figure 4. Persistent object location-dependent activity
a Activity of an example axon for different object locations (hues of blue on the left; cf Fig. 1b; only correct Go trials are shown). Activity was aligned to start of trial (vertical dashed lines indicate presence of the pole). b, Activity averaged across trials with touch (black) and without touch (grey) aligned to start of trial. c, Same data as in a, aligned to first touch (vertical line). Ticks, last touch in each trial. Bottom, activity averaged across object locations, aligned to first touch (Hits). Shading, s.e.m. d, Same data as in a, aligned to the last touch. Bottom, activity averaged across object locations, aligned to last touch. e, Activity as a function of θ at touch. Same axon as in a. For averaging, points were grouped by object location. Black line, linear regression (R2, 0.41; p, 2.5×10⁻⁹). Error bars, standard deviations. f, Activity averaged across object locations, aligned to last touch and deconvolved to correct for the dynamics of calcium and GCaMP3 fluorescence (same axon as in a) (see also Supplementary Fig 8). g, Decay time of fluorescence after last touch for all axons showing object location-dependent activity (n=25). The dashed vertical line indicates T1/2 for GCaMP3 fluorescence without persistent activity. h, Average fluorescence signals for axons showing persistent activity (n=11). Activity was normalized to the value at the time of last touch. i, The fraction of trials with correctly decoded object location as a function of time for the example axon shown in a-d. Dashed line, chance level(0.25, corresponding to four object locations). Horizontal line, time of significant decoding (p<0.05). j, Decoding of object location (same group as in h; black line, average; red line, fraction of axons decoding above chance level).

References

    1. Felleman DJ, Van Essen DC. Distributed hierarchical processing in the primate cerebral cortex. Cereb Cortex. 1991;1:1–47. - PubMed
    1. Cauller LJ, Connors BW. Synaptic physiology of horizontal afferents to layer 1 in slices of rat S1 neocortex. J. Neurosci. 1994;14:751–762. - PMC - PubMed
    1. Cauller L. Layer I of primary sensory neocortex: where top-down converges upon bottom-up. Behavioural brain research. 1995;71:163–170. - PubMed
    1. Veinante P, Deschenes M. Single-cell study of motor cortex projections to the barrel field in rats. J Comp Neurol. 2003;464:98–103. - PubMed
    1. Petreanu L, Mao T, Sternson SM, Svoboda K. The subcellular organization of neocortical excitatory connections. Nature. 2009;457:1142–1145. - PMC - PubMed

Publication types