. 2012 Sep;14(9):911-23.
doi: 10.1038/ncb2566. Epub 2012 Aug 26.

CDKL5 ensures excitatory synapse stability by reinforcing NGL-1-PSD95 interaction in the postsynaptic compartment and is impaired in patient iPSC-derived neurons

Affiliations

CDKL5 ensures excitatory synapse stability by reinforcing NGL-1-PSD95 interaction in the postsynaptic compartment and is impaired in patient iPSC-derived neurons

Sara Ricciardi et al. Nat Cell Biol. 2012 Sep.

Abstract

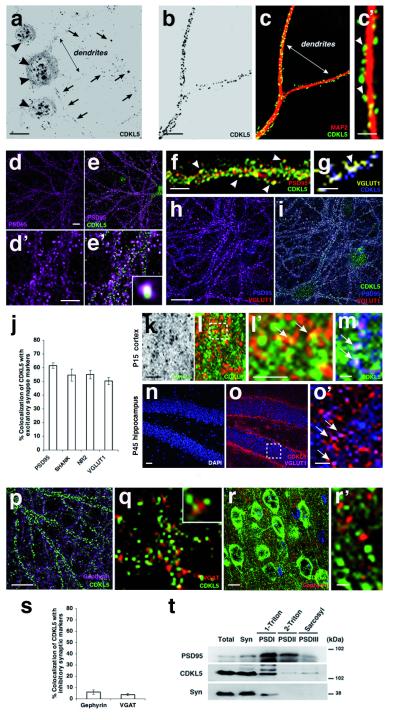
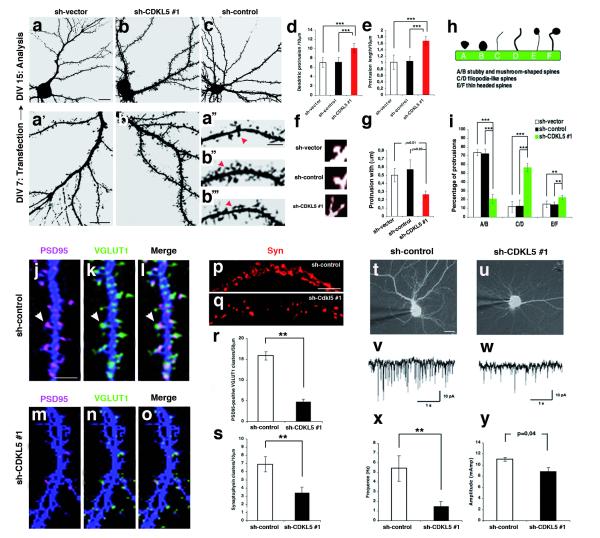
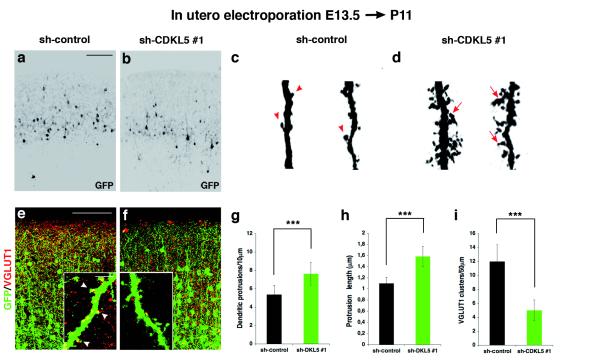
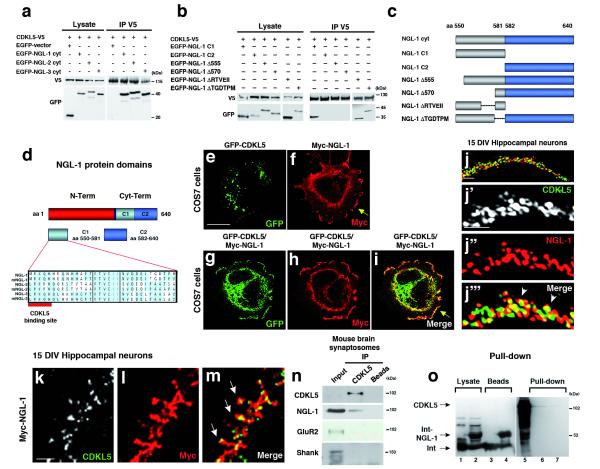
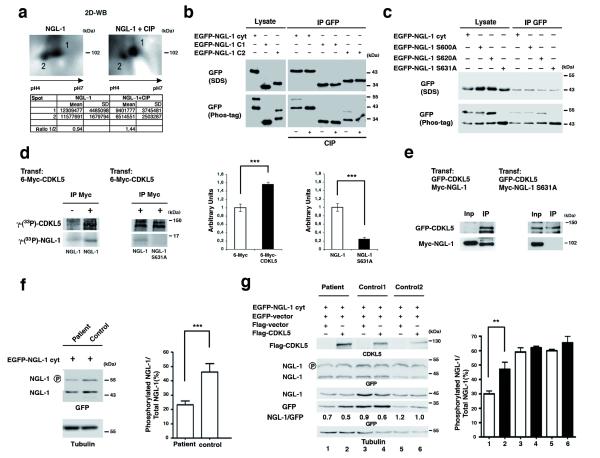
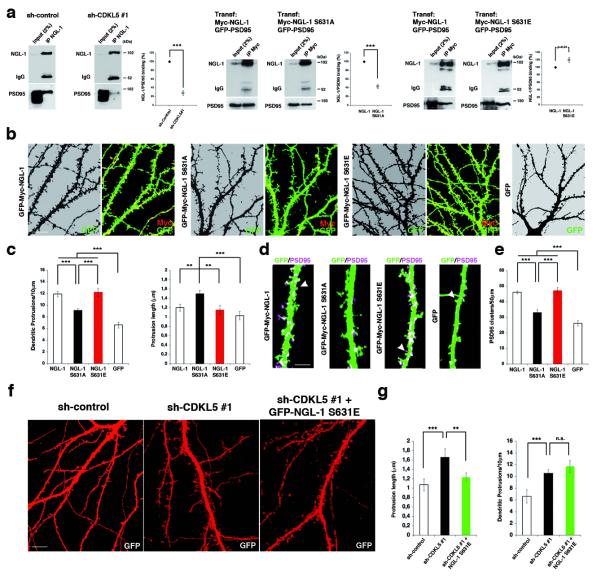
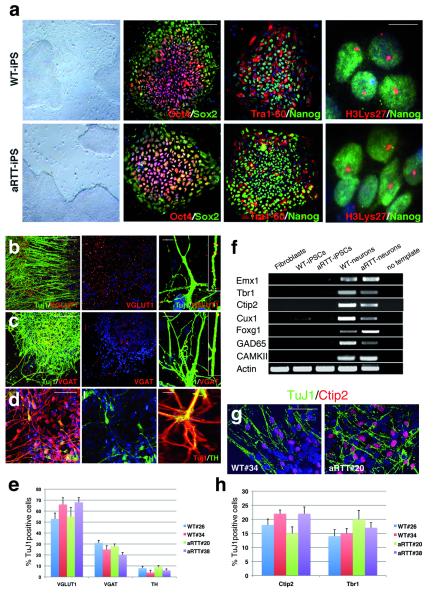
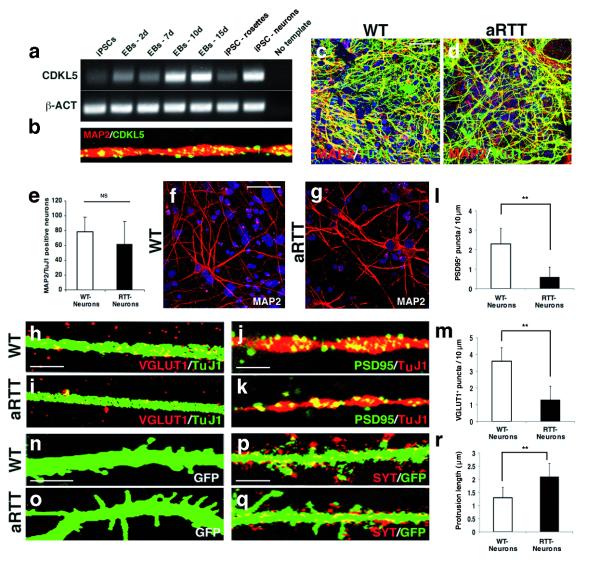
Mutations of the cyclin-dependent kinase-like 5 (CDKL5) and netrin-G1 (NTNG1) genes cause a severe neurodevelopmental disorder with clinical features that are closely related to Rett syndrome, including intellectual disability, early-onset intractable epilepsy and autism. We report here that CDKL5 is localized at excitatory synapses and contributes to correct dendritic spine structure and synapse activity. To exert this role, CDKL5 binds and phosphorylates the cell adhesion molecule NGL-1. This phosphorylation event ensures a stable association between NGL-1 and PSD95. Accordingly, phospho-mutant NGL-1 is unable to induce synaptic contacts whereas its phospho-mimetic form binds PSD95 more efficiently and partially rescues the CDKL5-specific spine defects. Interestingly, similarly to rodent neurons, iPSC-derived neurons from patients with CDKL5 mutations exhibit aberrant dendritic spines, thus suggesting a common function of CDKL5 in mice and humans.


Figures

Figure 1
Figure 1
CDKL5 localizes in dendrites and gathers at excitatory synapses both, in vitro and in vivo. (a) Primary hippocampal neurons immunolabeled at DIV 15 with an antibody against CDKL5. Arrowheads point to intranuclear CDKL5 immunolocalization. Arrows point to CDKL5 immunolabeling in neuronal dendrites. (b-c’) Primary hippocampal neurons at DIV 15 co-immunostained for CDKL5 and MAP2. c’ shows higher magnification of c. In c’, arrowheads point to CDKL5 dendritic puncta localized to dendritic spines. (d-f) Primary hippocampal neurons immunolabeled at DIV 15 with antibodies against CDKL5 and PSD95. d’ and e’ show higher magnification of d and e. Inset in e’ and arrowheads in f show domains of co-localization between CDKL5 and PSD95. (g) Immunostaining of hippocampal neurons with CDKL5 and VGLUT1. Arrowhead indicates co-localization of CDKL5 and VGLUT1. (h,i) Immunostaining of CDKL5 in hippocampal neurons at DIV 15 shows CDKL5 clustering at excitatory synapses co-localizing with PSD95 and apposed to VGLUT1. (j) Quantification of the mean percent of co-localization (± s.e.m.) of endogenous CDKL5 with PSD95, Shank, NR2 and VGLUT1. n = 10 neurons for each. n derived from three experiments. (k-o’) Immunolocalization of CDKL5 in mouse brain also shows CDKL5 clustering at excitatory synapses, as shown by apposition with PSD95 (l) or Shank (m) in postnatal day (P) 15 mouse cortex and with VGLUT1 in postnatal day (P) 45 mouse hippocampus (n-o’). (l’) is a higher magnification of the boxed area in l. (o’) is a higher magnification of the boxed area in o. Arrows in l’, m and o’ point to a region of co-localization of CDKL5 with either, PSD95, Shank or VGLUT1. (p-r’) Immunostaining with CDKL5 and either, gephyrin or VGAT antibodies both, in vitro (p,q) and in vivo (r,r’). (s) Quantification of the mean percent of co-localization (± s.e.m.) of endogenous CDKL5 with gephyrin and VGAT. n = 10 neurons for each. n derived from three experiments. (t) CDKL5 is detected in the synaptosomal fraction (Syn) and is enriched in the postsynaptic density fraction I (PSDI). Note that CDKL5 is also detected in postsynaptic density fractions II and III (PSDII and PSDIII). PSD95 and Synaptophysin (Syn) were used as a control. Scale bars: 10 μm (a, b, d, h, k, p, r), 5 μm (d’, f, l’, o’), 3 μm (c’, g, m), 1 μm (r’).
Figure 2
Figure 2
CDKL5 knock-down alters spine morphology and synaptic activity. (a-i) Effects of CDKL5 knock-down on spine morphology. (a-c) Representative images of primary hippocampal neurons transfected at DIV 7 with sh-vector, sh-control or sh-CDKL5#1 and labeled for GFP at DIV 14. a’ and b’ show higher magnifications of (a) and (b). a’’, b’’ and b’’’ represent higher magnifications of (a) and (b) and show the spine phenotype in single GFP-positive dendrites expressing either, sh-vector or sh-CDKL5#1. In a’’, b’’ and b’’’, arrowheads point to dendritic protrusions. (d,e) Quantification of dendritic protrusion density (d) and length (e) of sh-vector, sh-control and sh-CDKL5#1 transfected neurons. Bar graphs show mean ± s.e.m. n = 15 neurons for sh-vector, n = 18 neurons for sh-control and sh-CDKL5#1 (***p<0.001, t test). n derived from four independent experiments. (f,g) CDKL5 down-regulation decreases spine width. Bar graphs show mean ± s.e.m. n = 15 neurons for sh-vector, n = 18 neurons for sh-control and sh-CDKL5#1 each. n derived from four independent experiments. (h) Schematic representation of dendritic protrusion morphology categories. (i) Quantification of the mean percent of spines in each morphology category in neurons expressing sh-vector, sh-control or sh-CDKL5 #1. Bar graphs show mean ± s.e.m. n = 15 neurons for sh-vector, n = 18 neurons for sh-control and sh-CDKL5#1 each (***p<0.001, **p<0.01, t test). n derived from four independent experiments. (j-s) CDKL5 knock-down affects excitatory synapse number. Primary hippocampal neurons were transfected at DIV 7 with sh-control or sh-CDKL5#1 and immunostained at DIV 14 with the indicated antibodies. l and o represent merged images. Arrowheads in j, k and l indicate co-localization of PSD95 with VGLUT1 at dendritic spines. Bar graphs in r and s show mean ± s.e.m. n = 16 neurons for sh-control and sh-CDKL5#1 each (**p<0.01, t test). n derived from three independent experiments. (t-y) CDKL5 knock-down in DIV 15 cultured neurons reduced the frequency (x) and the amplitude (y) of mEPSCs. n = 9 neurons for sh-control and n = 13 neurons for sh-CDKL5#1 (**p<0.01, t test). n derives from two independent experiments. Scale bar: 10 μm (a, a’, j, p, t), 5 μm (a’’).
Figure 3
Figure 3
CDKL5 knock-down impairs spine structure and excitatory synapse density in vivo. (a,b) Representative confocal images of coronal slices of postnatal day (P) 11 mouse brains transfected with sh-control or sh-CDKL5#1 by in utero electroporation at E13.5. Many transfected GFP-positive cells were detected in each transfection condition. (c,d) Representative images of single dendrites of GFP-positive cortex pyramidal neurons expressing sh-control or sh-CDKL5#1. Arrows and arrowheads point to morphological normal and aberrant spines, respectively. (e,f) Representative confocal images of cortex pyramidal neurons transfected with either sh-control or sh-CDKL5#1 and immunostained for GFP and VGLUT1. Arrowheads in (e) show co-localization of CDKL5 and VGLUT1 at dendritic spines. (g,h) Quantitative analysis of dendritic protrusion density and length of GFP-positive cortex pyramidal neurons. Bar graphs show mean ± s.e.m. n = 15 neurons for each condition (***p<0.001, t test). n derived from three independent experiments. (i) Quantitative analysis of VGLUT1 clusters in GFP-positive cortex pyramidal neurons. Bar graphs show mean ± s.e.m. n = 9 neurons for each condition (***p<0.001, t test). n derived from three independent experiments. Scale bar: 100 μm (a, e).
Figure 4
Figure 4
CDKL5 and NGL-1 interact in vitro and in vivo. (a) HEK293T cells were co-transfected with CDKL5-V5 and EGFP NGL-1, -2, -3 constructs representing their intracellular cytoplasmic region. Cell lysates were immunoprecipitated with anti-V5 antibody. Western blots were probed with anti-V5 or anti-GFP-HRP antibody. (b) HEK293T cells were co-transfected with CDKL5-V5 and various EGFP-NGL-1 cyt deletion constructs. Cell lysates were immunoprecipitated with anti-V5 antibody. Western blots were probed with anti-V5 or anti-GFP-HRP antibody. (c) Schematic representation of deletion clones used for determining the CDKL5 binding site in the intracellular C-terminal domain of NGL-1. (d) Schematic representation of NGL-1 protein together with its intracellular C-terminal domain (Cyt-Term) and CDKL5 binding site. (e-i) Co-clustering assay in COS-7 cells expressing GFP-CDKL5 (e), Myc-NGL-1 (f) and GFP-CDKL5 in combination with Myc-NGL-1 (g-i). (i) Merged image. Arrow in i shows redistribution of GFP-CDKL5 on the plasma membrane upon co-transfection with NGL-1. (j-j’’’) Primary hippocampal neurons labeled at DIV 15 for CDKL5 and NGL-1. Arrowheads in j’’’ show colocalization of CDKL5 with NGL-1 (k-m) Primary hippocampal neurons transfected with Myc-NGL-1 at DIV 7 and 7 days later labeled for CDKL5 and Myc-NGL-1 to detect endogenous CDKL5 and recombinant Myc-NGL-1 protein. In m, arrows point to a region of co-localization between CDKL5 and NGL-1 at dendritic spines. (n) Interaction of endogenous NGL-1 with CDKL5 by co-immunoprecipitation from synaptosome lysates of postnatal day (P) 4 mouse brain. Anti-GluR2 and anti-Shank antibodystainings served as negative control. (o) Intein fusion protein of NGL-1 (amino acids 550-640) pulls down CDKL5. Lanes 1 and 2: cellular lysate of IPTG induced samples; lanes 3 and 4: Intein or Intein-NGL-1-immobilized agarose beads; lane 5: CDKL5 input; lanes 6 and 7: CDKL5 pull-down induced by Intein-NGL-1 or Intein alone. Scale bar: 10 μm (e), 5 μm (j, j’ k).
Figure 5
Figure 5
CDKL5 mediates phosphorylation in NGL-1 at Ser-631. (a) Total brain extracts were left untreated (left panel) or were treated with alkaline phosphatase (CIP) (right panel), subjected to 2-D gel electrophoresis and analyzed by immunoblotting with anti-NGL-1 antibody. In a, the table reports the results of the densitometric scanning quantification of the spots 1 and 2 and the ratio (½) of both, in control and CIP treated samples. (b) Immunoprecipitations performed with anti-GFP antibody of HEK293T cells lysates transfected with the indicated plasmids and treated with CIP (+) or left untreated (-). Proteins were resolved in normal SDS-PAGE gels (upper panel) and in phosphate-affinity PAGE gels (lower panel). (c) HEK293T cells were transfected with EGFP-NGL-1 cyt, EGFP-NGL-1 S600A, EGFP-NGL-1 S620A or EGFP-NGL-1 S631A constructs. Immunoprecipitations were performed with anti-GFP antibody. Proteins were resolved in a normal SDS gel (upper panel) and a Phos-Tag gel (lower panel). (d) In vitro kinase assay performed of HEK293T cell lysates transfected with the indicated plasmids. The mean relative NGL-1 and NGL-1 S631A phosphorylation is illustrated in a bar graph (***p<0.001, t test). (e) Total cell lysates of HEK293T cells transfected with the indicated plasmids were subjected to immunoprecipitations with monoclonal anti-GFP and anti-Myc antibodies. (f) Control and CDKL5 negative patient fibroblast cells were transfected with EGFP-NGL-1 cyt. Total cell lysates were resolved in a Phos-Tag SDS gel and probed with anti-GFP-HRP antibody. Anti-tubulin antibody staining served as loading control. The relative NGL-1 phosphorylation is presented as means +/− SD of four independent experiments compared to the total amount of NGL-1 (***p<0.001, t test). (g) Total cell lysates of both, control and CDKL5 negative patient fibroblast cells were transfected with the indicated plasmids and resolved in a normal SDS gel or in a Phos-Tag SDS gel. GFP protein levels were used to monitor transfection efficiency as indicated in NGL-1/GFP ratios (given in arbitrary units). The relative NGL-1 phosphorylation is presented as means +/− SD of three independent experiments compared to the total amount of NGL-1 (**p<0.01, t test).
Figure 6
Figure 6
CDKL5-dependent phosphorylation of NGL-1 is necessary for NGL-1/PSD95 binding and correct spine morphogenesis. (a) CDKL5 knock-down reduces NGL-1/PSD95 binding in primary cortical neurons (left panel). Lysates of primary cortical neurons (DIV 14) infected with either sh-control or sh-CDKL5#1, were immunoprecipitated with antibodies against NGL-1 and immunoblotted with NGL-1 and PSD95 antibodies. CDKL5-dependent phosphorylation of NGL-1 on S631 sustains NGL-1 binding to PSD95 (middle panel). Lysates of HEK293T cells double-transfected with GFP-PSD95 plus Myc-NGL-1 or Myc-NGL-1-S631A were immunoprecipitated using an antibody against Myc and immunoblotted with Myc and PSD95 antibodies. Lysates of HEK293T cells double-transfected with GFP-PSD95 plus Myc-NGL-1 or Myc-NGL-1-S631E were immunoprecipitated using an antibody against Myc and immunoblotted with Myc and PSD95 antibodies (right panel). (b,c) Effect of overexpression of wild-type NGL-1, NGL-1-S631A and NGL-1 S631E on dendritic protrusion density and morphology. Primary hippocampal neurons were transfected with the indicated plasmids at DIV 7 and 7 days later were stained for GFP and Myc. In c, bar graphs show mean ± s.e.m. n = 12 neurons for each (***p<0.001, **p<0.01, t test). n derived from three independent experiments. (d,e) Primary hippocampal neurons were transfected with the indicated plasmids at DIV 7 and were stained for GFP and PSD95 7 days after transfection. In d, arrowheads point to dendritic spines. In e, bar graphs show mean ± s.e.m. n = 10 neurons for each (***p<0.001, t test). n derived from three independent experiments. (f) NGL-1 S631E partially rescues the phenotype of CDKL5 knock-down. Representative images of primary hippocampal neurons transfected at DIV 7 with the indicated plasmids and labeled for GFP at DIV 14. (g) Quantification of dendritic protrusion density and length of sh-control, sh-CDKL5 #1 and sh-CDKL5 #1 plus GFP-NGL-1 S631E transfected neurons. Bar graphs show mean ± s.e.m. n = 12 neurons for each (***p<0.001, **p<0.01, t test). n derives from three independent experiments. Scale bar: 10 μm (b, f), 5 μm (d).
Figure 7
Figure 7
Assessment of pluripotency-associated markers in iPSCs and forebrain identity of iPSC-derived neurons. (a) Bright field images of iPSC colonies in the growing phase. iPSCs express pluripotency markers such as OCT4, SOX2, NANOG and TRA-1-60 and display a H3K27+ inactivated X-chromosome. (b-d) Cultured iPSC-derived neurons were immunolabeled with Tuj1 antibody in combination with either, VGLUT1, VGAT or TH antibodies. (e) Quantification of the mean percent of either VGLUT1, VGAT or TH-positive Tuj1 cells for the neuronal progenies differentiated from 4 different iPSC lines. Bar graphs show mean ± s.e.m. n = 390 neurons (n derived from three independent experiments per line). (f) RT-PCR expression analysis of specific brain area genes. iPSC-derived neurons expressed markers of forebrain identity as Emx1, Tbr1, Ctip2, Cux1, CAMKII and Foxg1. (g) iPCS-derived TuJ1+ neurons express the cortical layers-5 molecular marker Ctip2. (h) Quantification of the mean percent of Ctip2 and Tbr1 expression in TuJ1+ neurons. Bar graphs show mean ± s.e.m. n = 360 neurons (n derived from three independent experiments per line). Scale bar: 100 μm (a, b, c, d), 50 μm (d, g), 10 μm (a, b, c, d).
Figure 8
Figure 8
Patient specific iPSC-derived neurons exhibit normal differentiation rate, but aberrant spine structures. (a) CDKL5 transcripts increased in embryoid bodies and during neuronal differentiation. (b) CDKL5 immunofluorescence showing its localization enriched at the synapses of iPSC-derived neurons. (c,d) Low magnification view of both, affected and healthy iPSC-derived neuronal cultures immunodecorated for MAP2 and TuJ1. (e) Neuronal differentiation rate is not altered in aRTT. n = 250 neurons (n derived from five independent experiments per line), NS = Not significant. (f,g) Representative images of 62 days old WT and aRTT iPSC-derived neurons immunostained for MAP2. (h-k) High magnification images on dendritic tracts of WT and aRTT iPSC-derived neurons processed for VGLUT1/TuJ1 and PSD95/TuJ1 antibody staining. (l,m) Quantitative analysis reveals a reduced number of both, VGLUT1 (h,i) and PSD95 puncta (j,k) in the aRTT compared to WT neurons. Bar graphs show mean ± s.e.m. n = 580 spines. (n derived from five independent experiments per line) (**p<0.01, t test). (n,o) GFP visualization permits to identify aberrant spines with very long and thin appearance in aRTT neurons. (p,q) Aberrant spines in aRTT neurons lack an evident presynaptic terminal as showed by immunofluorescence for synaptophysin (SYT). (r) Quantification of the mean length of dendritic spines in WT and aRTT neurons. Bar graphs show mean ± s.e.m. n = 550 spines (n derived from five independent experiments per line). (**p<0.01, t test). Scale bar: 50 μm (c, f), 20 μm (j), μm (h), 5 μm (n, p).

Similar articles

Cited by

References

    1. Bienvenu T, Chelly J. Molecular genetics of Rett syndrome: when DNA methylation goes unrecognized. Nat. Rev. Genet. 2006;7:415–426. - PubMed
    1. Chahrour M, Zoghbi HY. The story of Rett syndrome: from clinic to neurobiology. Neuron. 2007;56:422–437. - PubMed
    1. Amir RE, Van den Veyver IB, Wan M, Tran CQ, Francke U, Zoghbi HY. Rett syndrome is caused by mutations in X-linked MECP2, encoding methyl-CpG-binding protein 2. Nat. Genet. 1999;23:185–188. - PubMed
    1. Francke U. Mechanisms of disease: neurogenetics of MeCP2 deficiency. Nat. Clin. Pract. Neurol. 2006;2:212–221. - PubMed
    1. Tao J, Van Esch H, Hagedorn-Greiwe M, Hoffmann K, Moser B, Raynaud M, Sperner J, Fryns JP, Schwinger E, Gécz J, et al. Mutations in the X-linked cyclin-dependent kinase-like 5 (CDKL5/STK9) gene are associated with severe neurodevelopmental retardation. Am. J. Hum. Genet. 2004;75:1149–1154. - PMC - PubMed

Publication types

MeSH terms