
Pyruvate kinase M2 activators promote tetramer formation and suppress tumorigenesis

Dimitrios Anastasiou et al. Nat Chem Biol. 2012 Oct.

Erratum in

  • Nat Chem Biol. 2012 Dec;8(12):1008

Abstract

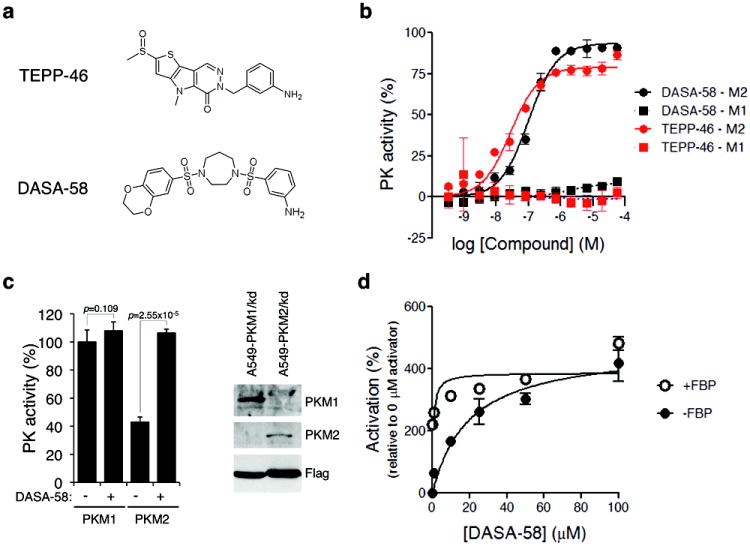
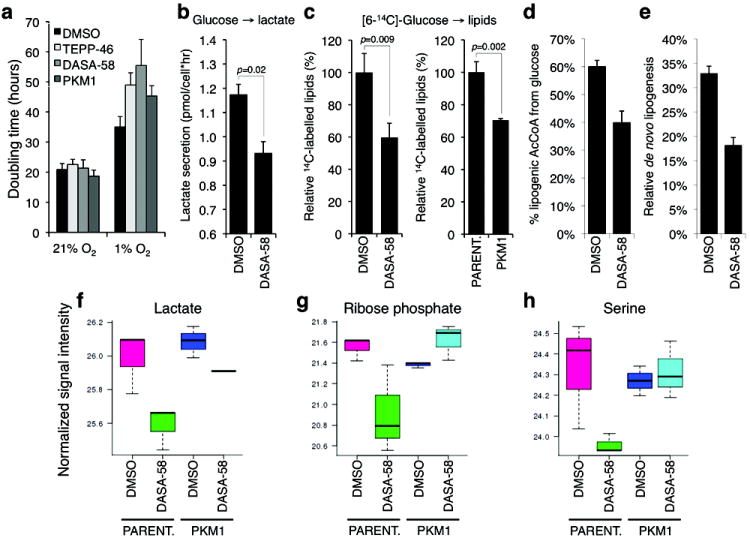
Cancer cells engage in a metabolic program to enhance biosynthesis and support cell proliferation. The regulatory properties of pyruvate kinase M2 (PKM2) influence altered glucose metabolism in cancer. The interaction of PKM2 with phosphotyrosine-containing proteins inhibits enzyme activity and increases the availability of glycolytic metabolites to support cell proliferation. This suggests that high pyruvate kinase activity may suppress tumor growth. We show that expression of PKM1, the pyruvate kinase isoform with high constitutive activity, or exposure to published small-molecule PKM2 activators inhibits the growth of xenograft tumors. Structural studies reveal that small-molecule activators bind PKM2 at the subunit interaction interface, a site that is distinct from that of the endogenous activator fructose-1,6-bisphosphate (FBP). However, unlike FBP, binding of activators to PKM2 promotes a constitutively active enzyme state that is resistant to inhibition by tyrosine-phosphorylated proteins. These data support the notion that small-molecule activation of PKM2 can interfere with anabolic metabolism.


Conflict of interest statement

COMPETING FINANCIAL INTERESTS

L.C.C. is a founder, M.V.H. is a consultant, and A.J., H.Y., C.K., K.E.Y., K.K., F.G.S., S.J. L.D are employed by Agios Pharmaceuticals, a company seeking to target metabolic enzymes for cancer therapy.

Figures

Figure 1
Figure 1. PKM1 expression in cancer cells impairs xenograft tumor growth
(a) H1299 human lung cancer cells were infected with a retrovirus to stably express Flag-PKM1 (referred to as H1299-PKM1 cells in the text) or empty vector (Parental) and after selection, cells were lysed and pyruvate kinase activity in the lysates was assayed. (b) Tumor formation over time of parental or H1299-PKM1 cells generated as in (a) and injected subcutaneously at equal numbers in nu/nu mice [p value calculated by logrank (Mantel-Cox) test]. (c) Final tumor weights from the experiment in (b). Mean tumor weights ± s.e.m. are shown and p value was calculated by unpaired Student’s t-test. (d) Expression of Flag-PKM1 and endogenous PKM2 in the cells used in (b) and (c) was determined by western blot with isoform-specific antibodies. Uncropped blots are shown in Supplementary Fig. 10. (e) Pyruvate kinase activity assays in lysates of the tumors shown in (d) (N=3, 1-way ANOVA and Tukey’s post-test).
Figure 2
Figure 2. TEPP-46 and DASA-58 isoform specificity in vitro and in cells
(a) Structures of the PKM2 activators TEPP-46 and DASA-58 used in this study (b) Purified recombinant human PKM1 or PKM2 expressed in bacteria were subjected to pyruvate kinase activity assays in the presence of increasing concentrations of TEPP-46 or DASA-58. (c) A549 cells were engineered to stably express Flag-PKM1 or Flag-PKM2 in the absence of endogenous PKM2 which was knocked down by shRNA. As the PKM1 and PKM2 cDNAs correspond to the mouse orthologues, their expression was resistant to knockdown. Expression of Flag-PKM1 and Flag-PKM2 was confirmed by western blot with isoform-specific antibodies (right panel). These cell lines were then treated with 40 μM DASA-58 for 3 hours and the respective lysates were assayed for pyruvate kinase activity (N=3, Student’s t-test). Similar results were observed in H1299 cells (not shown). Uncropped blots are shown in Supplementary Fig. 10. (d) A549 cells were treated with the indicated doses of DASA-58 for 3 hours, lysed and assayed for pyruvate kinase activity in the presence or absence of 200 μM FBP.
Figure 3
Figure 3. Activators promote PKM2 tetramer formation and prevent inhibition by pTyr signaling
(a) Sucrose gradient ultracentrifugation profiles of purified recombinant PKM2 and effects of FBP and TEPP-46 on PKM2 subunit stoichiometry. Recombinant PKM2 was transiently exposed to FBP prior to addition of TEPP-46. After centrifugation, fractions were collected, analyzed by SDS-PAGE and stained with Coomassie Blue. Relative protein amounts were calculated by band densitometry on a LiCOR Odyssey infrared imaging system. (b) A549 cells were treated with 100 μM pervanadate for 10 min. in the presence or absence of TEPP-46, lysed hypotonically, and were analyzed by size exclusion chromatography. Chromatographic fractions were then subjected to western blotting with a pyruvate kinase antibody to assess the stoichiometry of PKM2 subunit association under these conditions. Uncropped blots are shown in Supplementary Fig. 10. (c) Pyruvate kinase activity assays in A549 cells treated with pervanadate as in (b) in the presence of DMSO, 1 μM TEPP-46 or 1 μM DASA-58 (N=3, p=0.0044 by 2-way ANOVA).
Figure 4
Figure 4. Structural analysis of PKM2 activator mode of action
(a) Interaction between tetrameric PKM2 and TEPP-46. The four PKM2 monomers are represented in cartoon mode with different colors, respectively. The bound FBP and the activator molecules are colored black and red, respectively, and shown as space-filling models. The interfaces between two monomers are indicated by dotted lines. (b) Interaction between TEPP-46 and surrounding residues. The bound activator is colored yellow and represented by ball and stick model. The residues involved in the interaction from two monomers are labeled and colored green and cyan, respectively. Hydrogen bonds are indicated by blue dotted lines with distance (Å). (c) DASA-58 stabilizes the interaction of Flag-PKM2(K305Q) with endogenous PKM2. Flag-PKM2(K305Q) stably expressed in A549 cells was immunoprecipitated from corresponding lysates and the levels of co-precipitating endogenous PKM2 were assessed by western blotting with a PKM2 antibody. Uncropped blots are shown in Supplementary Fig. 10.
Figure 5
Figure 5. Metabolic effects of cell treatment with PKM2 activators
(a) Effects of TEPP-46, DASA-58 (both used at 30 μM), or PKM1 expression on the doubling time of H1299 cells under normoxia (21% O2) or hypoxia (1% O2). (b) Effects of DASA-58 on lactate production from glucose. Logarithmically growing H1299 cells were washed with Krebs buffer and incubated in Krebs buffer containing glucose in the presence of 50 μM DASA-58 (N=3, Student’s t-test). Produced lactate in the incubation medium was assayed after 20 min. as described in Methods. (c) Logarithmically growing H1299 cells (left), or parental H1299 and H1299-PKM1 cells (right) were incubated for 2 hours with 4 μCi/ml [6-14C]-glucose in the presence of DMSO or 30 μM DASA-58, cellular lipids were extracted and lipid-incorporated 14C was quantified by scintillation counting. (d) Contribution of [U-13C6]glucose to the lipogenic AcCoA pool, and fractional new synthesis of palmitate (e) were determined by isotopomer spectral analysis in A549 cells treated with DMSO or 100 μM DASA-58. Error bars indicate 95% confidence intervals. (f-h) Intracellular concentrations of lactate, ribose phosphate and serine in parental H1299 or H1299-PKM1 cells treated with DMSO or 25 μM of TEPP-46 for 36 hours were determined by targeted LC-MS/MS.
Figure 6
Figure 6. PKM2 activators impair xenograft growth
(a) Mice bearing H1299 xenograft tumors received bolus doses of TEPP-46 at 50 mg/kg 16 hours and 4 hours before sacrifice. Tumors were dissected and PKM2 complex stoichiometry in tumor lysates was determined by size exclusion chromatography. Uncropped blots are shown in Supplementary Fig. 10. (b) Concentrations of lactate, ribose phosphate and serine in H1299 xenograft tumors from mice treated with vehicle or TEPP-46 as in (a). (c) H1299 cells were injected subcutaneously into nu/nu mice which were subsequently randomly divided into two cohorts, one given vehicle and the other TEPP-46 at 50 mg/kg twice-daily throughout the duration of the experiment. Injection sites were monitored for tumor emergence [p value calculated by logrank (Mantel-Cox) test]. After 52 days, the tumors were dissected and final tumor weights were measured (d). Mean tumor weights ± s.e.m. are shown and p value was calculated by unpaired Student’s t-test.

References

    1. Tennant DA, Duran RV, Gottlieb E. Targeting metabolic transformation for cancer therapy. Nat Rev Cancer. 2010;10:267–77. - PubMed
    1. Vander Heiden MG. Targeting cancer metabolism: a therapeutic window opens. Nat Rev Drug Discov. 2011;10:671–84. - PubMed
    1. Vander Heiden MG, Cantley LC, Thompson CB. Understanding the Warburg effect: the metabolic requirements of cell proliferation. Science. 2009;324:1029–33. - PMC - PubMed
    1. Cairns RA, Harris IS, Mak TW. Regulation of cancer cell metabolism. Nat Rev Cancer. 2011;11:85–95. - PubMed
    1. Levine AJ, Puzio-Kuter AM. The control of the metabolic switch in cancers by oncogenes and tumor suppressor genes. Science. 2010;330:1340–4. - PubMed

Publication types