. 2012 Oct 1;189(7):3600-8.
doi: 10.4049/jimmunol.1201525. Epub 2012 Aug 24.

Molecular and cellular mechanisms of Mycobacterium avium-induced thymic atrophy

Affiliations

Molecular and cellular mechanisms of Mycobacterium avium-induced thymic atrophy

Margarida Borges et al. J Immunol. .

Abstract

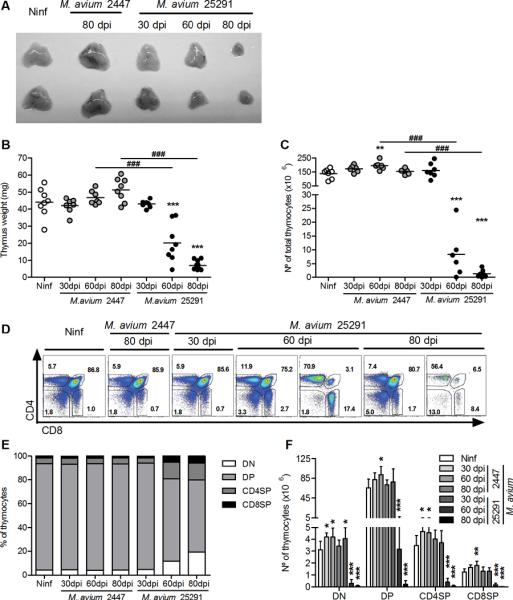
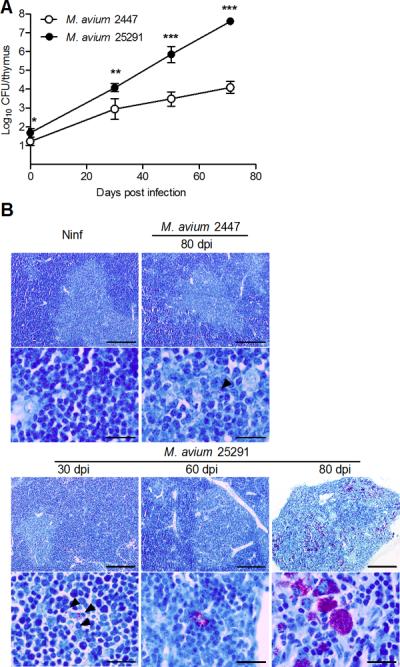
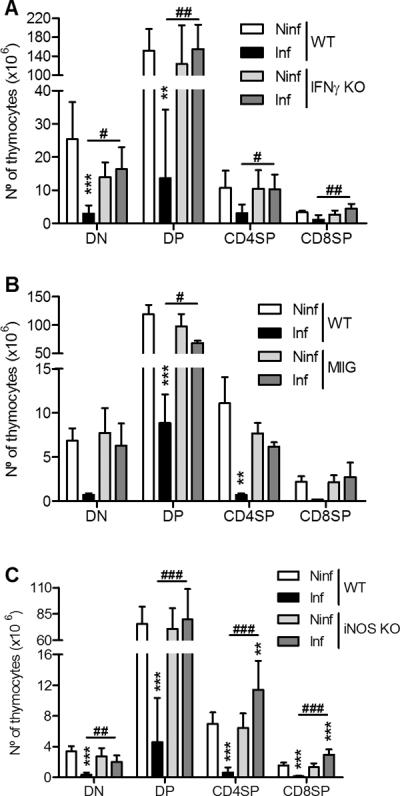
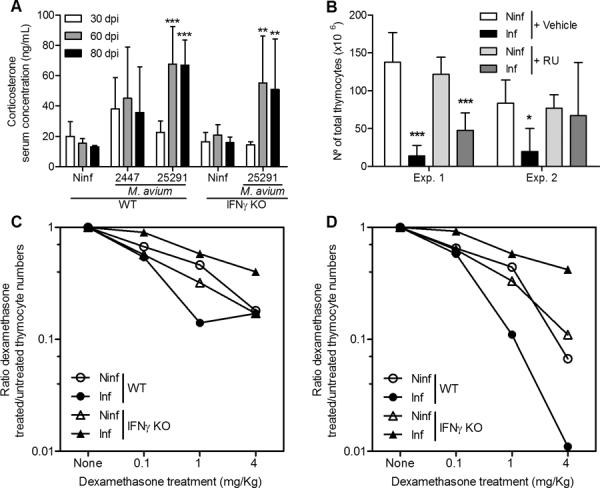
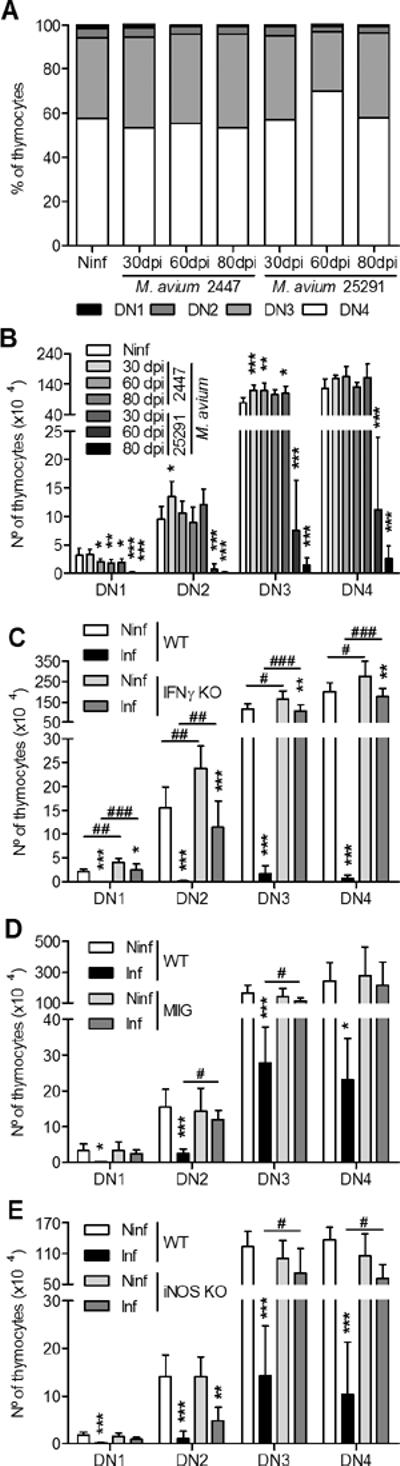
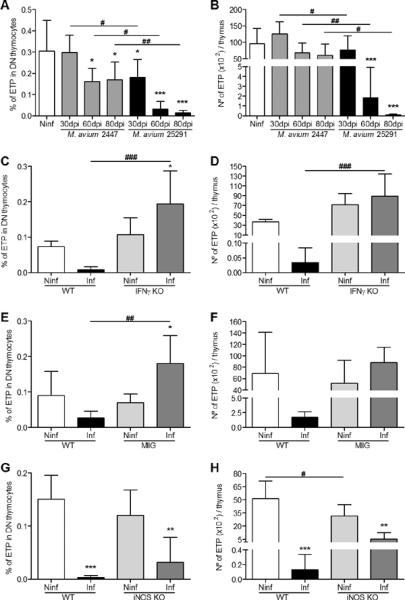
Thymic atrophy has been described as a consequence of infection by several pathogens and shown to be induced through diverse mechanisms. Using the mouse model of Mycobacterium avium infection, we show in this study that the production of NO from IFN-γ-activated macrophages plays a major role in mycobacterial infection-induced thymic atrophy. Our results show that disseminated infection with a highly virulent strain of M. avium, but not with a low-virulence strain, led to a progressive thymic atrophy. Thymic involution was prevented in genetically manipulated mice unable to produce IFN-γ or the inducible NO synthase. In addition, mice with a selective impairment of IFN-γ signaling in macrophages were similarly protected from infection-induced thymic atrophy. A slight increase in the concentration of corticosterone was found in mice infected with the highly virulent strain, and thymocytes presented an increased susceptibility to dexamethasone-induced death during disseminated infection. The administration of an antagonist of glucocorticoid receptors partially reverted the infection-induced thymic atrophy. We observed a reduction in all thymocyte populations analyzed, including the earliest thymic precursors, suggesting a defect during thymic colonization by T cell precursors and/or during the differentiation of these cells in the bone marrow in addition to local demise of thymic cells. Our data suggest a complex picture underlying thymic atrophy during infection by M. avium with the participation of locally produced NO, endogenous corticosteroid activity, and reduced bone marrow seeding.


Figures

Figure 1
Figure 1
Infection with the highly virulent M. avium strain 25291 but not with the low virulence strain 2447 induces strong thymus atrophy. A. Photographs of thymi from uninfected WT mice (Ninf) and WT mice infected with M. avium strains 2447 or 25291 at the indicated time-points (in days post-infection, dpi). B, C. Thymus weight and number of thymocytes from control non-infected (Ninf) mice and animals infected with strains 2447 or 25291. D. Representative plots of anti-CD4 and anti-CD8 staining of thymi from control non-infected (Ninf) mice and mice infected with strains 2447 or 25291. The numbers indicate the percentage of cells in each region. E, F. Percentage and number of thymic populations from control non-infected (Ninf) mice and animals infected with strains 2447 or 25291. Data represent the mean of the percentages or the mean and standard deviation of the numbers of cells. Each group of non-infected mice comprised three to four animals and each group of infected mice comprised seven animals analysed individually and data presented represents one experiment out of three. Statistically significant differences between infected and non-infected (Ninf) mice are labeled as *p<0.05, **p<0.01, ***p<0.001. Statistically significant differences between infected groups are labeled as ###p<0.001.
Figure 2
Figure 2
Infection with M. avium strain 25291 leads to higher bacterial loads in the thymus as compared with strain 2447. A. Representative kinetics of M. avium infection of the thymus from WT mice inoculated with strains 2447 or 25291. Data represent the mean and standard deviation of CFU from five mice per group from one out of three experiments. Statistically significant differences between mice infected with strains 2447 and 25291 are labeled as *p<0.05, **p<0.01, *** p<0.001. B. Representative thymic sections from non-infected mice (Ninf) and mice infected with strains 2447 or 25291 stained for acid-fast bacteria (Ziehl-Neelsen method). Scale bars represent 200 μm in the low-power views and 20 μm in the high magnification pictures. Arrowheads indicate acid fast bacteria in cases of low infection burden.
Figure 3
Figure 3
Thymus atrophy depends on IFNγ production, IFNγ-dependent macrophage activation and nitric oxide production. A. Number of cells of the thymic populations from WT or IFNγ-KO mice, either non-infected (Ninf) or infected with M. avium 25291 at 75 dpi. B. Number of cells of the thymic populations from WT or MIIG transgenic mice, either non-infected (Ninf) or infected with M. avium 25291 at 80 dpi. C. Number of cells of the thymic populations from WT or iNOS-KO mice, either non-infected (Ninf) or infected with M. avium 25291 at 80 dpi. Data represent the mean and standard deviation of the numbers of cells. Each group of mice comprised three to seven animals analyzed individually. Data shown represents one out of three experiments. Statistically significant differences between infected and non-infected mice are labeled as **p<0.01, ***p<0.001. Statistically significant differences between infected groups are labeled as #p<0.05, ##p<0.01, ###p<0.001.
Figure 4
Figure 4
Glucocorticoids are involved in the induction of thymus atrophy during infection with M. avium strain 25291. A. Representative kinetics of serum corticosterone levels in WT mice infected with M. avium 25291 or 2447 as compared to non-infected (Ninf) mice or of IFNγ-KO mice infected with strain 25291 versus non-infected (Ninf). B. Number of thymocytes from non-infected (Ninf) mice and mice infected for 75 days with M. avium 25291 and treated with either vehicle or RU486 (RU). Data represent the mean and standard deviation of values obtained from six to eight mice in each group analyzed individually and represents two independent experiments. Statistically significant differences between infected and non-infected mice are labeled as *p <0.05, **p <0.01 ***p <0.001. C, D. Decrease of total (C) and DP (D) thymocytes after dexamethasone treatment of non-infected (Ninf) or M. avium 25291-infected animals of either WT or IFNγ-KO strains. Data represent the ratio between the cell numbers in dexamethasone-treated animals and the cell numbers in PBS-treated animals, i.e. the fraction of cells remaining after dexamethasone treatment.
Figure 5
Figure 5
Infection with M. avium strain 25291 induces depletion of all subpopulations of DN thymocytes which depends on IFNγ production, IFNγ-dependent macrophage activation and NO production. A, B. Percentage and number of DN thymic subpopulations from non-infected (Ninf) mice and mice infected with strains 2447 or 25291. C. Number of DN thymic subpopulations from WT and IFNγ-KO mice, either non-infected (Ninf) or infected with M. avium 25291 at 80 dpi. D. Number of DN thymic subpopulations from WT and MIIG mice, either non-infected (Ninf) or infected with M. avium 25291 at 80 dpi. E. Number of DN thymic subpopulations from WT and iNOS-KO mice, either non-infected (Ninf) or infected with M. avium 25291 at 80 dpi. Data represent the mean and standard deviation of the number of cells. Each group of mice comprised three to six animals analyzed individually. Data shown represents one experiment out of three. Statistically significant differences between infected and control mice are labeled as *p<0.05, **p<0.01, ***p<0.001. Statistically significant differences between infected groups are labeled as #p<0.05, ##p<0.01, ###p<0.001.
Figure 6
Figure 6
Infection with M. avium 25291 induces depletion of the early thymocyte precursors and depends on IFNγ production, IFNγ-dependent macrophage activation and NO production. A, B. Percentage (A) and number (B) of ETP from non-infected (Ninf) thymi and from thymi of WT mice infected with M. avium strains 2447 or 25291. C, D. Percentage (C) and number (D) of ETP from non-infected (Ninf) thymi and from thymi of WT or IFNγ-KO mice infected with M. avium 25291 at 80 dpi. E, F. Percentage (E) and number (F) of ETP from non-infected (Ninf) thymi and from thymi of WT or MIIG mice infected with M. avium 25291 at 80 dpi. G, H. Percentage (G) and number (H) of ETP from non-infected (Ninf) thymi and from thymi of WT or iNOS-KO mice infected with M. avium 25291 at 80 dpi. Data represent the mean of the percentages or the mean and standard deviation of the number of cells. Each group of mice comprised three to six animals analysed individually. Data shown represents one experiment out of three. Statistically significant differences between infected and non-infected control mice are labeled as *p<0.05, **p<0.01, ***p<0.001. Statistically significant differences between infected groups are labeled as #p<0.05, ##p<0.01, ###p<0.001.

Similar articles

Cited by

References

    1. Savino W. The thymus is a common target organ in infectious diseases. PLoS Pathogens. 2006;2:472–83. - PMC - PubMed
    1. Lynch HE, Goldberg GL, Chidgey A, Van den Brink MR, Boyd R, Sempowski GD. Thymic involution and immune reconstitution. Trends Immunol. 2009;30:366–73. - PMC - PubMed
    1. Vigano A, Vella S, Saresella M, Vanzulli A, Bricalli D, Di Fabio S, Ferrante P, Andreotti M, Pirillo M, Dally LG, Clerici M, Principi N. Early immune reconstitution after potent antiretroviral therapy in HIV-infected children correlates with the increase in thymus volume. AIDS. 2000;14:251–61. - PubMed
    1. Kalayjian RC, Spritzler J, Pu M, Landay A, Pollard RB, Stocker V, Harthi LA, Gross BH, Francis IR, Fiscus SA, Tebas P, Bosch RJ, Valcour V, Lederman MM. Distinct mechanisms of T cell reconstitution can be identified by estimating thymic volume in adult HIV-1 disease. J Infect Dis. 2005;192:1577–87. - PubMed
    1. Smith KY, Valdez H, Landay A, Spritzler J, Kessler HA, Connick E, Kuritzkes D, Gross B, Francis I, McCune JM, Lederman MM. Thymic size and lymphocyte restoration in patients with human immunodeficiency virus infection after 48 weeks of zidovudine, lamivudine, and ritonavir therapy. J Infect Dis. 2000;181:141–7. - PubMed

Publication types

MeSH terms

Substances