Comparative Study
. 2012 Oct 1;189(7):3462-71.
doi: 10.4049/jimmunol.1201305. Epub 2012 Aug 24.

The molecular signature of tissue resident memory CD8 T cells isolated from the brain

Affiliations
Comparative Study

The molecular signature of tissue resident memory CD8 T cells isolated from the brain

Linda M Wakim et al. J Immunol. .

Abstract

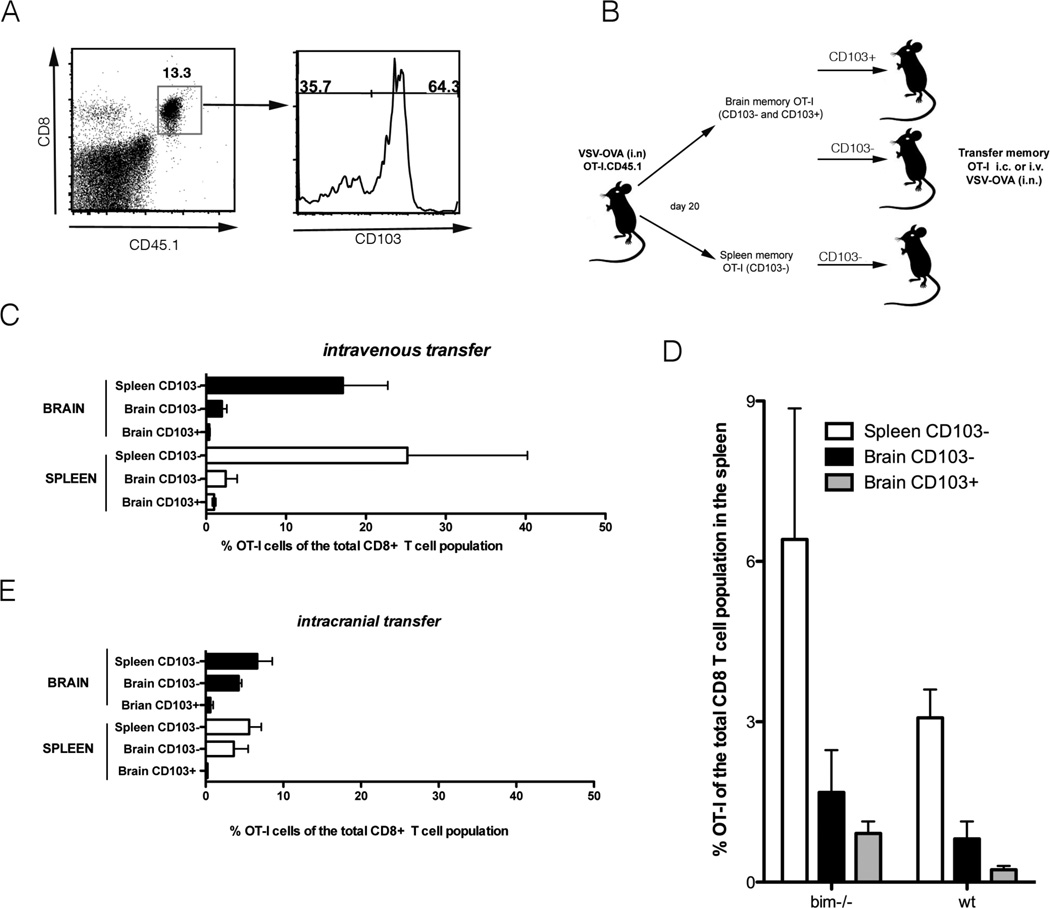
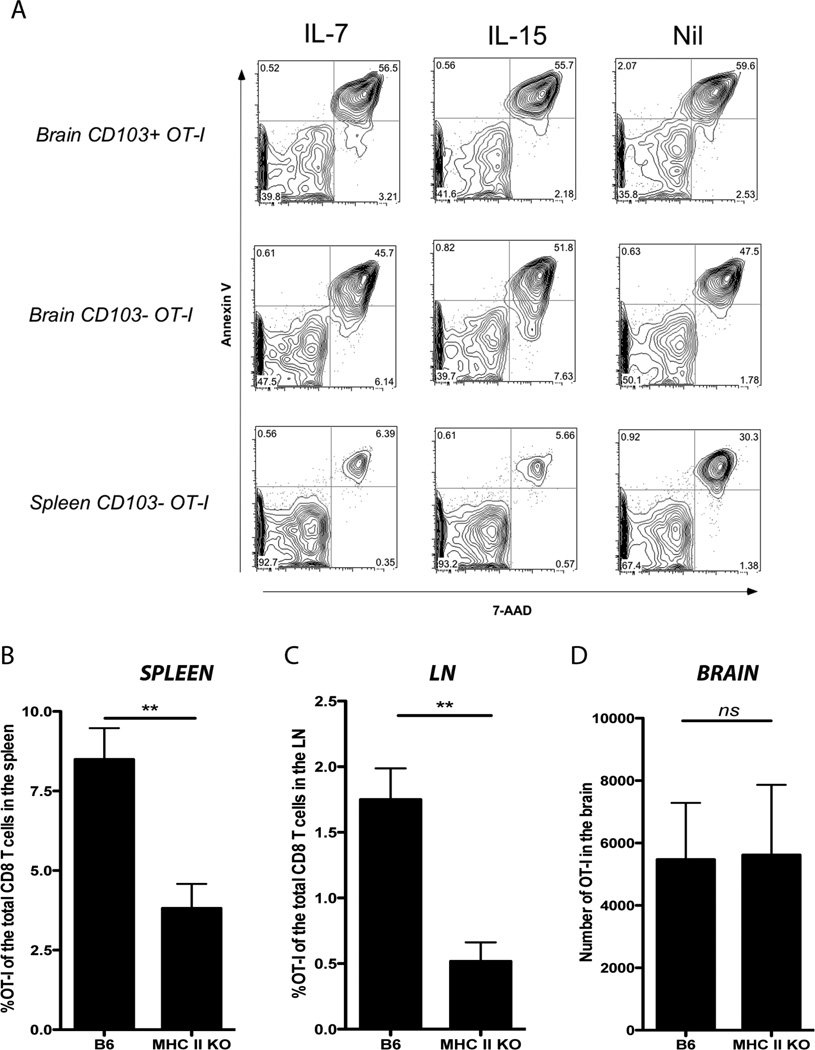
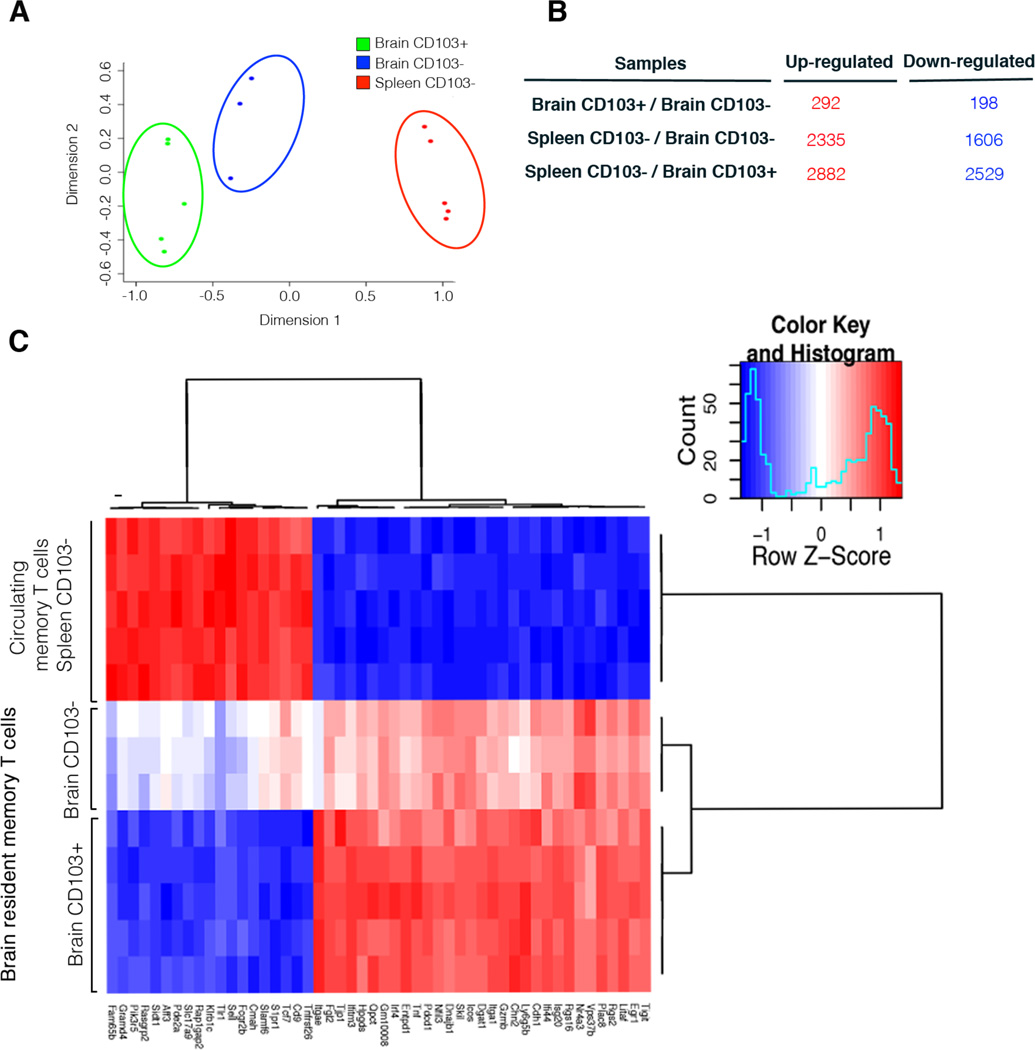
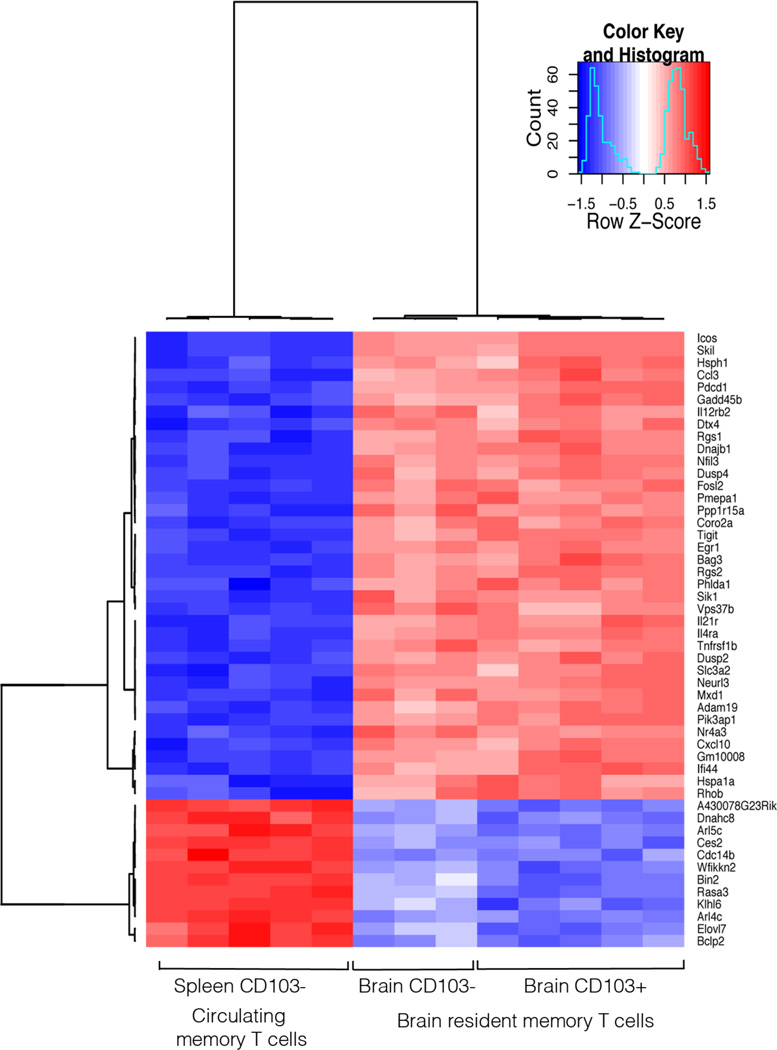
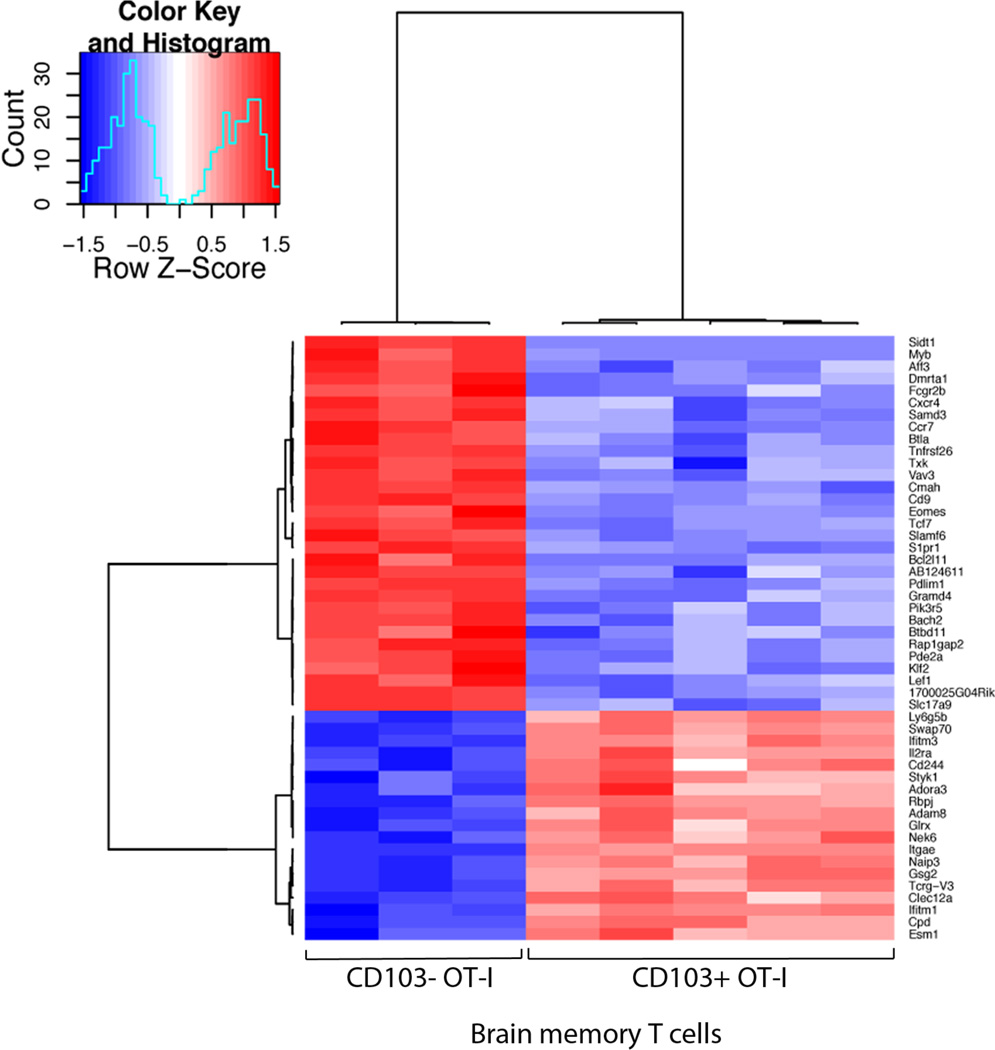
Tissue resident memory (Trm) CD8 T cells represent a newly described memory T cell population. We have previously characterized a population of Trm cells that persists within the brain after acute virus infection. Although capable of providing marked protection against a subsequent local challenge, brain Trm cells do not undergo recall expansion after dissociation from the tissue. Furthermore, these Trm cells do not depend on the same survival factors as the circulating memory T cell pool as assessed either in vivo or in vitro. To gain greater insight into this population of cells, we compared the gene expression profiles of Trm cells isolated from the brain with those of circulating memory T cells isolated from the spleen after an acute virus infection. Trm cells displayed altered expression of genes involved in chemotaxis, expressed a distinct set of transcription factors, and overexpressed several inhibitory receptors. Cumulatively, these data indicate that Trm cells are a distinct memory T cell population disconnected from the circulating memory T cell pool and display a unique molecular signature that likely results in optimal survival and function within their local environment.


Figures

Figure 1
Figure 1. Resident memory T cells do not undergo recall expansion following dissociation from the tissue in which they reside
Mice were seeded with OT-I.CD45.1 T cells before i.n. infection with VSV-OVA. On day 20 p.i., OT-I cells were recovered from the brain and spleen of mice, sorted into CD103+ and CD103, and adoptively transferred into naïve recipient mice that were challenged with VSV-OVA (i.n.) (A) Representative flow cytometry profile of brain on day 20 p.i. demonstrating the OT-I.CD103+ and OT-I.CD103− subsets. (B) Schematic diagram representing the experimental setup (C) The proportion of OT-I of the total CD8+ T cell population in the brain and spleen on day 8 p.i. following intravenous transfer of memory T cells. Data represents the mean + SEM (n = 3–5) and data is pooled from 2 independent experiments. (D) Mice were seeded with either bim−/− OT-I.CD45.1 or wild type (wt) OT-I T cells before i.n. infection with VSV-OVA. On day 20 p.i., OT-I cells were recovered from the brain and spleen of mice, sorted into CD103+ and CD103, and adoptively transferred (i.v.) into naïve recipient mice that were challenged with VSV-OVA (i.n.). Depicted is the proportion of OT-I of the total CD8+ T cell population in the spleen on day 8 p.i. Data represents the mean + SEM (n = 4–8) and data is pooled from 2 independent experiments. (E) As described in part C except memory T cells were transferred intracranially prior to i.n. challenge with VSV-OVA.
Figure 2
Figure 2. Brain memory T cells do not depend on the same survival factors as circulating memory T cells in vitro or in vivo
(A) Mice were seeded with OT-I.CD45.1 T cells before i.n. infection with VSV-OVA. On day 20 p.i., memory OT-I.CD103+ and CD103 cells were sorted from the brain and spleen of mice and cultured in vitro overnight in the presence of IL-7 or IL-15. Cells were stained with Annexin V and 7-AAD, and the percentage of dead cells (Annexin V+/− and 7-AAD+) was determined by flow cytometry. (B) Mice (either B6 or MHC class II KO) were seeded with OT-I.CD45.1 T cells before i.n. infection with VSV-OVA. Graphs depict the percentage or number of OT-I cells of the total CD8 T cell population in the spleen, lymph node (LN) and brain on day 60 p.i. Bars represent the mean + SEM (n= 9–17). Data is pooled from 4 independent experiments [P < 0.05, student t test].
Figure 3
Figure 3. Resident memory T cells within the brain can provide protection against local infection
Mice were seeded with OT-I.CD45.1 T cells before intranasal (i.n.) or intraperitoneal (i.p) infection with VSV-OVA. On day 20 p.i. mice were challenged intracranially with LM-OVA. The proportion of OT-I T cells of the total CD8+ T cell population in the (A) spleen and (B) lymph node and (C) the number of OT-I CD8 T cells in the brain on day 20 p.i. Bars represent the mean + SEM (n = 6) data is representative of 2 independent experiments. (D) Survival (measured as a loss of > 20% of starting weight) of animals primed either i.p or i.n. with VSV-OVA and challenged i.c. with LM-OVA. Shown is the mean + SEM (n = 15). Data is pooled from 3 independent experiments.
Figure 4
Figure 4. Brain resident memory T cells have a different molecular signature compared to circulating memory T cells
(A) A MDS plot depicting the relationship between Brain CD103+, Brain CD103− and Spleen CD103− OT-I T cell populations. Distances between samples represent leading fold change, the average log2-fold change between the 500 genes with largest differences. (B) Number of genes differentially expressed between brain resident and splenic memory T cells (FDR < 0.05). (C) Heatmap of expression profiles (normalized log2-intensities) of Brain OT-I.CD103+, Brain OT-I CD103− and Spleen OT-I.CD103− memory T cells. Heatmap shows the 50 genes with the most significant difference between the cell populations.
Figure 5
Figure 5. Heatmap of Brain memory OT-I signature genes
Microarray analysis of Brain OT-I.CD103+, Brain OT-I CD103− and Spleen OT-I.CD103− memory T cells presented as a heatmap of the 50 genes that have the greatest difference in expression when comparing Brain (both CD103+ and CD103−) to Spleen populations (presented as normalized log2-intensities).
Figure 6
Figure 6. Gene expression profile comparing Brain CD103+ and Brain CD103− resident memory T cells
Microarray analysis of Brain OT-I.CD103+ and Brain OT-I CD103− memory T cells presented as a heatmap of the 50 genes with the greatest difference in expression (presented as normalized log2-intensities)

References

    1. Masopust D, Vezys V, Marzo AL, Lefrancois L. Preferential localization of effector memory cells in nonlymphoid tissue. Science. 2001;291:2413–2417. - PubMed
    1. Sallusto F, Lenig D, Forster R, Lipp M, Lanzavecchia A. Two subsets of memory T lymphocytes with distinct homing potentials and effector functions. Nature. 1999;401:708–712. - PubMed
    1. Marshall DR, Turner SJ, Belz GT, Wingo S, Andreansky S, Sangster MY, Riberdy JM, Liu T, Tan M, Doherty PC. Measuring the diaspora for virus-specific CD8+ T cells. Proc Natl Acad Sci U S A. 2001;98:6313–6318. - PMC - PubMed
    1. Gebhardt T, Wakim LM, Eidsmo L, Reading PC, Heath WR, Carbone FR. Memory T cells in nonlymphoid tissue that provide enhanced local immunity during infection with herpes simplex virus. Nat Immunol. 2009;10:524–530. - PubMed
    1. Khanna KM, Bonneau RH, Kinchington PR, Hendricks RL. Herpes simplex virus-specific memory CD8+ T cells are selectively activated and retained in latently infected sensory ganglia. Immunity. 2003;18:593–603. - PMC - PubMed

Publication types

MeSH terms

Associated data