. 2013 Apr;5(2):99-110.
doi: 10.1093/jmcb/mjs052. Epub 2012 Aug 24.

Reduced DEAF1 function during type 1 diabetes inhibits translation in lymph node stromal cells by suppressing Eif4g3

Affiliations

Reduced DEAF1 function during type 1 diabetes inhibits translation in lymph node stromal cells by suppressing Eif4g3

Linda Yip et al. J Mol Cell Biol. 2013 Apr.

Abstract

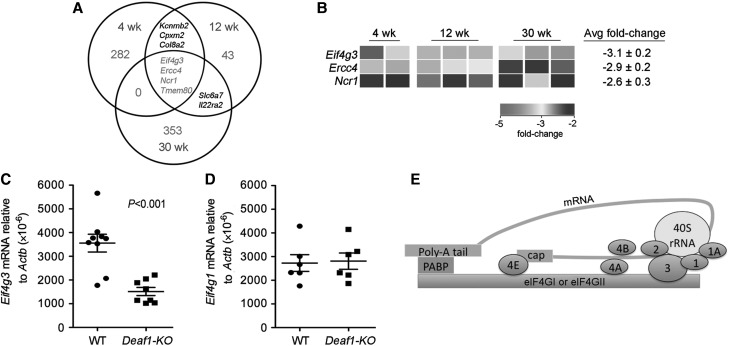
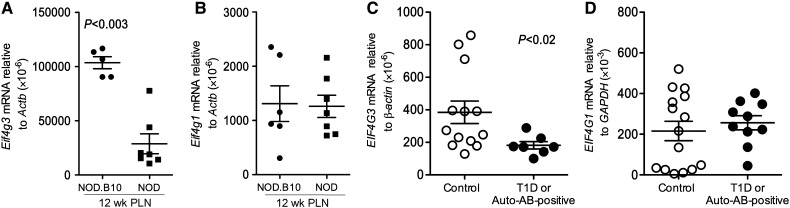
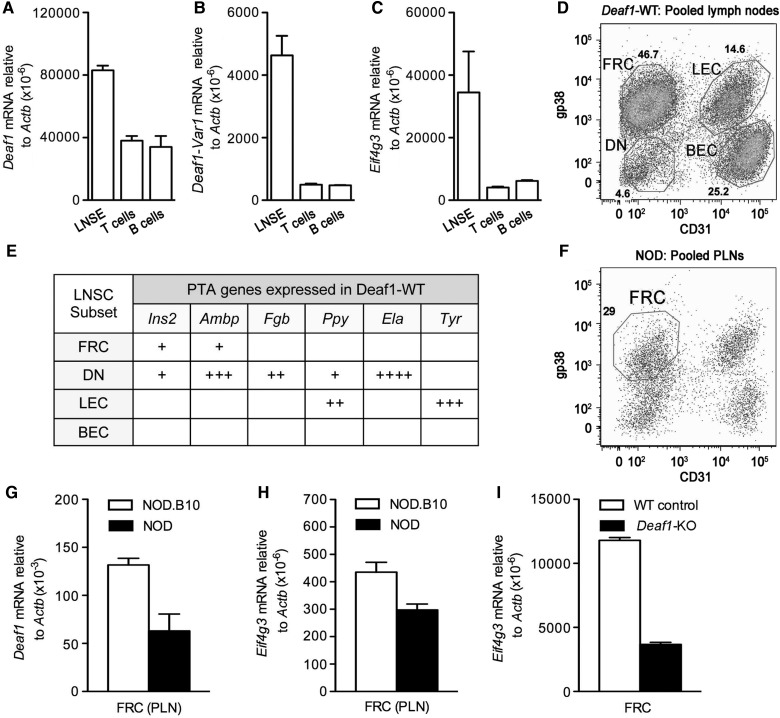
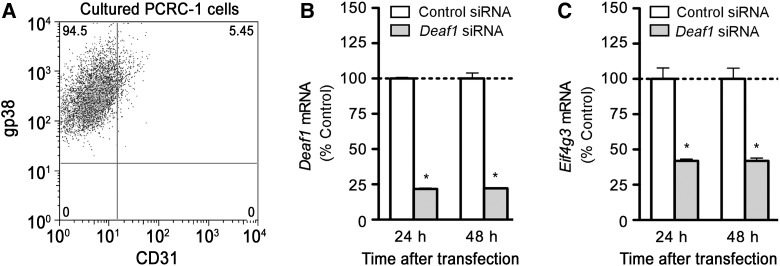
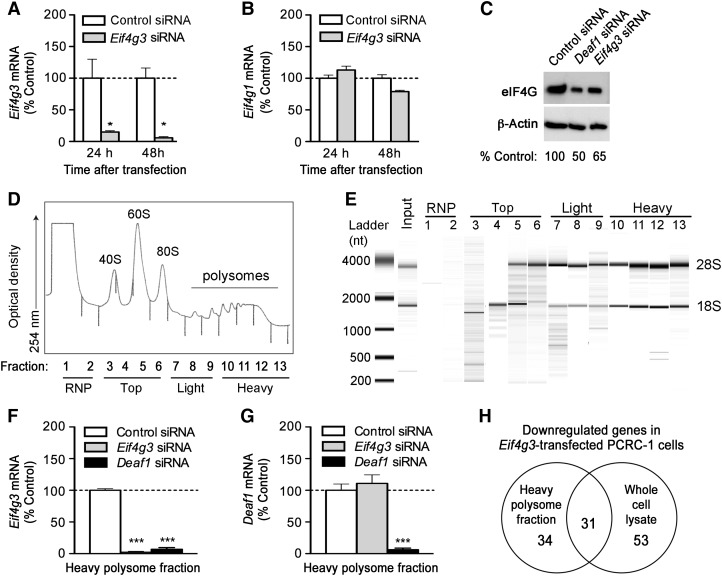
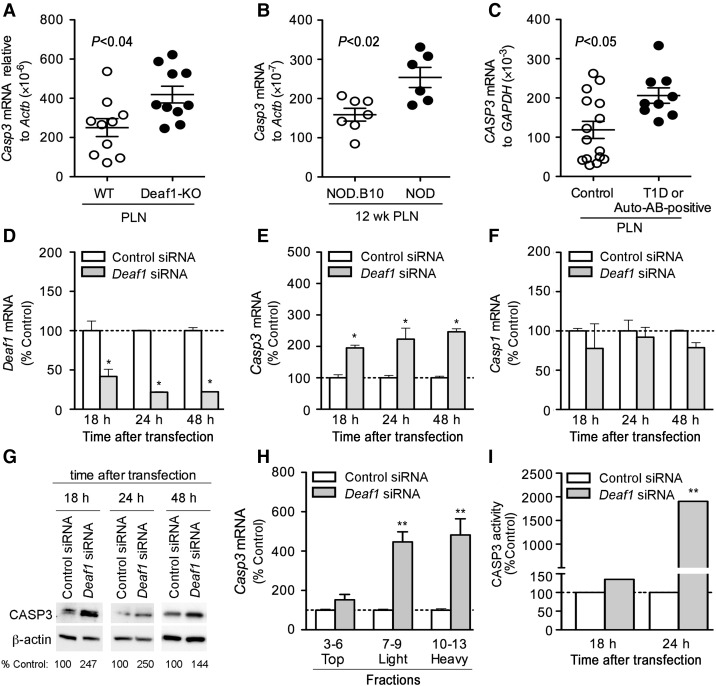
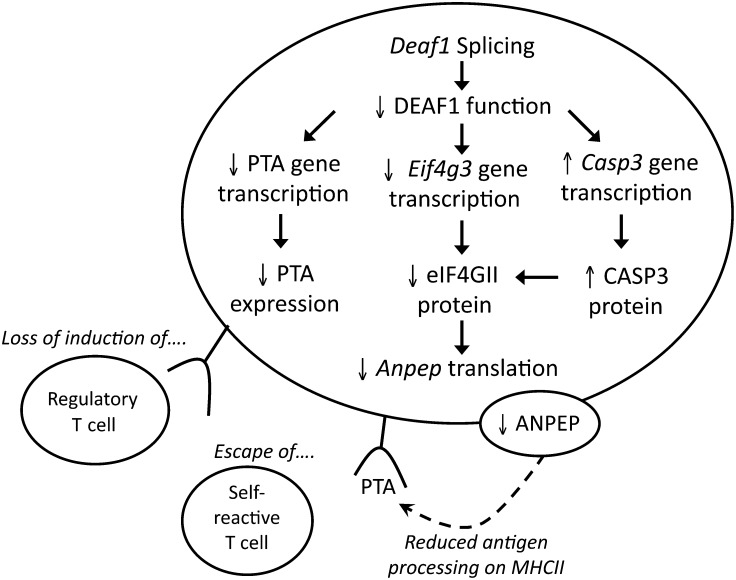
The transcriptional regulator deformed epidermal autoregulatory factor 1 (DEAF1) has been suggested to play a role in maintaining peripheral tolerance by controlling the transcription of peripheral tissue antigen genes in lymph node stromal cells (LNSCs). Here, we demonstrate that DEAF1 also regulates the translation of genes in LNSCs by controlling the transcription of the poorly characterized eukaryotic translation initiation factor 4 gamma 3 (Eif4g3) that encodes eIF4GII. Eif4g3 gene expression was reduced in the pancreatic lymph nodes of Deaf1-KO mice, non-obese diabetic mice, and type 1 diabetes patients, where functional Deaf1 is absent or diminished. Silencing of Deaf1 reduced Eif4g3 expression, but increased the expression of Caspase 3, a serine protease that degrades eIF4GII. Polysome profiling showed that reduced Eif4g3 expression in LNSCs resulted in the diminished translation of various genes, including Anpep, the gene for aminopeptidase N, an enzyme involved in fine-tuning antigen presentation on major histocompatibility complex (MHC) class II. Together these findings suggest that reduced DEAF1 function, and subsequent loss of Eif4g3 transcription may affect peripheral tissue antigen (PTA) expression in LNSCs and contribute to the pathology of T1D.


Figures

Figure 1
Figure 1
Eif4g3 gene expression is down-regulated in the PLNs of Deaf1-KO mice. (A) Venn diagram showing the number of genes down-regulated by ≥2-fold in the PLNs of 4, 12, and 30-week old Deaf1-KO mice vs. age-matched controls (4-week old, n = 2 per group; 12 and 30-week old, n = 3 mice per group), as measured by two-color microarray analysis. Multiple probes for the same gene and unknown genes have been omitted from the regions of overlap. (B) Heatmap image showing changes in Eif4g3, Ercc4, and Ncr1 gene expression in individual Deaf1-KO mice compared with age-matched WT controls. qPCR data showing reduced expression of Eif4g3 (C) and no change in expression of Eif4g1 (D) in the PLNs of Deaf1-KO mice compared with littermate controls (n ≥ 6 mice per group, two-tailed Mann–Whitney test). Eif4g1 encodes for eIF4GI, a homolog of eIF4GII. (E) A schematic diagram showing eIF4GI or eIFGII in the 48S translation pre-initiation complex. eIF4GI and eIF4GII (encoded by Eif4g3) can act as the scaffold for the poly (A)-binding protein (PABP) and other members of the eIF family (shown in blue). The 5′ cap and poly-A tail of the mRNA strand (green) binds to eIF4E and PABP, respectively.
Figure 2
Figure 2
Eif4g3 mRNA expression is reduced in the PLNs of 12-week-old NOD mice and T1D patients. qPCR data showing reduced Eif4g3 (A) and no change in Eif4g1 (B) expression in the PLN of 12-week-old NOD compared with NOD.B10 mice. qPCR data showing reduced EIF4G3 expression (C) and no change in EIF4G1 (D) expression in the PLNs of T1D/auto-antibody (AB)-positive patients (n ≥ 7) compared with non-disease controls (n ≥ 13). See Supplementary Table S2 for patient information. P-values are indicated on graphs, and determined using the two-tailed Mann–Whitney test. See also Supplementary Figure S1.
Figure 3
Figure 3
Deaf1, Eif4g3, and Ins2 are expressed predominantly in the fibroblastic reticular cell (FRC) subset of LNSCs in the PLNs. qPCR data showing the gene expression of Deaf1 (A), Deaf1-Var1 (B), and Eif4g3 (C) in LNSE, T cells, and B cells isolated from the PLNs of 12-week-old NOD mice (n = 3, mean ± SEM). (D) A representative FACS plot showing the expression of the surface markers, gp38 and CD31, in four distinct cellular subsets of LNSCs (FRC, fibroblastic reticular cells; LEC, lymphatic endothelial cells; DN, double negatives; and BEC, blood endothelial cells) isolated from the pooled lymph nodes (cervical, inguinal, mesenteric, axiliary, brachial, and pancreatic lymph nodes) of three Deaf1-WT mouse. (E) Each LNSC subset expresses a distinct set of PTA genes, as determined by QPCR. See also Supplementary Tables S3 and S4. (F) A FACS plot showing the FRC, LEC, DN, and BEC isolated from the PLNs of 12-week-old NOD mice (PLNs from 15 individual mice were pooled together). qPCR was performed to measure Deaf1 (G) and Eif4g3 (H) gene expression in the FRCs isolated from the PLNs of 12-week-old NOD (pool of 15 individuals) and NOD.B10 (pool of 7–15 individuals) mice, and in FRCs isolated from the pooled lymph nodes of Deaf1-KO and WT control mice (pool of three individuals) (I). Data represent the mean ± SEM of two independent studies.
Figure 4
Figure 4
Deaf1 regulates Eif4g3 gene expression in immortalized LNSCs. (A) A representative FACS plot showing the expression of gp38, but not CD31 in immortalized LNSCs derived from the pooled lymph nodes of BALB/c mice (PCRC-1). PCRC-1 cells were transfected with control siRNA, or Deaf1 siRNA and qPCR was performed to measure Deaf1 (B) and Eif4g3 (C) gene expression at various times after transfection (mean ± SEM of three independent experiments, *P < 0.05, two-tailed unpaired Student's t-test).
Figure 5
Figure 5
Polysome analysis of Eif4g3-silenced PCRC-1 cells. (A and B) PCRC-1 cells were treated with control or Eif4g3 siRNA, and qPCR was performed to measure Eif4g3 and Eif4g1 mRNA expression at various times after transfection (mean ± SEM of three independent experiments, *P < 0.05, two-tailed unpaired Student's t-test). (C) Representative immunoblots showing eIF4G and β-actin (loading control) expression 48 h after transfection with control, Deaf1, or Eif4g3 siRNA. (D) Polysomes were isolated from PCRC-1 cells, and 13 fractions of increasing density were collected. These contain the RNP (fractions 1–2), top fractions (fractions 3–6), light polysome fraction (fractions 7–9), and heavy polysome fraction (fractions 10–13). The optical density of each fraction isolated from control siRNA-treated cells, 48 h after transfection, is shown. (E) A representative bioanalyzer gel image showing the RNA extracted from each fraction collected from control siRNA-treated cells, 48 h after transfection. The 18S and 28S rRNA bands are indicated. (F and G) qPCR measurements of Eif4g3 and Deaf1 gene expression in the heavy polysome fractions. RNA samples were isolated from fractions collected 48 h after siRNA transfection, and fractions 10–13 were pooled prior to qPCR analysis. Data represent the mean ± SEM of three independent experiments (***P < 0.0005, two-tailed unpaired Student's t-test). Data shown in CE are representative of three independent experiments. See also Supplementary Figure S2. (H) Venn diagram showing the number of genes that are down-regulated by ≥2-fold in the heavy polysome fraction and total cell lysate of Eif4g3-silenced PCRC-1 cells vs. control-siRNA-treated controls, as measured by two-color microarray analysis. Only genes that were reduced by ≥2-fold in at least three out of four individual experiments are included.
Figure 6
Figure 6
Deaf1 regulates Casp3 expression in PCRC-1 cells. qPCR analysis showing up-regulated Casp3 (A and B) and CASP3 (C) mRNA expression in the PLNs of Deaf1-KO mice vs. littermate controls (A), 12-week-old NOD mice vs. age-matched NOD.B10 controls (B), and T1D/auto-antibody-positive patients compared with non-disease controls (C). P-values are indicated on graphs and determined using the two-tailed Mann–Whitney test. PCRC-1 cells were transfected with control or Deaf1 siRNA and QPCR was performed to measure Deaf1 (D), Casp3 (E) and Casp1 (F) expression at various times after transfection (mean ± SEM of three independent experiments, *P < 0.05, two-tailed unpaired Student's t-test). (G) Representative immunoblots showing CASP3 and β-actin (loading control) expression in PCRC-1 cells, 18, 24, and 48 h after transfection with control or Deaf1 siRNA. Low amounts of CASP3 expression were also observed in untransfected and mock-transfected cells (Supplementary Figure S3D). (H) qPCR analysis of Casp3 expression in various polysome fractions isolated from PCRC-1 that were transfected with control or Deaf1 siRNA. RNA samples were collected 48 h after transfection, and pooled as indicated prior to qPCR analysis. Data represent the mean ± SEM of three independent experiments (**P < 0.005, two-tailed unpaired Student's t-test). (I) CASP3 activity measured in PCRC-1 cells at various times after transfection with control or Deaf1siRNA (mean ± SEM of three independent experiments, **P < 0.005, two-tailed unpaired Student's t-test). See also Supplementary Figure S3.
Figure 7
Figure 7
A model showing how Deaf1 splicing may affect PTA expression on LNSCs. Inflammation in the PLNs of 12-week-old NOD mice (or T1D patients) can induce the splicing of Deaf1, which leads to the loss of DEAF1 function. This results in reduced expression of PTAs and Eif4g3/eIF4GII, and increased expression of Casp3/CASP3. Diminished eIF4GII levels lead to the loss of Anpep translation, which can affect antigen presentation on MHC II. Together, these changes could impact T cell engagement with LNSCs, and contribute to the escape of self-reactive T cells or prevent the induction of autoantigen-specific regulatory T cells.

Similar articles

Cited by

References

    1. Abbott C.M., Proud C.G. Translation factors: in sickness and in health. Trends Biochem. Sci. 2004;29:25–31. - PubMed
    1. Anderson M.S., Venanzi E.S., Klein L., et al. Projection of an immunological self shadow within the thymus by the aire protein. Science. 2002;298:1395–1401. - PubMed
    1. Bagri A., Marin O., Plump A.S., et al. Slit proteins prevent midline crossing and determine the dorsoventral position of major axonal pathways in the mammalian forebrain. Neuron. 2002;33:233–248. - PubMed
    1. Baker C.C., Fuller M.T. Translational control of meiotic cell cycle progression and spermatid differentiation in male germ cells by a novel eIF4G homolog. Development. 2007;134:2863–2869. - PMC - PubMed
    1. Caron S., Charon M., Cramer E., et al. Selective modification of eukaryotic initiation factor 4F (eIF4F) at the onset of cell differentiation: recruitment of eIF4GII and long-lasting phosphorylation of eIF4E. Mol. Cell. Biol. 2004;24:4920–4928. - PMC - PubMed

Publication types

MeSH terms