. 2012 Nov 1;40(20):10005-17.
doi: 10.1093/nar/gks726. Epub 2012 Aug 25.

Repeat or not repeat?--Statistical validation of tandem repeat prediction in genomic sequences

Affiliations

Repeat or not repeat?--Statistical validation of tandem repeat prediction in genomic sequences

Elke Schaper et al. Nucleic Acids Res. .

Abstract

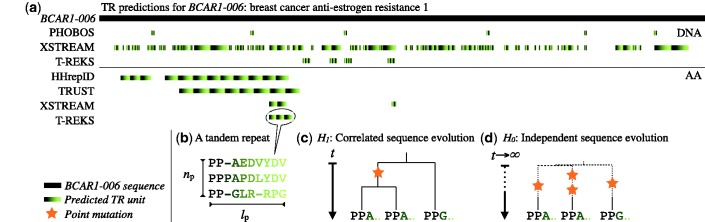
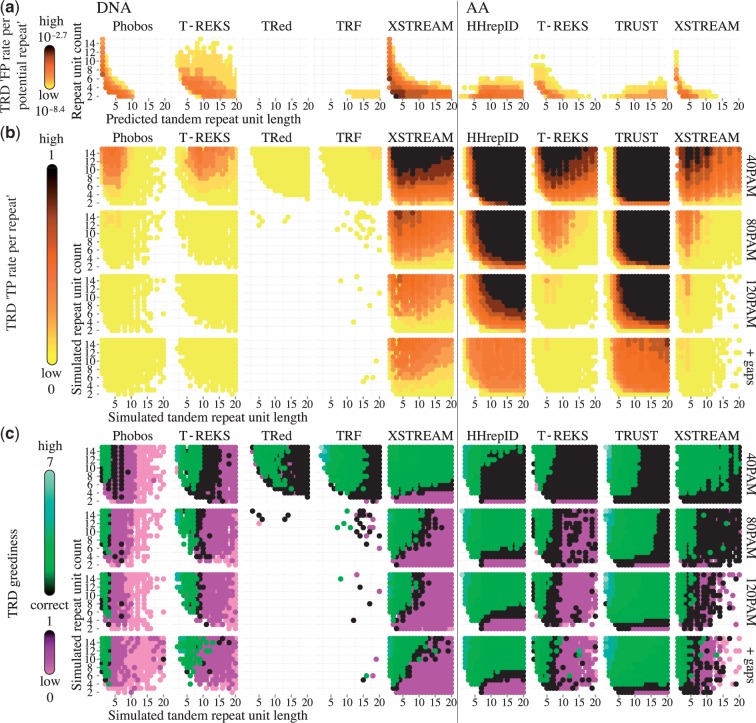
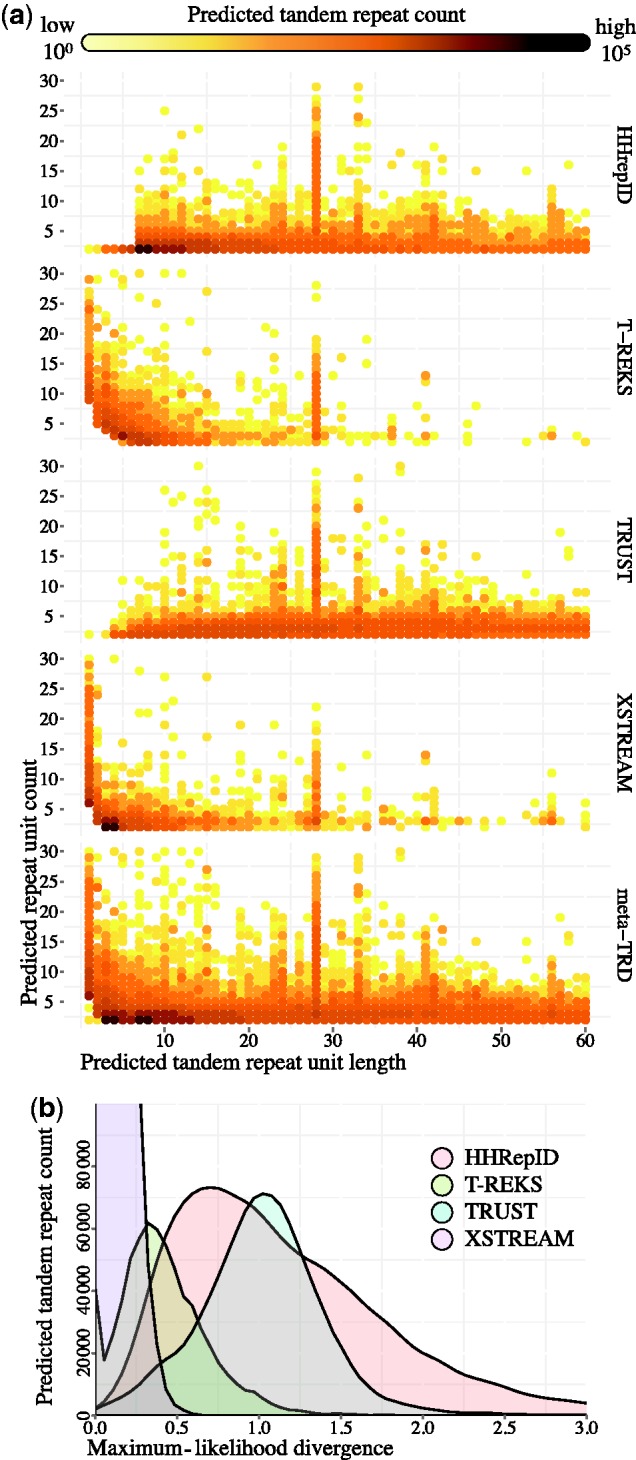
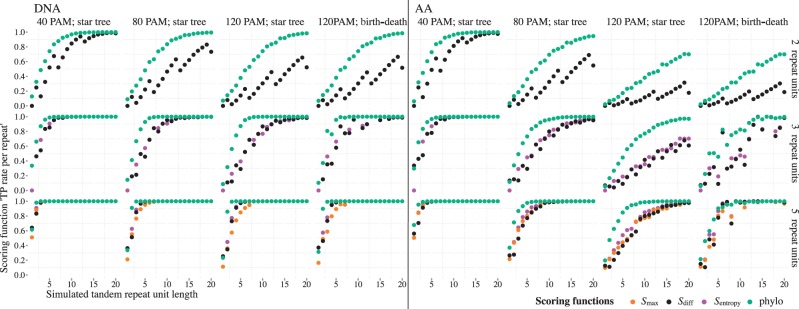
Tandem repeats (TRs) represent one of the most prevalent features of genomic sequences. Due to their abundance and functional significance, a plethora of detection tools has been devised over the last two decades. Despite the longstanding interest, TR detection is still not resolved. Our large-scale tests reveal that current detectors produce different, often nonoverlapping inferences, reflecting characteristics of the underlying algorithms rather than the true distribution of TRs in genomic data. Our simulations show that the power of detecting TRs depends on the degree of their divergence, and repeat characteristics such as the length of the minimal repeat unit and their number in tandem. To reconcile the diverse predictions of current algorithms, we propose and evaluate several statistical criteria for measuring the quality of predicted repeat units. In particular, we propose a model-based phylogenetic classifier, entailing a maximum-likelihood estimation of the repeat divergence. Applied in conjunction with the state of the art detectors, our statistical classification scheme for inferred repeats allows to filter out false-positive predictions. Since different algorithms appear to specialize at predicting TRs with certain properties, we advise applying multiple detectors with subsequent filtering to obtain the most complete set of genuine repeats.


Figures

Figure 1.
Figure 1.
An example of conflicting TR predictions. (a) TR detections of seven TRDs on the protein sequence and the coding sequence of BCAR1 (breast cancer anti-estrogen resistance 1 isotope 6; ENSP00000440370; ENST00000535626). TRF and TRed predicted no TRs in the sequence. For all other TRDs, the predictions differ in location, size and unit prediction and are partly contradicting. Some of the predicted TRs may be FP predictions, others TPs. One of the TRs predicted by T-REKS is shown in (b), with np = 3 repeat units and a predicted repeat unit length ignoring insertions of lp = 9. (c,d) Was the TR predicted correctly? (c) Did the predicted TR units evolve through unit duplication and are correlated for this reason? (d) Or did they evolve independently? This is an equivalent case to repeat unit duplication when the repeat units lose their correlation due to strong subsequent divergence. When models for both cases are defined, a statistical test can help to filter out false-positively predicted TRs.
Figure 3.
Figure 3.
FP and TP TR prediction on simulated DNA and amino acid sequence data for seven commonly used TRDs. (a) Logarithmic ‘FP rates per repeat’ as a function of the TR unit length (≤20) and the TR unit count (≤15). The test set consisted of 200 000 sequences of length 1000, simulated by drawing random 3-mers from the human genome and proteome from Ensembl archive 64. Note that XSTREAM was primarily intended as a protein TRD and the strong permissiveness on DNA data is a result of fixed scoring function thresholds in combination with the much smaller nucleic alphabet leading to higher sequence similarity by chance. (b) ‘TP rates per repeat’. (c) TRD greediness (defined as the ratio of predicted TR unit length over simulated TR unit length). Values ≥1 signify greedy aggregation of TR units and values ≤1 indicate that the TR units were predicted only partly, or that characters were predominantly predicted to stem from independent insertion events. For (a) and (b), each test set consisted of 1000 simulated TRs. For sequence simulation, the TN93 model with equal nucleic frequencies (DNA) and the LG model (AA), respectively, were applied to ultrametric star trees. Indel events are simulated by a symmetric birth–death process with Zipfian distributed length ≤50 chars and an average of 0.02 indel events per site. Results are shown for three different TR divergences (40, 80 and 120 in PAM units) for nongappy TRs and additionally for gappy highly diverged TRs (120 PAM).
Figure 2.
Figure 2.
Predictions of four TRDs on the human proteome. (a) Logarithmic count of TR predictions. All TRDs capture the abundant Zn finger motive, resulting in a strong spike for TRs with a TR unit length of 28 aa. (b) Maximum-likelihood estimates of divergences t (formula 3) of the predicted TRs, measured in expected substitutions per site.
Figure 4.
Figure 4.
‘TP rate per repeat’ of four TR scoring functions on simulated DNA and amino acid TRs. The test set consisted of gap-free TRs simulated under three different TR divergences (40, 80 and 120 PAM units) assuming a star phylogeny and additionally for highly diverged TRs (120 PAM) assuming a birth–death phylogeny. Results are shown for TRs with copy numbers 2, 3 and 5 for a range of TR unit lengths between 1 and 20 characters. Each test set consisted of 10 000 simulated TRs. DNA and amino acid sequences were simulated with the TN93 model and the LG models, respectively. Scoring function thresholds were chosen to control the FP classification rate at 5% on random sequences with character frequencies estimated from the Ensembl 64 assembly of the human genome and proteome. For n = 2 results for all similarity based classifiers are identical. For n = 3 the results are the same for Smax and Sdiff. The sudden changes in classification power for these cases are due to the very coarse distribution of possible scores so that no threshold score sets the significance level to exactly 5%. For the model based classifier 'phylo', the LRT statistic was used as the scoring function.

References

    1. Wyman AR, White R. A highly polymorphic locus in human DNA. Proc. Natl Acad. Sci. USA. 1980;77:6754–6758. - PMC - PubMed
    1. Jeffreys AJ, Wilson V, Thein SL. Individual-specific ‘fingerprints’ of human DNA. Nature. 1985;316:76–79. - PubMed
    1. Marcotte EM, Pellegrini M, Yeates TO, Eisenberg D. A census of protein repeats. J. Mol. Biol. 1999;293:151–160. - PubMed
    1. Machado C, Sunkel CE, Andrew DJ. Human autoantibodies reveal titin as a chromosomal protein. J. Cell Biol. 1998;141:321–333. - PMC - PubMed
    1. Itoh-Satoh M, Hayashi T, Nishi H, Koga Y, Arimura T, Koyanagi T, Takahashi M, Hohda S, Ueda K, Nouchi T, et al. Titin mutations as the molecular basis for dilated cardiomyopathy. Biochem. Biophy. Res. Commun. 2002;291:385–393. - PubMed

Publication types