. 2013 Jan;41(2):e34.
doi: 10.1093/nar/gks781. Epub 2012 Aug 25.

Detection of alternative lengthening of telomeres by telomere quantitative PCR

Affiliations

Detection of alternative lengthening of telomeres by telomere quantitative PCR

Loretta M S Lau et al. Nucleic Acids Res. 2013 Jan.

Abstract

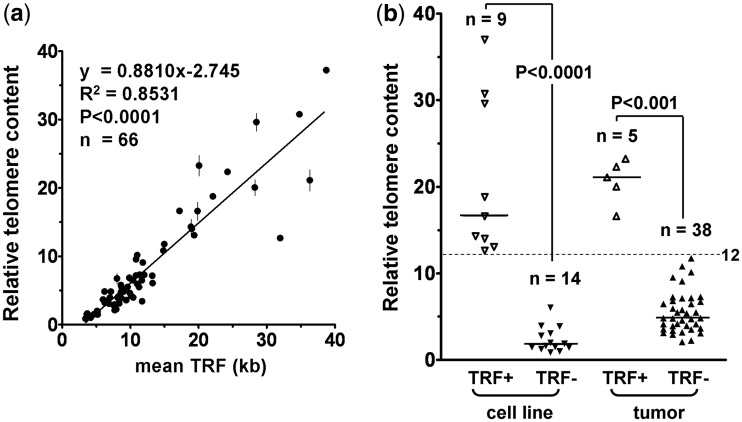
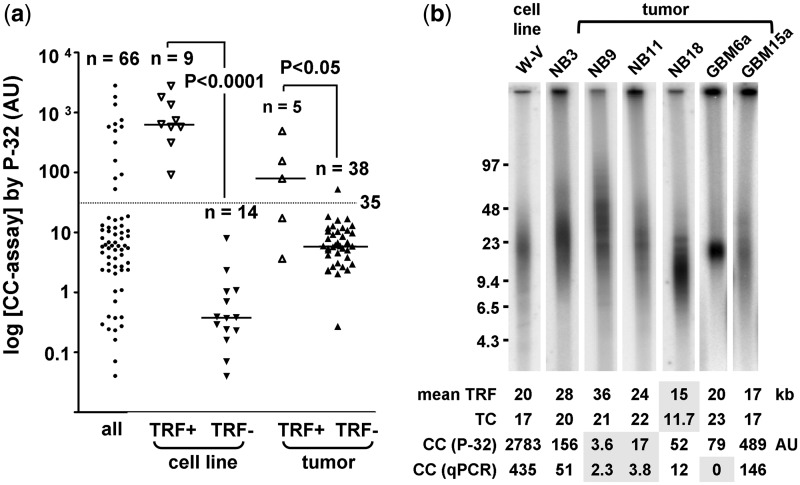
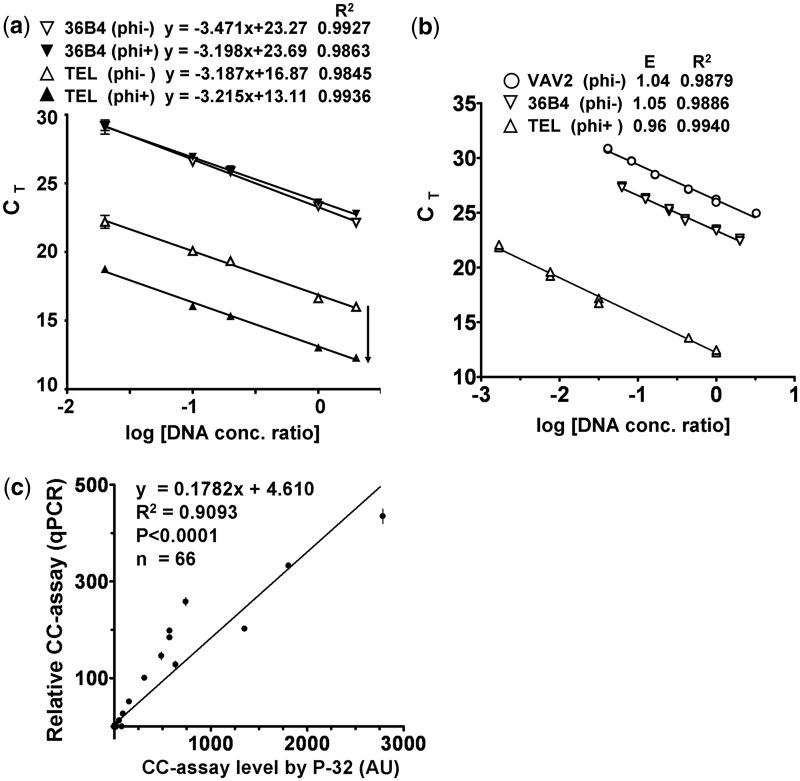
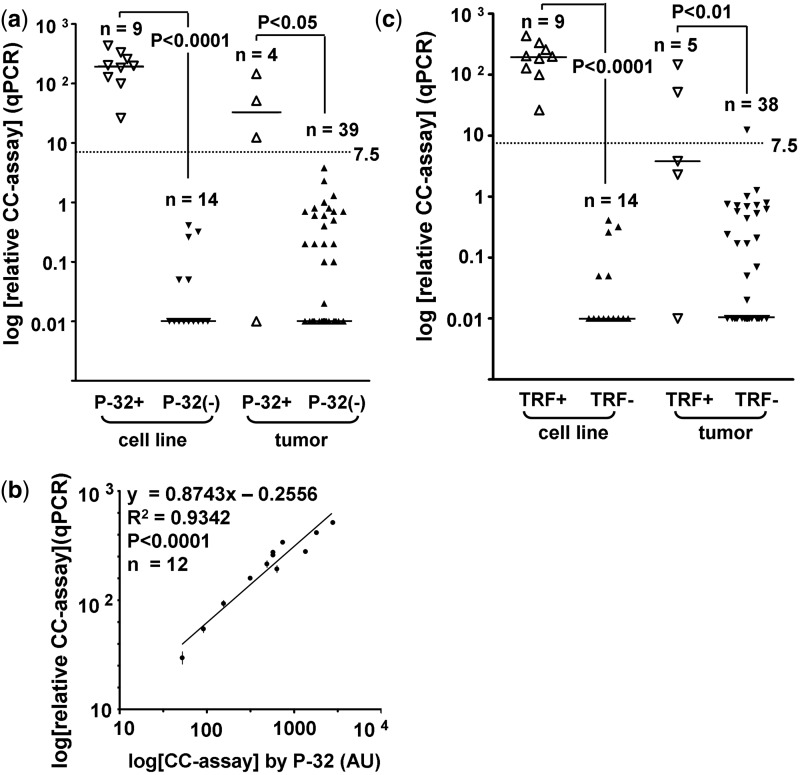
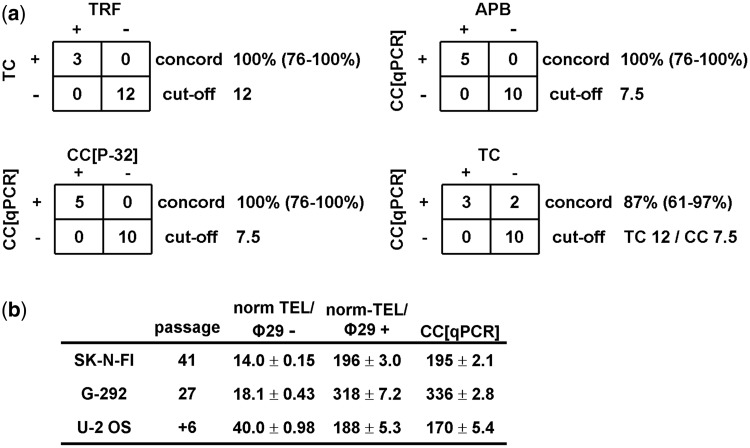
Alternative lengthening of telomeres (ALT) is one of the two known telomere length maintenance mechanisms that are essential for the unlimited proliferation potential of cancer cells. Existing methods for detecting ALT in tumors require substantial amounts of tumor material and are labor intensive, making it difficult to study prevalence and prognostic significance of ALT in large tumor cohorts. Here, we present a novel strategy utilizing telomere quantitative PCR to diagnose ALT. The protocol is more rapid than conventional methods and scrutinizes two distinct characteristics of ALT cells concurrently: long telomeres and the presence of C-circles (partially double-stranded circles of telomeric C-strand DNA). Requiring only 30 ng of genomic DNA, this protocol will facilitate large-scale studies of ALT in tumors and can be readily adopted by clinical laboratories.


Figures

Figure 1.
Figure 1.
Analysis of telomeric DNA content (TC) detects the long telomeres of ALT+ samples. Relative TC was determined by telomere qPCR and mean TRF length by TRF analysis in 23 cell lines and 43 tumor samples. (a) Linear regression demonstrates correlation between relative TC (mean ± SEM, n = 3) and mean TRF length. The TC of a sample is relative to the TC of the ALT+ U-2 OS cell line (arbitrary value of 40). (b) Relative TC levels are plotted according to whether or not TRF analysis determined that the samples are ALT-like (TRF+ or TRF−). The median TC (horizontal bar) is significantly higher in TRF+ than in TRF− cell lines (16.6 versus 1.7) and tumors (21.1 versus 4.8). Dotted lines indicate the relative TC cut-off (12.0) for distinguishing ALT+ from ALT− samples.
Figure 2.
Figure 2.
Sensitivity, specificity and concordance of telomeric DNA content (TC) and CC assay level for ALT detection. Sensitivity (sens) and specificity (spec) of qPCR for TC and CC detection were determined using TRF and CC[P-32] assay as the gold standard, respectively. A sample was regarded as TRF+ for ALT when mean TRF ≥16 kb and SIR ≥4 kb and CC+ when CC[P-32] ≥35AU. The indicated cut-off values for TC and CC[qPCR] separated samples into test-positive and test-negative groups. The concordance (concord) rate refers to the proportion of samples where both tests were in agreement.
Figure 3.
Figure 3.
Correlation between TRF and CC assays. (a) Genomic DNA of 66 samples was subjected to CC assay followed by detection with 32P labeled telomeric probe in slot-blot analysis. CC assay level was plotted on a logarithmic scale according to TRF status. The median CC assay level (horizontal bar) was significantly higher in TRF+ than in TRF− cell lines (636 versus 0.4 AU) and tumors (79 versus 6.0 AU). The cut-off (35.0 AU) is indicated by the dotted line. (b) TRF analysis of samples with different telomere length and CC profile. Numbers that are shaded are values below the cut-off. The cut-off is 16 kb for mean TRF, 12 for relative telomeric DNA content (TC), 35AU for CC[32P] and 7.5 for CC[qPCR].
Figure 4.
Figure 4.
Correlation between CC assay levels detected by 32P-labeled probe or by telomere qPCR. (a) Five concentrations (0.01, 0.05, 0.1, 0.5, 1 ng/µl) of DNA from the ALT+ cell line CHLA-90 were subjected to the CC assay with and without φ29 DNA polymerase (φ29), followed by telomere and 36B4 qPCR. The addition of φ29 to the CC assay resulted in a parallel downward shift of the telomere (TEL) standard curves, but not for the 36B4 single copy gene. Each data point of the standard curves is the average ± range (n = 2). (b) qPCR standard curves for telomere and the two single copy genes (36B4 and VAV2), as well as the corresponding PCR efficiency (E) and R2 are shown. (c) A total of 66 samples were subjected to the CC assay, followed by detection with 32P or telomere qPCR. The relative CC assay level is the difference in telomeric DNA content between the φ29+ and φ29− paired samples and is relative to that of the ALT+ U-2 OS cell line (arbitrary value of 170). Linear regression demonstrates correlation between the two detection methods. The relative CC assay level by qPCR is plotted as mean ± SEM, n = 3.
Figure 5.
Figure 5.
Detection of CC by φ29 and telomere qPCR compared to 32P-labeled probe. (a and c) Mean relative CC[qPCR] assay level was plotted according to 32P and TRF status. A sample was regarded as CC[32P]+ when the level was ≥35AU. For the purpose of plotting negative data points on a logarithmic scale, negative or zero values were assigned a value of 0.01. The median CC assay level (horizontal bar) was significantly higher in CC[32P]+ than in CC[32P]− cell lines (198 versus 0) and tumors (32 versus 0). The mean CC[qPCR] assay level is significantly higher in TRF+ than in TRF− cell lines (198 versus 0) and tumors (3.8 versus 0). The cut-off (7.5) is indicated by the dotted line. (b) Linear regression demonstrates good correlation between CC assay levels by qPCR and by 32P in the 12 CC[qPCR]+ samples (level ≥7.5). Data were plotted as mean ± SEM, n = 3.
Figure 6.
Figure 6.
Validation and calibration of the ALT detection assay. (a) Concordance of telomeric DNA content (TC) and CC assay level for ALT detection in the validation cohort of 15 soft tissue sarcomas (STS). The cut-offs for TRF, TC and CC assay levels are the same as in Figure 2. The concordance (concord) rate refers to the proportion of samples where both tests were in agreement. 95% confidence intervals are shown in parentheses. (b) Calibration measurements including norm-TEL/φ29+, norm-TEL/φ29− and the calculated CC[qPCR] level (as described in ‘Materials and Methods’ section) for U-2 OS, SK-N-FI and G-292 cell lines are shown. VAV2 was used as the single copy gene to normalize telomere PCR product. PCRs were done in triplicate and three independent experiments were performed. Results for norm-TEL/φ29+ and norm-TEL/φ29− are expressed as the mean of the three independent experiments ±SEM. For CC[qPCR], the CC assay level relative to U-2 OS was first calculated for each of the independent experiments and the mean of the three experiments ±SEM was then obtained.

References

    1. Reddel RR. The role of senescence and immortalization in carcinogenesis. Carcinogenesis. 2000;21:477–484. - PubMed
    1. Shay JW, Bacchetti S. A survey of telomerase activity in human cancer. Eur. J. Cancer. 1997;33:787–791. - PubMed
    1. Henson JD, Reddel RR. Assaying and investigating Alternative Lengthening of Telomeres activity in human cells and cancers. FEBS Lett. 2010;584:3800–3811. - PubMed
    1. Henson JD, Neumann AA, Yeager TR, Reddel RR. Alternative lengthening of telomeres in mammalian cells. Oncogene. 2002;21:598–610. - PubMed
    1. Henson JD, Hannay JA, McCarthy SW, Royds JA, Yeager TR, Robinson RA, Wharton SB, Jellinek DA, Arbuckle SM, Yoo J, et al. A robust assay for alternative lengthening of telomeres in tumors shows the significance of alternative lengthening of telomeres in sarcomas and astrocytomas. Clin. Cancer Res. 2005;11:217–225. - PubMed

Publication types