. 2012 Aug 24;337(6097):937-41.
doi: 10.1126/science.1223012.

A periciliary brush promotes the lung health by separating the mucus layer from airway epithelia

Affiliations

A periciliary brush promotes the lung health by separating the mucus layer from airway epithelia

Brian Button et al. Science. .

Abstract

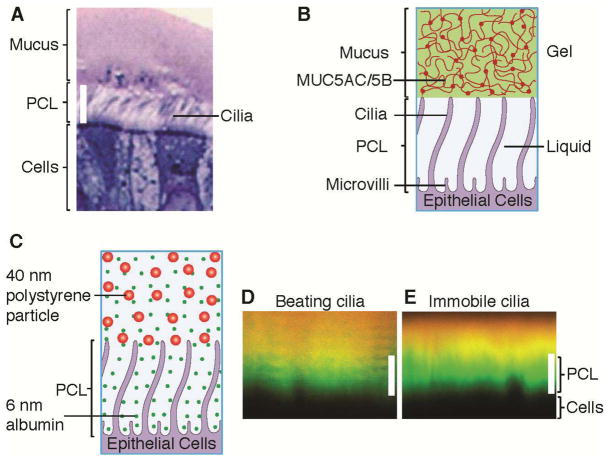
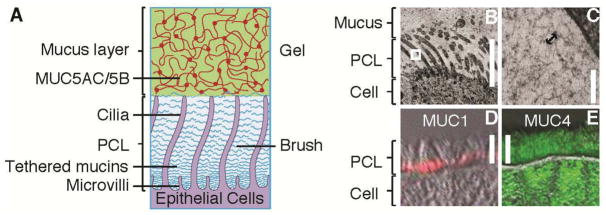
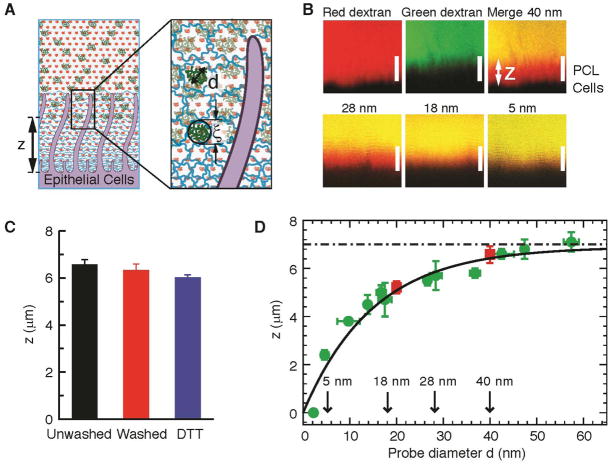
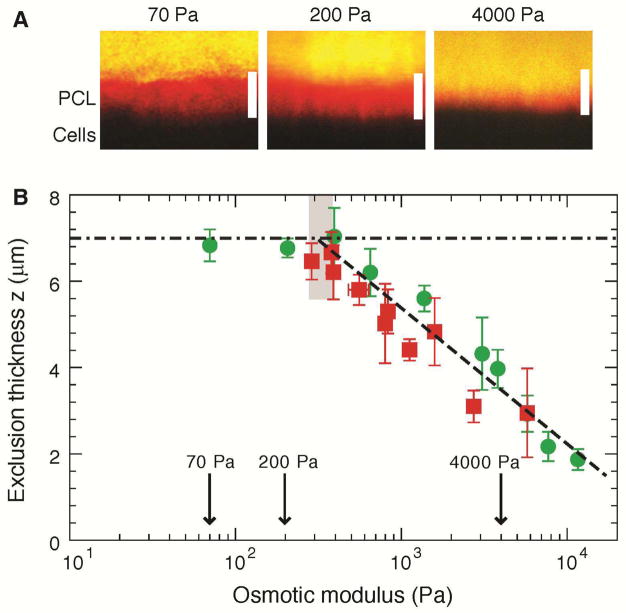
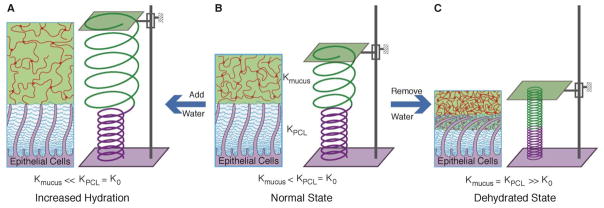
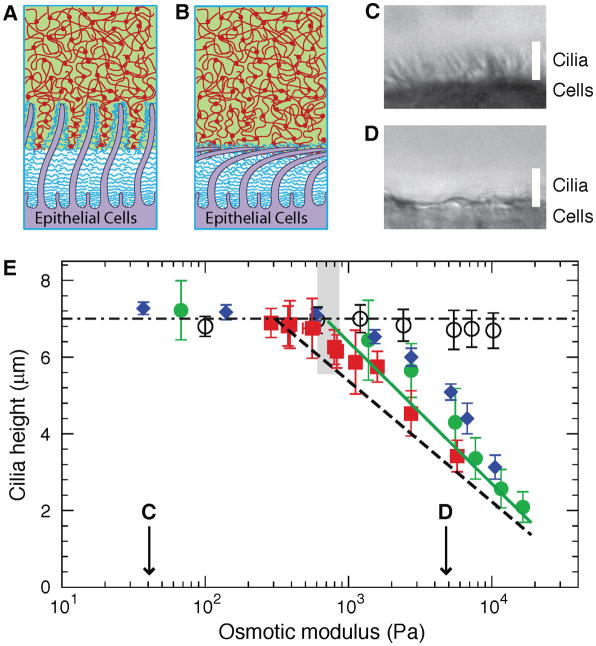
Mucus clearance is the primary defense mechanism that protects airways from inhaled infectious and toxic agents. In the current gel-on-liquid mucus clearance model, a mucus gel is propelled on top of a "watery" periciliary layer surrounding the cilia. However, this model fails to explain the formation of a distinct mucus layer in health or why mucus clearance fails in disease. We propose a gel-on-brush model in which the periciliary layer is occupied by membrane-spanning mucins and mucopolysaccharides densely tethered to the airway surface. This brush prevents mucus penetration into the periciliary space and causes mucus to form a distinct layer. The relative osmotic moduli of the mucus and periciliary brush layers explain both the stability of mucus clearance in health and its failure in airway disease.


Conflict of interest statement

The authors declare that they have no competing financial interests.

Figures

Fig. 1
Fig. 1. The periciliary layer is not a simple liquid layer
(A) Light microscopy view of the airway surface layer, comprising the mucus layer and the periciliary layer (PCL). HBE cultures were fixed with Osmium Tetraoxide in perfluorocarbon, Epon-embedded, and stained with Richardson’s (42). Scale bar = 7 μm. (B) Schematic representation of the traditional Gel-on-Liquid model showing a mucus layer (comprised of gel-forming mucins, MUC5AC and MUC5B) and the PCL being a liquid-filled domain. (C) Schematic illustration showing penetration of small (d ≈ 6 nm (43)) fluorescently-labeled albumin (green) into the PCL, whereas 40 nm polystyrene particles (red) are completely excluded from the PCL. The experiments were performed after thorough washings that remove mucus, leaving solely the clean PCL, to avoid possible trapping of these particles by the mucus (44, 45). (D, E) Representative XZ confocal images of well-differentiated HBE cultures with (D) normally beating cilia and (E) paralyzed, i.e., immobile, cilia (pre-treated for 10 minutes with 1% isoflurane to produce reversible ciliastasis (46)). Here, the exclusion zone (green region) was accessible to the green albumin, but not the larger particles, while the yellow region was accessible to both. Note: the wavy streaks in image (D) are an artifact of beating cilia during image acquisition. Scale bars = 7 μm.
Fig. 2
Fig. 2. Gel-on-Brush model of the PCL
(A) Schematic representation of the Gel-on-Brush hypothesis of the periciliary layer: tethered macromolecules, such as membrane-bound mucins, form a brush-like structure of the PCL. (B, C) Morphological evidence for the Gel-on-Brush model is revealed by rapid freeze imaging of HBE cultures exhibiting extensive mesh-like structure with mesh (depicted by the arrow in (C)) on the order of ~ 20–40 nm in the PCL. Immunological evidence showing the presence of tethered mucins on freshly excised human airway tissue: (D) MUC1 (red) is located at the bottom of the PCL; (E) MUC4 (green) spans the whole PCL. Scale bars in (B, D, E) = 7 μm, bar in (C) = 100 nm, double-head arrow in (C) = 30 nm. White box in (B) denotes area of magnification.
Fig. 3
Fig. 3. Size exclusion gradient in the PCL
(A) Schematic illustration of the two-dye technique used to probe the mesh size distribution within the PCL. Insert: probe molecules are expected to penetrate part of the PCL down to a distance z from the cell surface at which the PCL mesh size ξ is on the order of molecular diameter d. (B) Representative XZ-confocal images of: small (d ≈ 2 nm) dextran fluorescently labeled with Texas Red exploring the whole PCL; green dextran with hydrodynamic diameter d ≈ 40 nm, labeled by FITC; merged image showing the exclusion thickness z defined as the height of the red region bounded by the cell layer (black due to lack of staining) and the yellow (green + red) layer; exclusion of dextran molecules with decreasing sizes. Scale bars = 7 μm. (C) Exclusion for dilute solution of polystyrene beads with diameter d = 40 nm added to unwashed cultures, washed 3 times with PBS, washed (15 min) with 10 mM Dithiothreitol (DTT), to completely remove all mucus and adsorbed macromolecules from the cell surface (34). Data are shown as mean ± SD with the number of samples (patients) n = 3. Measurement of each sample contains 5 HBE cultures, with > 50 confocal images per culture. (D) Summary plot showing the dependence of exclusion thickness z on the size of dextran molecules (green circles). The exclusion of fluorescently labeled 20 and 40 nm polystyrene particles (red squares) are added for comparison. Data points are mean ± SD (n = 3–5). Solid curve is the best fit to the data by an empirical equation: z(d) ≈ 7μm[1−exp(−d/15nm)], and dash-dotted line at 7 μm represents the height of the outstretched cilia.
Fig. 4
Fig. 4. Osmotic compression of the PCL-brush by mucus and mucus simulants
(A) Representative XZ-confocal images showing progressive compression of the PCL brush by large dextran molecules (d > 50 nm) of increasing osmotic moduli. Scale bars = 7 μm. (B) Summary data of the exclusion thickness (z) of the large dextran molecules (green circles) and endogenous mucus (red squares) versus their osmotic moduli. Data points are mean ± SD (n = 3–5). Dashed black line represents the best linear fit to the dependence of PCL height on the logarithm of osmotic modulus of mucus/mucus simulants for z < 6 μm: z ≈ 7μm − 3.15Log(K/340Pa). The highlighted region represents the osmotic modulus of a fully-hydrated (healthy) PCL, K0 ≈ 300±60 Pa, above which noticeable decrease of the PCL height was observed.
Fig. 5
Fig. 5. (A – C) Schematic illustration showing the effects of the relative water-drawing powers of the mucus gel and the PCL
(B), Normal state: the osmotic modulus of normal mucus is smaller than that of the PCL, represented by a green spring (Kmucus) with diameter larger than a purple spring (KPCL=K0). The volume of water in the system is depicted by the fixed distance between two plates. (A), Increased hydration: water added to the healthy airway surface (distance between plates increased) with Kmucus < K0 preferentially enters and thus dilutes the mucus layer, leaving the PCL unchanged. The resulting osmotic modulus of the mucus layer is much smaller than that of the PCL (KmucusK0). This state is depicted by increase length and diameter of the green spring with no change in the purple spring. (C), Dehydrated state (plates close to each other): as water is removed it first preferentially leaves the mucus gel due to its lower osmotic modulus. Further dehydration leads to removal of water from both the mucus gel and the PCL. The moduli of both layers are increased and equal, represented by smaller diameters of shortened springs. This state corresponds to diseased airways (COPD, CF).
Fig. 6
Fig. 6. Collapse of cilia by mucus and mucus simulants
Possible scenarios for the compression of the PCL brush by mucus or mucus simulants with high osmotic modulus (concentration): (A) tethered macromolecules are compressed towards the cilia surface without significant deformation of the cilia in comparison to the uncompressed PCL brush in Fig. 2A; (B) in addition to the compressed tethered macromolecules, the cilia are also deformed by solutions with high osmotic modulus; (C, D) Representative bright-field microscopy images showing the effects of low (C; ~ 300 Pa) and high (D; ~ 5,000 Pa) osmotic moduli of agarose on cilia height from HBE cultures (viewed in profile). White bars denote the length of fully extended cilia (7 μm). (E) Summary plot of the cilia height versus the osmotic moduli of the overlying mucus/mucus simulants, using large, PCL-impermeable dextran (d > 50 nm; green solid circles), low-melting point agarose (d ≈ 44 nm; blue solid diamonds), endogenous mucus (red solid squares), and small PCL permeable dextran (d ≈ 2 nm; black empty circles). Data points are mean ± SD (n = 3–5). Note that the PCL-permeant 2 nm dextran did not alter the height of the cilia. “C” and “D” above the x-axis represent conditions illustrated above. Solid green line represents the best linear fit to the dependence of cilia height on the logarithm of osmotic modulus of mucus/mucus simulants for K > 1,000 Pa: z ≈ 7μm − 3.33Log(K/807Pa). Dependence of the exclusion zone z(K) on osmotic modulus of mucus/mucus simulants (Fig. 4B) is shown for comparison by the dashed black line. Highlighted zone represents the crossover osmotic modulus, Kcc ≈ 800±120 Pa, above which noticeable decrease of the cilia height was observed.

Comment in

  • Biochemistry. Walking on solid ground.
    Dickey BF. Dickey BF. Science. 2012 Aug 24;337(6097):924-5. doi: 10.1126/science.1227091. Science. 2012. PMID: 22923570 Free PMC article. No abstract available.

Similar articles

Cited by

References

    1. Fahy JV, Dickey BF. N Engl J Med. 2010;363:2233. - PMC - PubMed
    1. Quinton PM. Physiol Rev. 1999;79:S3. - PubMed
    1. Wine JJ, Joo NS. Proc Am Thorac Soc. 2004;1:47. - PubMed
    1. Kaliner M, Marom Z, Patow C, Shelhamer J. J Allergy Clin Immun. 1984;73:318. - PubMed
    1. Knowles MR, Boucher RC. J Clin Invest. 2002;109:571. - PMC - PubMed

Publication types