. 2012 Aug 24;337(6097):975-80.
doi: 10.1126/science.1222278.

Phosphofructokinase 1 glycosylation regulates cell growth and metabolism

Affiliations

Phosphofructokinase 1 glycosylation regulates cell growth and metabolism

Wen Yi et al. Science. .

Abstract

Cancer cells must satisfy the metabolic demands of rapid cell growth within a continually changing microenvironment. We demonstrated that the dynamic posttranslational modification of proteins by O-linked β-N-acetylglucosamine (O-GlcNAcylation) is a key metabolic regulator of glucose metabolism. O-GlcNAcylation was induced at serine 529 of phosphofructokinase 1 (PFK1) in response to hypoxia. Glycosylation inhibited PFK1 activity and redirected glucose flux through the pentose phosphate pathway, thereby conferring a selective growth advantage on cancer cells. Blocking glycosylation of PFK1 at serine 529 reduced cancer cell proliferation in vitro and impaired tumor formation in vivo. These studies reveal a previously uncharacterized mechanism for the regulation of metabolic pathways in cancer and a possible target for therapeutic intervention.


Figures

Fig. 1
Fig. 1. Modulation of O-GlcNAc levels affects cellular metabolism and glycosylation of PFK1
(A) O-GlcNAc glycosylation levels as determined by immunoblotting with an anti-O-GlcNAc antibody after treatment of H1299 cells with the OGA inhibitor O-(2-acetamido-2-deoxy-d-glucopyranosylidene)amino-N-phenylcarbamate (PUGNAc) or OGT overexpression. Tubulin levels demonstrate equal protein loading. (B) Glycolytic rate, lactate production and relative ATP levels in untreated H1299 cells (Cont), PUGNAc-treated H1299 cells and H1299 cells overexpressing OGT (n = 5). (C) OGT levels in H1299 cells transfected with scramble or OGT shRNA. Tubulin levels demonstrate equal protein loading. Glycolytic rate, lactate production and relative ATP levels of H1299 cells transfected with OGT shRNA (kd) upon treatment with or without PUGNAc (n = 4; N.S., Not Significant). (D) PFK1 activity in untreated 293T cells (Cont), PUGNAc-treated 293T cells and 293T cells overexpressing OGT (n = 5). (E) Detection of PFK1 glycosylation by Western blotting after chemoenzymatic labeling of O-GlcNAc residues with UDP-GalNAz and the enzyme GalT, followed by reaction with an alkyne-biotin derivative, streptavidin pull-down and elution of the biotinylated proteins. GalT and UDP-GalNAz were removed as a control to confirm the specific labeling of O-GlcNAc. (F) Detection of glycosylated PFK1 levels in 293T cells stably expressing Flag-tagged PFK1 by chemoenzymatic labeling with a 5-kDa mass tag and immunoblotting with an anti-Flag antibody. Cells were untreated (Cont), treated with PUGNAc or transfected to overexpress OGT. (G) PFK1 glycosylation levels under hypoxic conditions or glucose deprivation. Levels were detected in H1299 cells stably expressing Flag-tagged PFK1 by chemoenzymatic labeling with a 5-kDa mass tag as described above. Error bars denote s.e.m. Statistical analysis was performed by Student’s t-test (* P < 0.05) for all figures.
Fig. 2
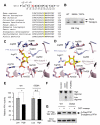
Fig. 2. Glycosylation within the F-2,6-BP binding site of PFK1 inhibits its activity and oligomerization
(A) Peptide sequence and glycosylation site (red) identified by ETD-MS (top). Sequence alignment of the residues surrounding Ser529 of PFK1 across different species (bottom). (B) Glycosylation levels of Flag-tagged WT PFK1 and PFK1 mutants as determined by chemoenzymatic labeling with a 5-kDa PEG mass tag followed by immunoblotting with an anti-Flag antibody. (C) Homology model of F-2,6-BP (yellow) bound to rabbit PFK1. (D) Computational model of rabbit PFK1 O-GlcNAc glycosylated (yellow) at Ser530, the residue equivalent to Ser529 in human PFK1. (E) Relative activities of WT and S529A PFK1 purified from transfected 293T cells with (High) and without (Low) treatments to enhance PFK1 glycosylation levels. Activities were measured in the presence of 100 μM F-2,6-BP and 3 mM ATP and were normalized with respect to the activity of WT PFK1 without treatment (n = 3). (F) Oligomerization state of Flag-tagged PFK1 purified from untreated 293T cells (Cont), and 293T cells following treatment with PUGNAc or OGT overexpression. (G) Co-immunoprecipitation of endogenous PFK1 with Flag-tagged WT or S529A PFK1 following OGT overexpression. Error bars denote s.e.m. Statistical analysis was performed by Student’s t-test (* P < 0.05) for all figures.
Fig. 3
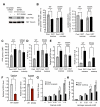
Fig. 3. PFK1 glycosylation at Ser529 regulates glycolysis, increases PPP flux and protects cells from ROS-mediated cell death
(A) Immunoblotting of H1299 cells stably expressing shRNA constructs and rescue constructs. Cells were infected with lentivirus containing shRNA-resistant Flag-WT or S529A PFK1 constructs where indicated, selected for 2 weeks and then infected with lentivirus containing scramble or PFK1 shRNA constructs to knockdown endogenous PFK1 expression. Tubulin levels demonstrate equal protein loading. Flag-PFK1 levels were comparable to endogenous PFK1 levels. (B) Glycolytic rate and lactate production of H1299 knock-in cells expressing WT or S529A PFK1 in the absence (Cont) or presence of OGT overexpression (n = 4). (C) PPP activity in WT or S529A PFK1 knock-in cells in the absence (Cont) or presence of OGT overexpression. PPP activity was calculated as the difference between the rate of [1-14C]-glucose and [6-14C]-glucose oxidation to [14C]-CO2 (n = 3). (D) Percentage of central carbon flux from glucose to lactate flowing through the PPP in WT or S529A PFK1 knock-in cells in the absence (Cont) or presence of OGT overexpression. Flux was determined from the relative enrichment of doubly vs. singly [13C]-labeled lactate, pyruvate, and 3-phosphoglycerate, as measured using negative mode triple-quadrupole LC-MS of extracts from cells fed with [1,2-13C]-glucose. (E) NADPH and GSH levels in WT or S529A PFK1 knock-in cells in the absence (Cont) or presence of OGT overexpression. NADPH levels were measured using a colorimetric assay (BioVison). GSH levels were measured by fluorimetric detection of the binding of the thiol probe monochlorobimane to the free GSH. Levels are shown relative to WT PFK1 Cont (n = 4). (F) NADPH and GSH levels in WT or S529A PFK1 knock-in cells under hypoxic conditions (n = 3). (G) Cellular ROS levels induced by varying concentrations of diamide in untreated H1299 cells (Cont) and H1299 cells overexpressing OGT, as measured by oxidation of the dye CM-H2DCFDA. (H) Percentage of cell death induced by varying concentrations of hydrogen peroxide in untreated H1299 cells (Cont) and H1299 cells overexpressing OGT, as measured by media lactate dehydrogenase levels (n = 4). Error bars denote s.e.m. Statistical analysis was performed by Student’s t-test (* P < 0.05) for all figures.
Fig. 4
Fig. 4. Blocking PFK1 glycosylation slows cell proliferation and reduces the tumorigenicity of lung cancer cells
(A) Cell proliferation rates under hypoxic conditions of WT and S529A PFK1 H1299 knock-in cells with and without OGT overexpression (n = 3; * P < 0.05, N.S., Not Significant). (B) Cell proliferation rates under hypoxic conditions of H1299 cells infected with lentiviruses containing scramble or PFK1 shRNA constructs following no treatment (Cont), OGT knockdown or OGT overexpression (n = 3; * P < 0.05). (C) Tumor formation in nude mice injected with WT or S529A PFK1 H1299 knock-in cells with and without OGT overexpression. Dissected tumors after 7-weeks growth in mice injected with WT cells on the left flank and S529A cells on the right flank (left). Masses of the dissected tumors (right). Each x represents the tumor mass from one mouse; the blue line indicates the mean tumor mass. Error bars denote s.e.m. Statistical analysis was performed by Student’s t-test for all figures.

Comment in

  • Cancer. Glycosylation to adapt to stress.
    Mattaini KR, Vander Heiden MG. Mattaini KR, et al. Science. 2012 Aug 24;337(6097):925-6. doi: 10.1126/science.1227513. Science. 2012. PMID: 22923571 No abstract available.

References

    1. DeBerardinis RJ, Lum JJ, Hatzivassiliou G, Thompson CB. The biology of cancer: metabolic reprogramming fuels cell growth and proliferation. Cell Metab. 2008;7:11–20. - PubMed
    1. Vander Heiden MG, Cantley LC, Thompson CB. Understanding the Warburg effect: The metabolic requirements of cell proliferation. Science. 2009;324:1029. - PMC - PubMed
    1. Hsu PP, Sabatini DM. Cancer cell metabolism: Warburg and beyond. Cell. 2008;134:703. - PubMed
    1. Cairns RA, Harris IS, Mak TW. Regulation of cancer cell metabolism. Nat Rev Cancer. 2011;11:85. - PubMed
    1. Christofk HR, et al. The M2 splice isoform of pyruvate kinase is important for cancer metabolism and tumor growth. Nature. 2008;452:230. - PubMed

Publication types

MeSH terms