. 2012 Sep 26;134(38):15790-804.
doi: 10.1021/ja304907c. Epub 2012 Sep 17.

Processing pathway dependence of amorphous silica nanoparticle toxicity: colloidal vs pyrolytic

Affiliations

Processing pathway dependence of amorphous silica nanoparticle toxicity: colloidal vs pyrolytic

Haiyuan Zhang et al. J Am Chem Soc. .

Abstract

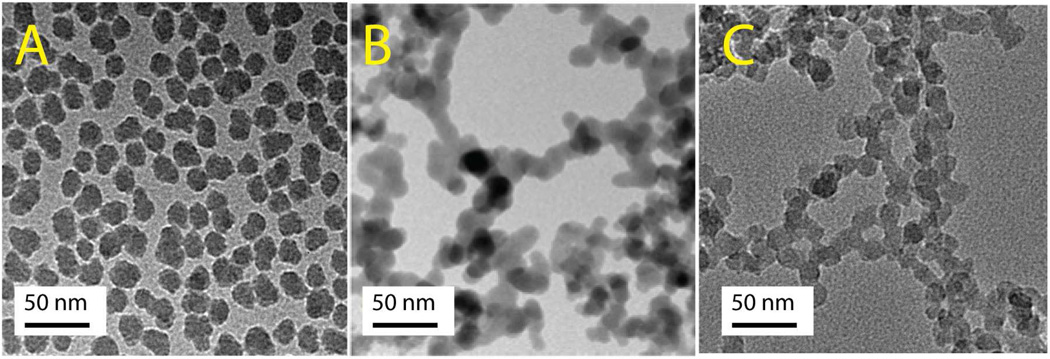
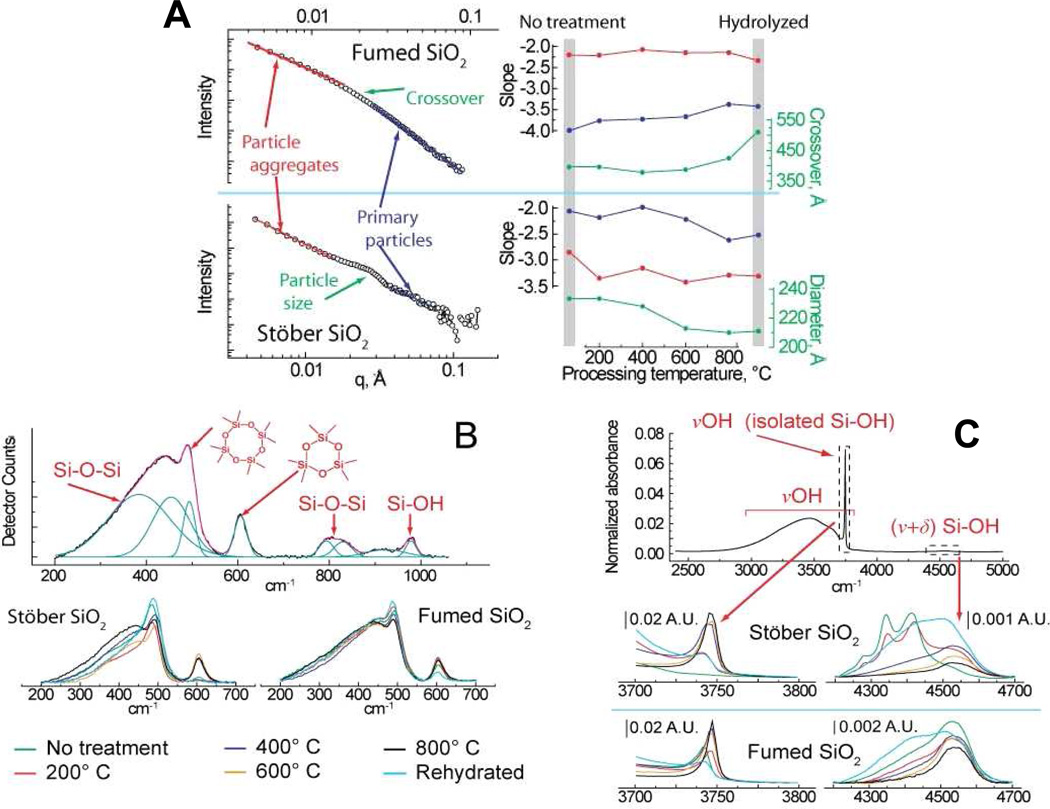
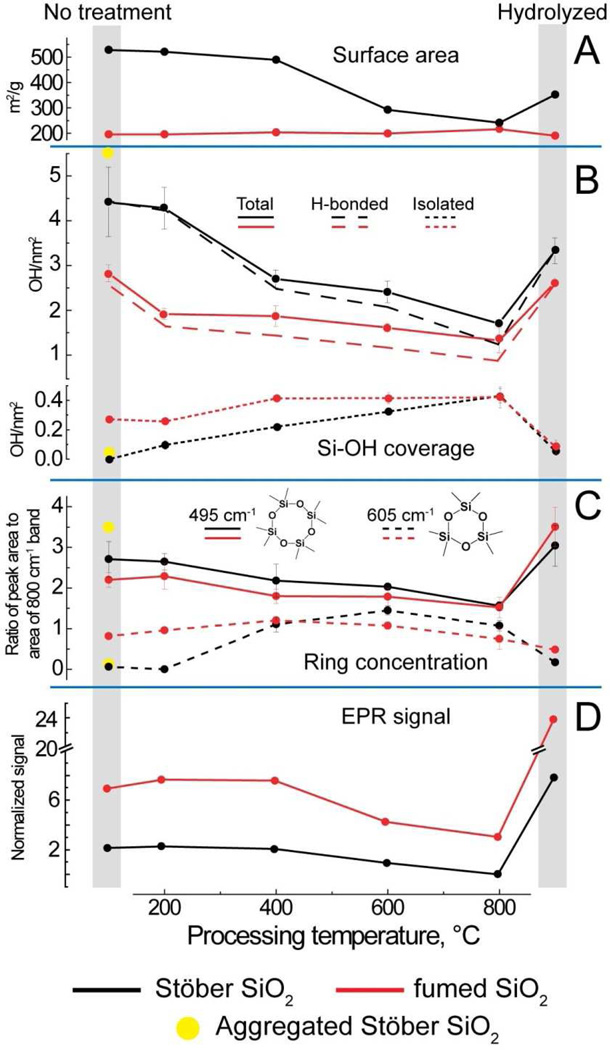
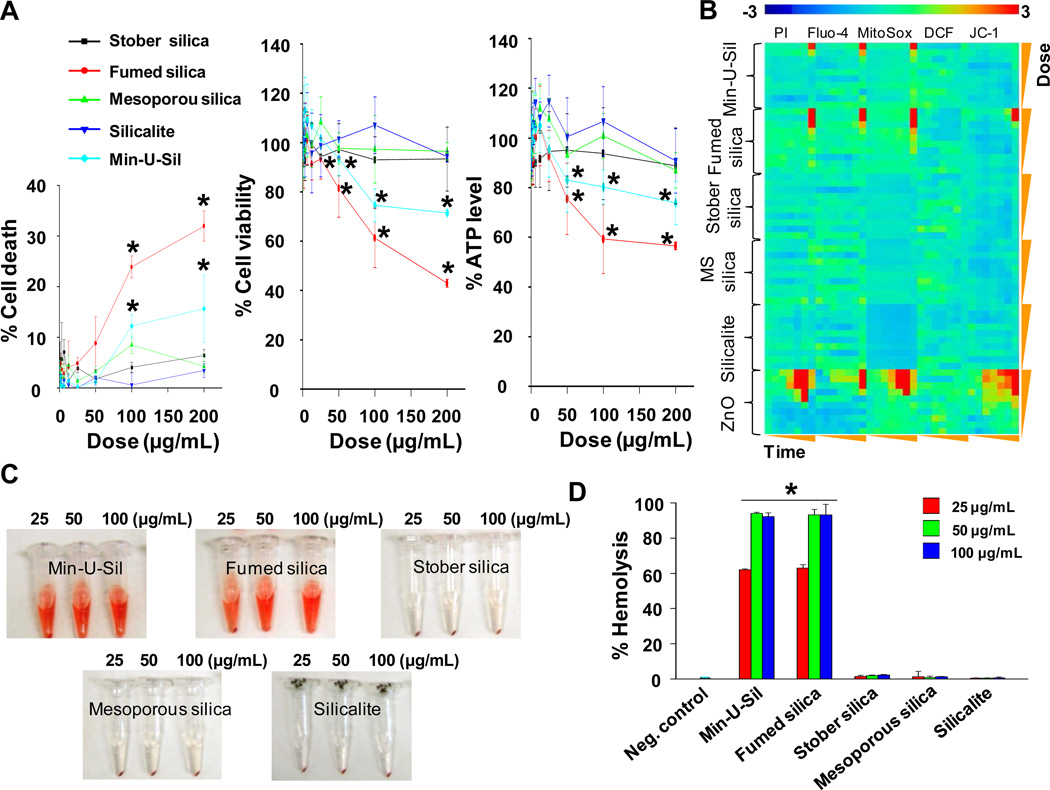
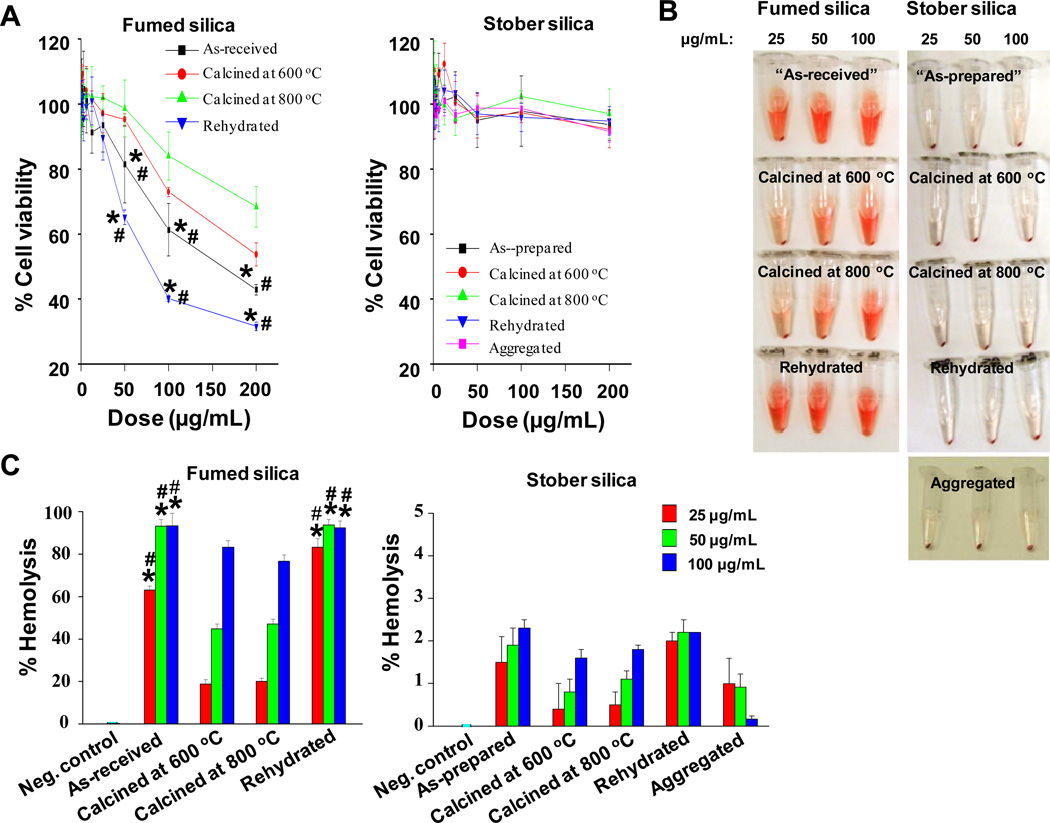
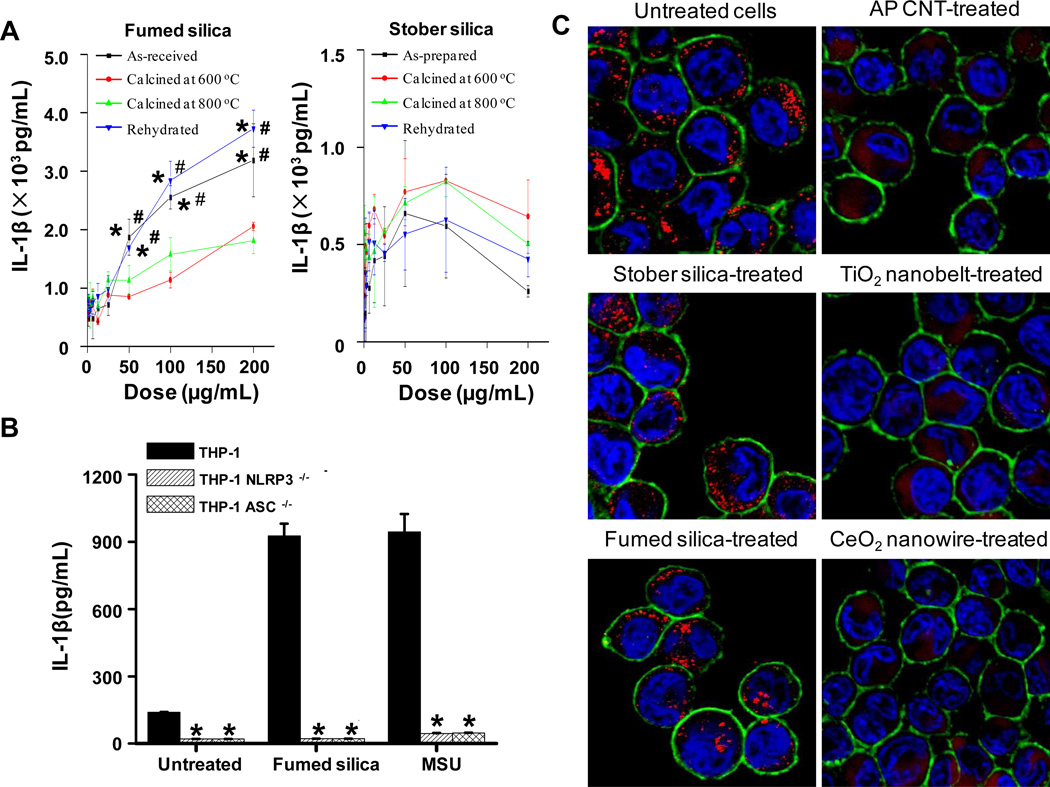
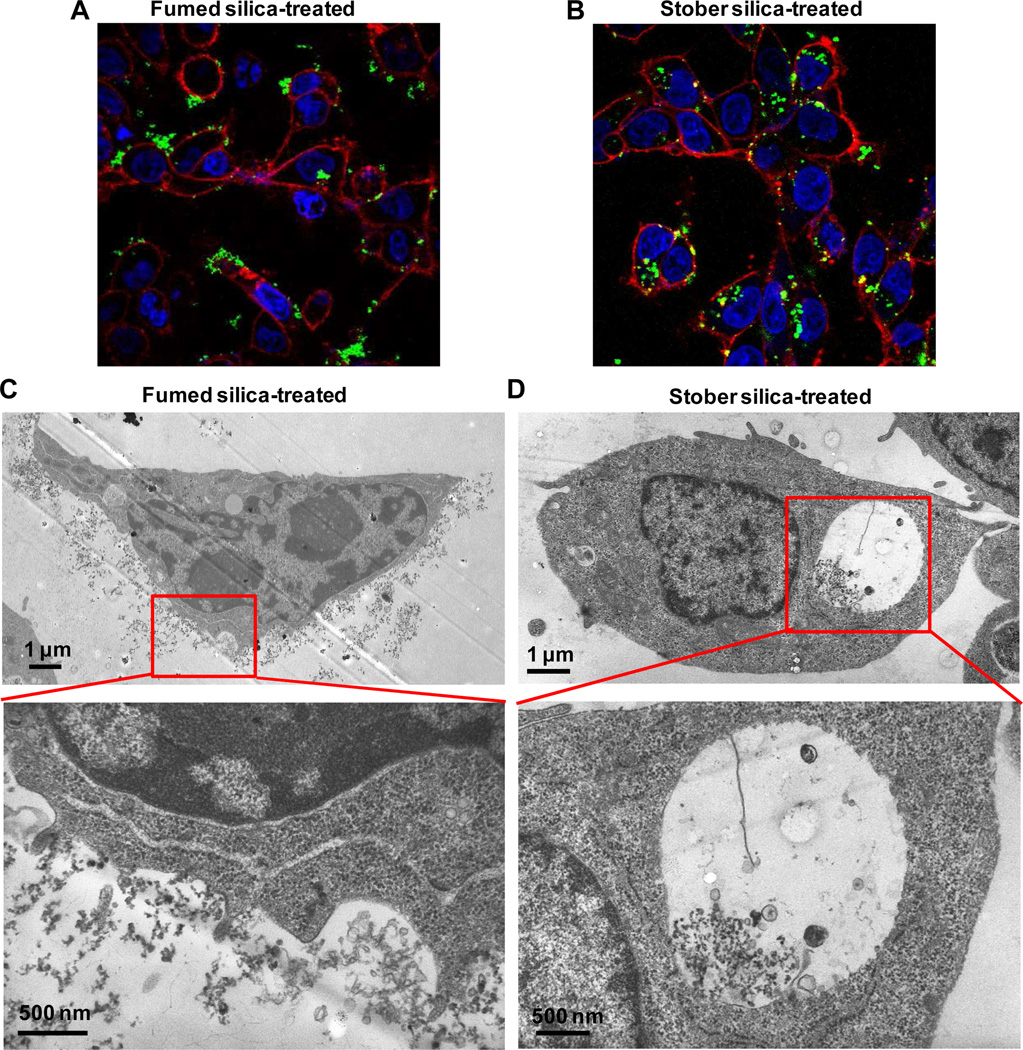
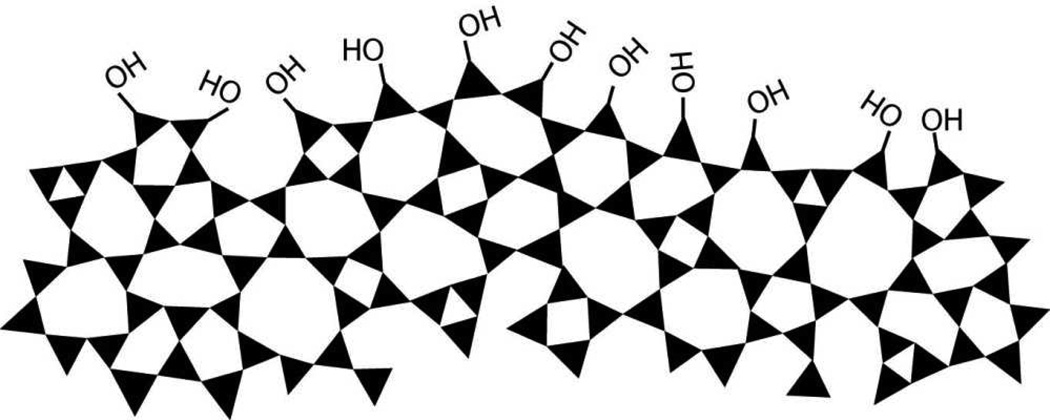
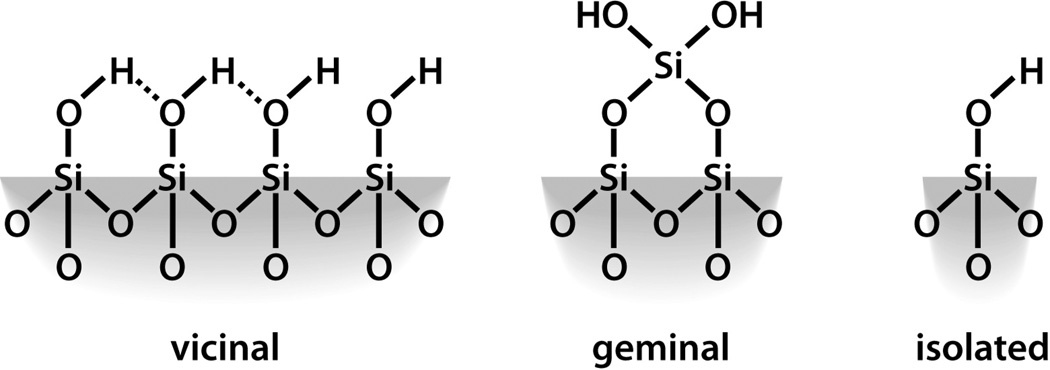
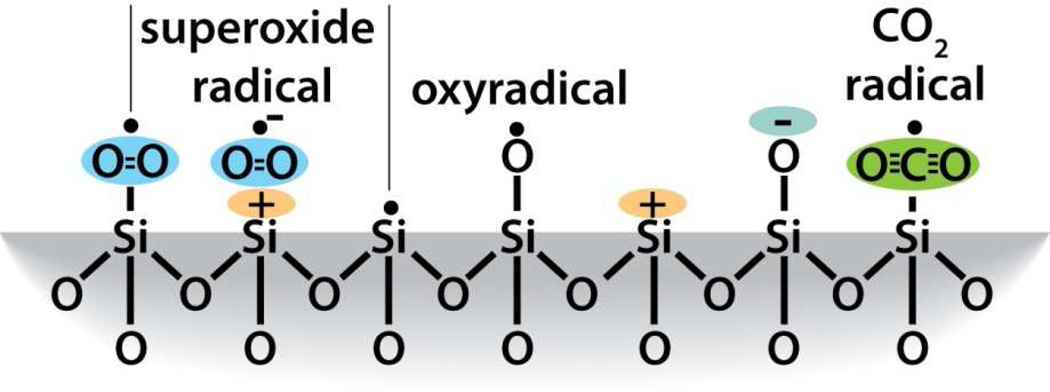
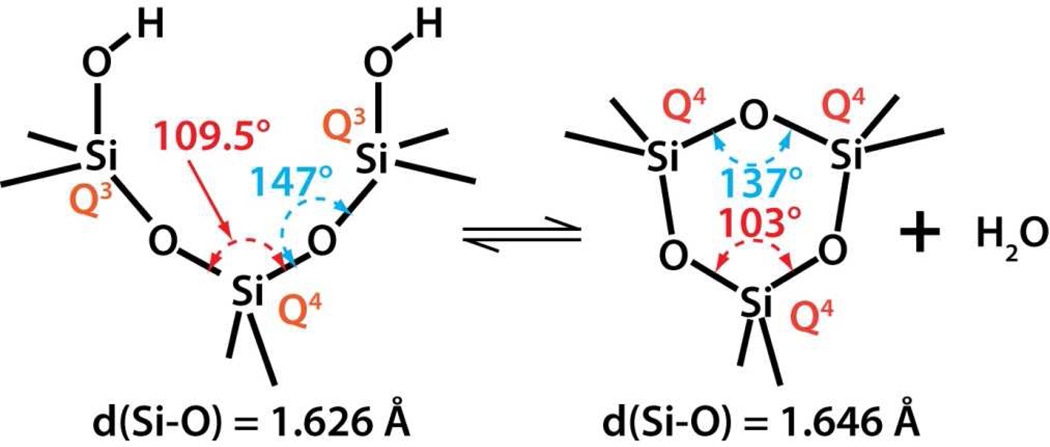
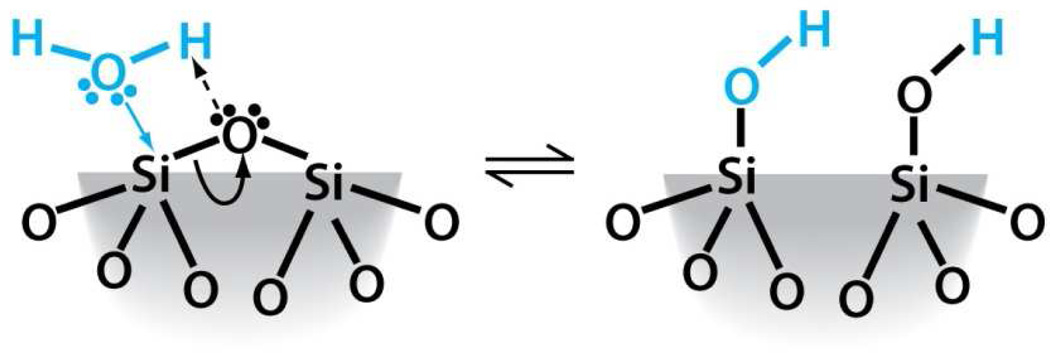
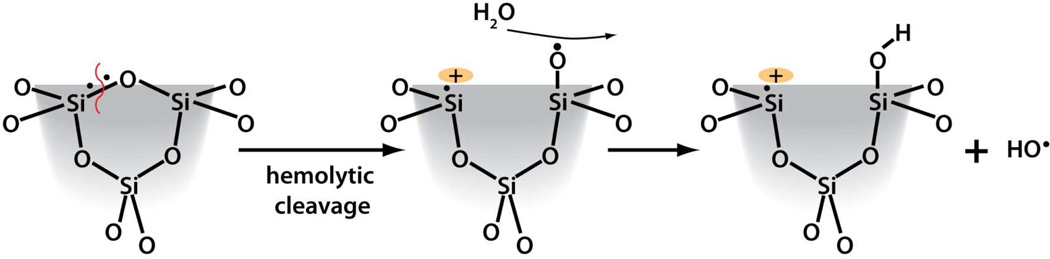
We have developed structure/toxicity relationships for amorphous silica nanoparticles (NPs) synthesized through low-temperature colloidal (e.g., Stöber silica) or high-temperature pyrolysis (e.g., fumed silica) routes. Through combined spectroscopic and physical analyses, we have determined the state of aggregation, hydroxyl concentration, relative proportion of strained and unstrained siloxane rings, and potential to generate hydroxyl radicals for Stöber and fumed silica NPs with comparable primary particle sizes (16 nm in diameter). On the basis of erythrocyte hemolytic assays and assessment of the viability and ATP levels in epithelial and macrophage cells, we discovered for fumed silica an important toxicity relationship to postsynthesis thermal annealing or environmental exposure, whereas colloidal silicas were essentially nontoxic under identical treatment conditions. Specifically, we find for fumed silica a positive correlation of toxicity with hydroxyl concentration and its potential to generate reactive oxygen species (ROS) and cause red blood cell hemolysis. We propose fumed silica toxicity stems from its intrinsic population of strained three-membered rings (3MRs) along with its chainlike aggregation and hydroxyl content. Hydrogen-bonding and electrostatic interactions of the silanol surfaces of fumed silica aggregates with the extracellular plasma membrane cause membrane perturbations sensed by the Nalp3 inflammasome, whose subsequent activation leads to secretion of the cytokine IL-1β. Hydroxyl radicals generated by the strained 3MRs in fumed silica, but largely absent in colloidal silicas, may contribute to the inflammasome activation. Formation of colloidal silica into aggregates mimicking those of fumed silica had no effect on cell viability or hemolysis. This study emphasizes that not all amorphous silicas are created equal and that the unusual toxicity of fumed silica compared to that of colloidal silica derives from its framework and surface chemistry along with its fused chainlike morphology established by high-temperature synthesis (>1300 °C) and rapid thermal quenching.


Figures

Figure 1
Figure 1. TEM images
A) Stöber silica colloidal silica NPs; B) “as-received” fumed silica NP aggregates; C) “As-prepared” Stöber silica NPs aggregated by 0.1M NaOH and aged at pH 2 for 12 hours at room temperature.
Figure 2
Figure 2. Physical and spectroscopic characterization of ca. 16 nm amorphous fumed and Stöber silica nanoparticles
A) Small-angle neutron scattering (SANS) analysis of fumed and Stöber silica structure as a function of processing, with the slope of the scattering curve at low and high q indicative of aggregate and individual particle morphology, respectively. For fumed silica, the crossover is the point of transition between these two regions. Instead of a crossover, Stöber silica exhibits a scattering peak indicative of monodisperse nanoparticles, with the particle diameter indicated by the q position of this feature. B) Raman spectroscopy of silica samples used to examine the relative concentration of four and three membered ring structures. The top panel illustrates a sample peak fit of a typical spectrum, while the bottom panels show data for fumed and Stöber silica as a function of processing, normalized using the peak area of the Si-O-Si band at ca. 800 cm−1. C) FTIR analysis of silanol concentration in fumed and Stöber silica using vibrational bands at ca. 3745 cm−1 (non-hydrogen bonded silanols only) and 4500 cm−1 (total silanol population), including representative spectra obtained as a function of material processing (legend at bottom of plot).
Figure 3
Figure 3. Comparison of physicochemical data for Stöber and fumed silica “as-received” or “as-prepared” (No treatment column) and after heat treatments up to 800°C followed by rehydration (hydrolyzed column)
A) Surface areas obtained using BET analysis of nitrogen adsorption data, B) silanol concentration calculated through the integration of the FTIR bands at ca. 3750 cm−1 (isolated) and 4500 cm−1 (total silanols). Hydrogen-bonded silanols are calculated by difference. C) Relative four and three membered ring concentration in silica samples obtained from peak fitting of Raman data and normalization to the 800 cm−1 band attributable to the total siloxane content. D) EPR data, normalized to sample surface area, of spin trap/silica solutions used to measure relative efficiency of hydroxyl radical generation. Yellow dots show hydroxyl concentrations and Raman data for colloidal silica aggregates.
Figure 4
Figure 4. Toxicity profiles of different amorphous and crystalline silica nanoparticles
A) Cytotoxicity of silica nanoparticles assessed in BEAS-2B cells. Cell death, cell viability and ATP level were determined by LDH, MTS and ATP single-parameter assays and shown in left, middle and right hand panels, respectively. This experiment was performed by introducing a wide dose range (400 µg/mL – 200 µg/mL) of each material to 10,000 cells grown in 96-well plates overnight and then performing the assays with commercial kits as described in Materials and Methods. B) Heat maps to compare the toxic oxidative stress potential of silica nanoparticles in BEAS-2B cells using the multi-parameter HTS assay. The heat maps were established using SSMD statistical analysis to evaluate the supra-threshold cellular responses by automated epifluorescence microscopy. The response parameters included measurement of intracellular calcium flux (Fluo-4), ROS generation (MitoSox Red and DCF) and mitochondrial membrane depolarization (JC-1). Cells were treated with a wide dose range of silica nanoparticles, beginning at 400 µg/ml and then doubling the dose up to 200 µg/mL. Epifluorescence images were collected hourly for the first 6 h and then again that 24 h. C) Hemolysis activity of silica nanoparticles. Mouse red blood cells were exposed to silica nanoparticles for 3 hours, and the released hemoglobin from cells appears as red color in the supernatant. D) Quantitative analysis of the percentage of released hemoglobin as shown in C). The released hemoglobin was determined through measuring the absorbance of the supernatant at 541 nm, and the percentage of the released hemoglobin was calculated as described in “Materials and methods”. *p < 0.05 compared with control.
Figure 5
Figure 5. Toxicity profiles of fumed and Stöber silica nanoparticles processed under different conditions
A) Cytotoxicity assessment of a series of fumed silica (left hand panel) and Stöber silica (right hand panel) nanoparticles in BEAS-2B cells. Cells were treated with a wide dose range (400 ng/mL – 200 µg/mL) of nanoparticles for 24 hours, and cell viability was assessed by the MTS assay. Nanoparticles calcined at 600 or 800°C were synthesized by heat treatment at the respective temperatures for 6 hours followed by redispersion. Rehydrated nanoparticles were synthesized by refluxing 800°C-treated nanoparticles in water for 24 hours. Aggregated samples (Figure. 1C) were prepared by electrostatic destabilization of the parent Stöber silica NPs. B) Hemolysis activity of a series of fumed and Stöber silica NPs. Mouse red blood cells were exposed to “as-received” or “as-prepared” calcined and rehydrated fumed silica or Stöber silica for 3 hours. Released hemoglobin appears as red color in the supernatant. C) Quantitative analysis of the percentage of released hemoglobin as shown in B). The released hemoglobin was determined through measuring the absorbance of the supernatant at 541 nm, and the percentage of the released hemoglobin was calculated as described in “Materials and methods”. * and # are defined as p < 0.05 compared with data of samples calcined at 600 or 800 °C, respectively, at the same doses.
Figure 6
Figure 6. Potential toxicity mechanism of fumed silica
A) Different IL-1β induction by fumed and Stöber silica processed under different conditions in THP-1 cells. The PMA-differentiated THP-1 cells were treated with a wide dose range (400 ng/mL – 200 µg/mL) of nanoparticles for 24 hours, and the generated IL-1β was determined through an ELISA assay. * and # are defined as p < 0.05 compared with data of samples calcined at 600 or 800 °C, respectively, at the same doses. B) Low IL-1β induction by fumed silica in Nalp 3- and ASC-knock down THP-1 cells. The PMA-differentiated THP-1, Nalp-3-knock down THP-1 and ASC-knock down THP-1 cells were treated with 25µg/mL of fumed silica for 24 hours, and the generated IL-1β was determined through an ELISA assay. Monosodium urate crystals (MSU) were used as a positive control. *p < 0.01 compared with the values in THP-1. C) Confocal microscopy images showing cathepsin B lysosomal release in THP-1 cells. The PMA-differentiated THP-1 cells were treated with 25 µg/mL of nanomaterials for 5 hours, and cathepsin B, cell membrane, and nuclei were stained with Magic Red ™, Alexa 488-conjugated wheat germ agglutinin (WGA) and Hoechst 33342, respectively. Cathepsin B in in tact lysosomes exhibits punctate red fluorescence as shown in untreated, Stöber silica-treated and fumed silica-treated cells, while damaged lysosomes led to cathepsin B release into the cytosol, evident as diffuse red fluorescence, in carbon nanotube (AP CNT)- treated, TiO2 nanobelt-treated and CeO2 nanowire-treated positive control cells.
Figure 7
Figure 7. Differential cellular distribution of fumed and Stöber silica NPs in BEAS-2B cells
A) Confocal microscope image of fumed silica-treated cells; B) Confocal microscope image of Stöber silica-treated cells; C) TEM image of fumed silica-treated cells; D) TEM image of Stöber silica-treated cells. For confocal microscope images, BEAS-2B cells were treated with 25 μg/mL FITC-labeled fumed or Stöber silica for 5 hours. After fixation, cell membrane was stained by Alexa Fluor 594-conjugated WGA to show red fluorescence while nuclei were stained with Hoechst 33342 to show blue fluorescence. Most green fluorescent FITC-labeled fumed silica NPs appear adherent to the cell membrane, while most FITC-labeled Stöber silica NPs appear internalized. For TEM images, BEAS-2B cells were treated with 25 μg/mL fumed or Stöber silica for 5 hours. Representative TEM images showed that most fumed silica NPs were found adherent to the cell membrane while most Stöber silica NPs were found to be internalized into cells.
Scheme 1
Scheme 1
Schematic depicting the ring structure of amorphous silica and the amorphous silica surface after equilibration with hydroxyl groups.
Scheme 2
Scheme 2
Types of silanol groups that can exist on the amorphous silica surface.
Scheme 3
Scheme 3
Radicals that can exist on the amorphous silica surface.
Scheme 4
Scheme 4
The formation of strained three-membered siloxane rings on the silica surface via thermallypromoted dehydroxylation.
Scheme 5
Scheme 5
Siloxane bond hydrolysis via dissociative chemisorption of water
Scheme 6
Scheme 6
A proposed reaction pathway for the generation of ROS from 3MRs.

References

    1. Lutgens FK, Tarbuck EJ. Essentials of Geology. 7th ed. Prentice Hall; 2000.
    1. Brinkmann U, Ettlinger M, Kerner D, Schmoll R. In: Colloidal Silica: Fundamentals and Applications. Bergna HE, Roberts WO, editors. Hoboken, NJ: CRC Press; 2005. pp. 575–588.
    1. Pratsinis S. Progress in Energy and Combustion Science. 1998;24:197–219.
    1. Brinker CJ, Scherer GW. Sol-Gel Science: The Physics and Chemistry of Sol-Gel Processing. San Diego, CA: Academic Press; 1990.
    1. Iler RK. The Chemistry of Silica. New York: John Wiley and Sons; 1979.

Publication types