

Acetate reduces microglia inflammatory signaling in vitro
- PMID: 22924711
- PMCID: PMC3472042
- DOI: 10.1111/j.1471-4159.2012.07955.x
Acetate reduces microglia inflammatory signaling in vitro
Abstract
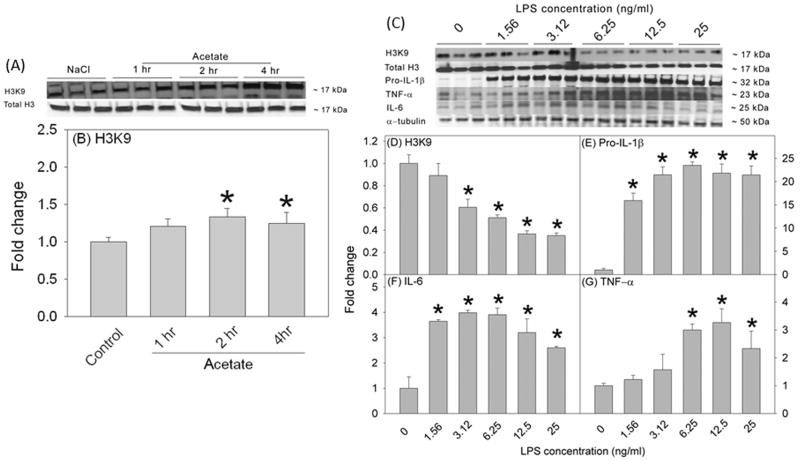
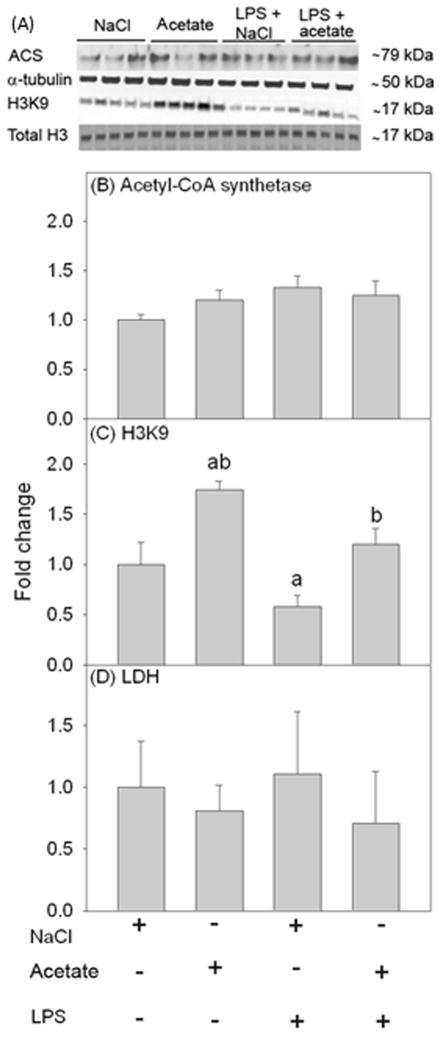
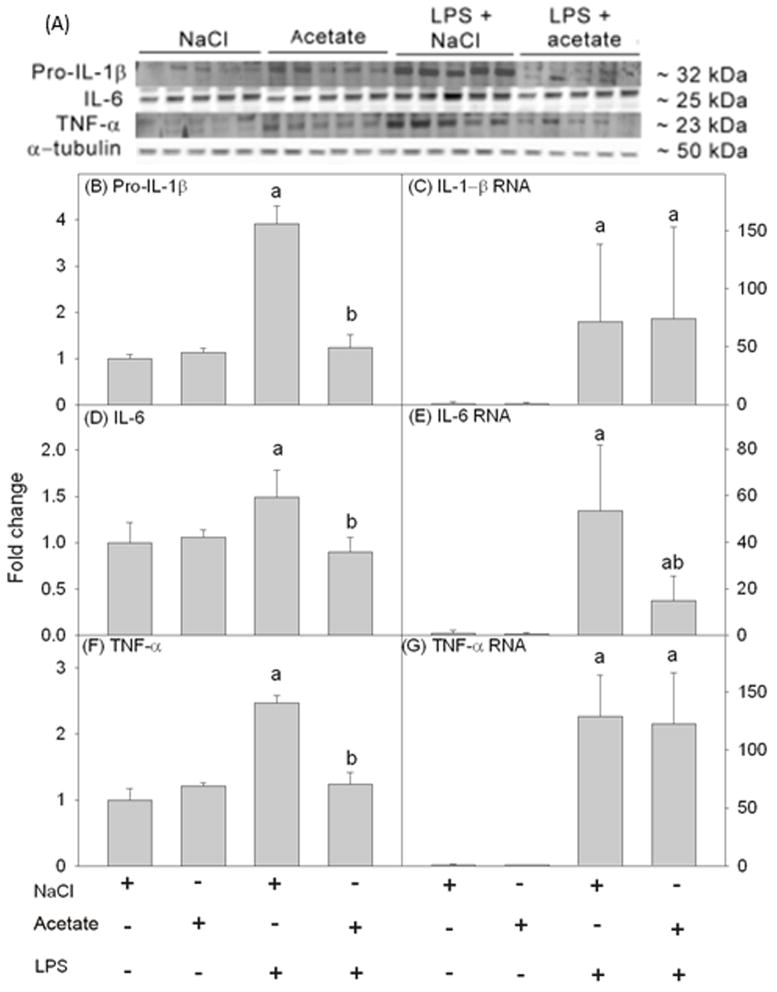
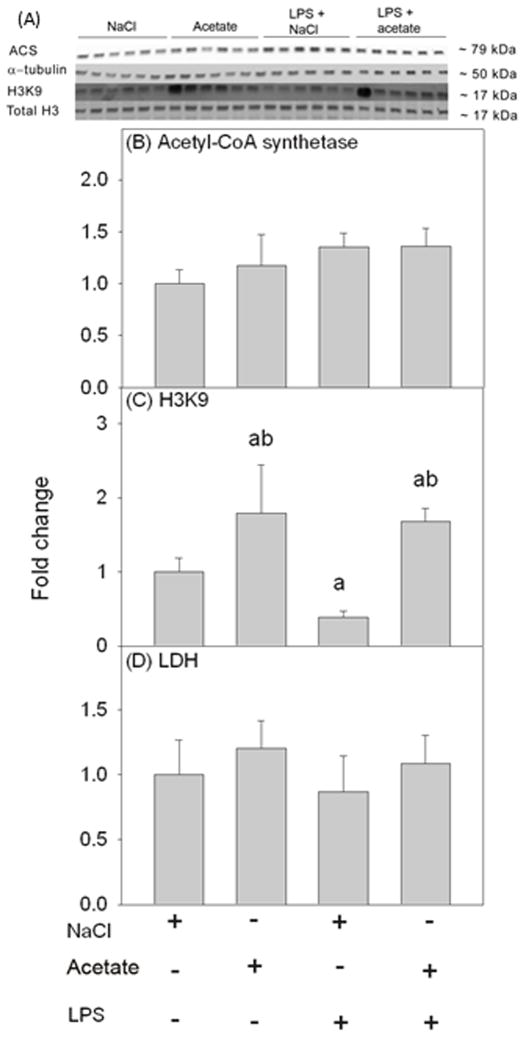
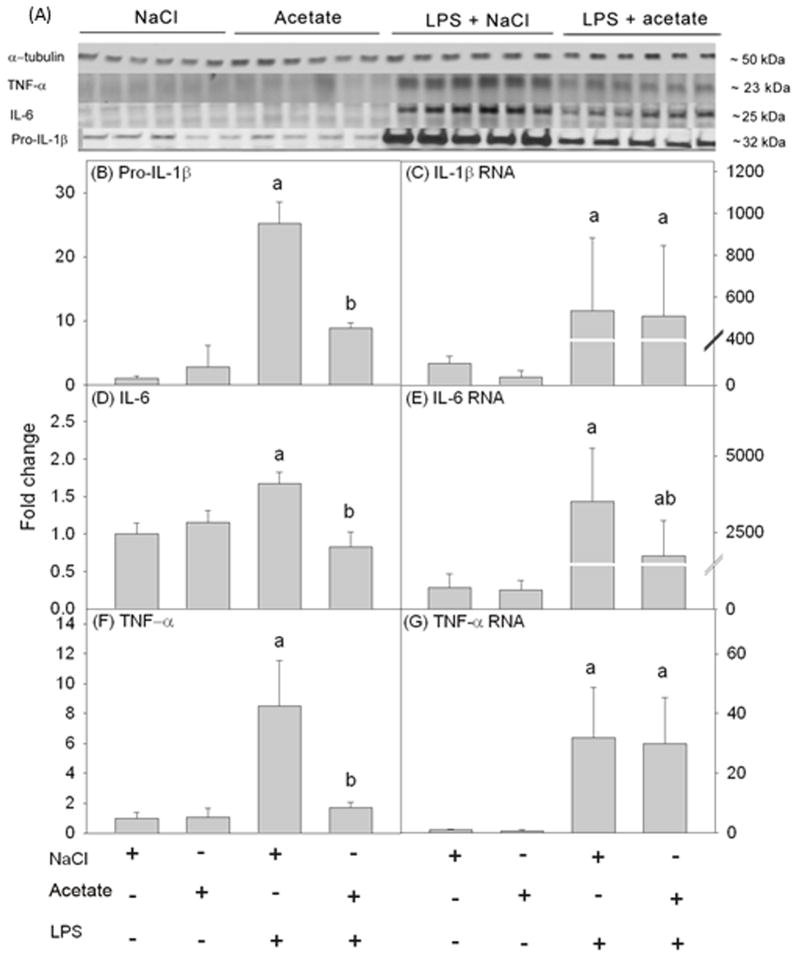
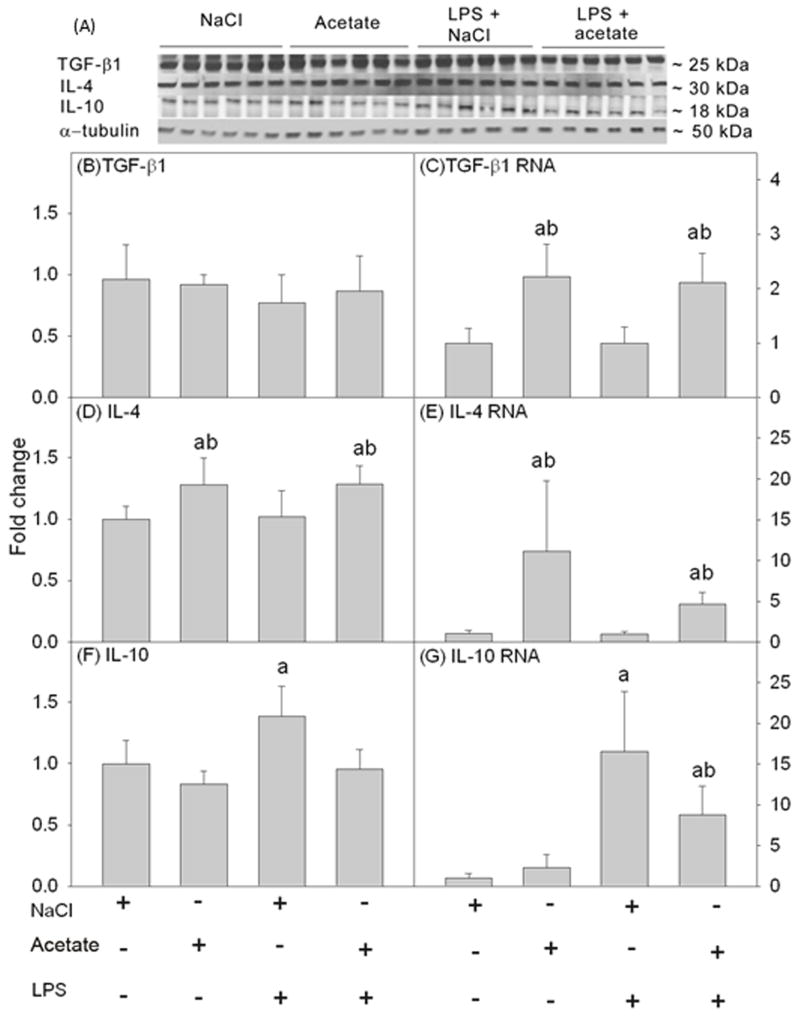
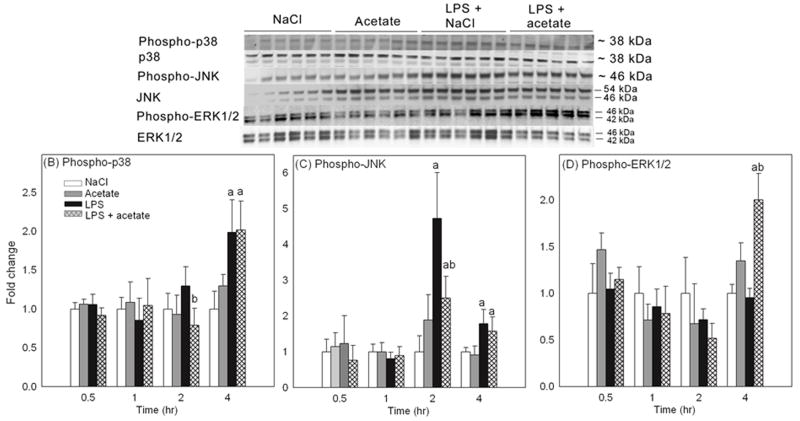
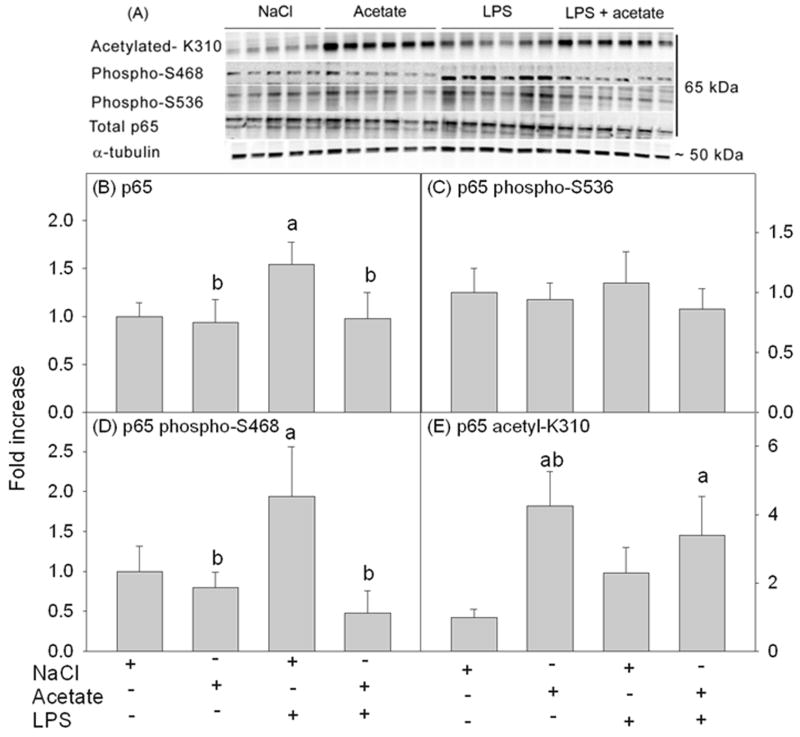
Acetate supplementation increases brain acetyl-CoA and histone acetylation and reduces lipopolysaccharide (LPS)-induced neuroglial activation and interleukin (IL)-1β expression in vivo. To determine how acetate imparts these properties, we tested the hypothesis that acetate metabolism reduces inflammatory signaling in microglia. To test this, we measured the effect acetate treatment had on cytokine expression, mitogen-activated protein kinase (MAPK) signaling, histone H3 at lysine 9 acetylation, and alterations of nuclear factor-kappa B (NF-κB) in primary and BV-2 cultured microglia. We found that treatment induced H3K9 hyperacetylation and reversed LPS-induced H3K9 hypoacetylation similar to that found in vivo. LPS also increased IL-1β, IL-6, and tumor necrosis factor-alpha (TNF-α) mRNA and protein, whereas treatment returned the protein to control levels and only partially attenuated IL-6 mRNA. In contrast, treatment increased mRNA levels of transforming growth factor-β1 (TGF-β1) and both IL-4 mRNA and protein. LPS increased p38 MAPK and JNK phosphorylation at 4 and 2-4 h, respectively, whereas treatment reduced p38 MAPK and JNK phosphorylation only at 2 h. In addition, treatment reversed the LPS-induced elevation of NF-κB p65 protein and phosphorylation at serine 468 and induced acetylation at lysine 310. These data suggest that acetate metabolism reduces inflammatory signaling and alters histone and non-histone protein acetylation.
© 2012 The Authors Journal of Neurochemistry © 2012 International Society for Neurochemistry.
Conflict of interest statement
The authors declare no conflict of interests.
Figures
Similar articles
-
Modulation of inflammatory cytokines and mitogen-activated protein kinases by acetate in primary astrocytes.J Neuroimmune Pharmacol. 2013 Mar;8(1):287-300. doi: 10.1007/s11481-012-9426-4. Epub 2012 Dec 12. J Neuroimmune Pharmacol. 2013. PMID: 23233245 Free PMC article.
-
Acetate reduces PGE2 release and modulates phospholipase and cyclooxygenase levels in neuroglia stimulated with lipopolysaccharide.Lipids. 2013 Jul;48(7):651-62. doi: 10.1007/s11745-013-3799-x. Epub 2013 May 25. Lipids. 2013. PMID: 23709104 Free PMC article.
-
Gastrodin inhibits expression of inducible NO synthase, cyclooxygenase-2 and proinflammatory cytokines in cultured LPS-stimulated microglia via MAPK pathways.PLoS One. 2011;6(7):e21891. doi: 10.1371/journal.pone.0021891. Epub 2011 Jul 12. PLoS One. 2011. PMID: 21765922 Free PMC article.
-
Resveratrol inhibits inflammatory responses via the mammalian target of rapamycin signaling pathway in cultured LPS-stimulated microglial cells.PLoS One. 2012;7(2):e32195. doi: 10.1371/journal.pone.0032195. Epub 2012 Feb 21. PLoS One. 2012. PMID: 22363816 Free PMC article.
-
Sulforaphane attenuates microglia-mediated neuronal necroptosis through down-regulation of MAPK/NF-κB signaling pathways in LPS-activated BV-2 microglia.Pharmacol Res. 2018 Jul;133:218-235. doi: 10.1016/j.phrs.2018.01.014. Epub 2018 Jan 31. Pharmacol Res. 2018. PMID: 29391237
Cited by
-
Gut Microbiota in Ischemic Stroke: Role of Gut Bacteria-Derived Metabolites.Transl Stroke Res. 2023 Dec;14(6):811-828. doi: 10.1007/s12975-022-01096-3. Epub 2022 Oct 24. Transl Stroke Res. 2023. PMID: 36279071 Review.
-
Sodium Butyrate Alleviates Lipopolysaccharide-Induced Inflammatory Responses by Down-Regulation of NF-κB, NLRP3 Signaling Pathway, and Activating Histone Acetylation in Bovine Macrophages.Front Vet Sci. 2020 Nov 5;7:579674. doi: 10.3389/fvets.2020.579674. eCollection 2020. Front Vet Sci. 2020. PMID: 33251265 Free PMC article.
-
Effect of melatonin on gut microbiome and metabolomics in diabetic cognitive impairment.Front Pharmacol. 2024 Nov 21;15:1489834. doi: 10.3389/fphar.2024.1489834. eCollection 2024. Front Pharmacol. 2024. PMID: 39640487 Free PMC article.
-
Methanolic leaf extract of Punica granatum attenuates ischemia-reperfusion brain injury in Wistar rats: Potential antioxidant and anti-inflammatory mechanisms.Iran J Basic Med Sci. 2019 Feb;22(2):187-196. doi: 10.22038/ijbms.2018.30660.7389. Iran J Basic Med Sci. 2019. PMID: 30834085 Free PMC article.
-
Metabolic Profiling of Praziquantel-mediated Prevention of Opisthorchis viverrini-induced Cholangiocyte Transformation in the Hamster Model of Cholangiocarcinoma.Cancer Genomics Proteomics. 2021 Jan-Feb;18(1):29-42. doi: 10.21873/cgp.20239. Cancer Genomics Proteomics. 2021. PMID: 33419894 Free PMC article.
References
-
- Annunziato AT, Eason MB, Perry CA. Relationship between methylation and acetylation of arginine-rich histones in cycling and arrested HeLa cells. Biochemistry. 1995;34:2916–2924. - PubMed
Publication types
MeSH terms
Substances
Grants and funding
LinkOut - more resources
Full Text Sources
Research Materials
