. 2013 Feb;168(3):704-17.
doi: 10.1111/j.1476-5381.2012.02182.x.

NF-κB-dependent IL-8 induction by prostaglandin E(2) receptors EP(1) and EP(4)

Affiliations

NF-κB-dependent IL-8 induction by prostaglandin E(2) receptors EP(1) and EP(4)

F Neuschäfer-Rube et al. Br J Pharmacol. 2013 Feb.

Abstract

Background and purpose: Recent studies suggested a role for PGE(2) in the expression of the chemokine IL-8. PGE(2) signals via four different GPCRs, EP(1) -EP(4) . The role of EP(1) and EP(4) receptors for IL-8 induction was studied in HEK293 cells, overexpressing EP(1) (HEK-EP(1) ), EP(4) (HEK-EP(4) ) or both receptors (HEK-EP(1) + EP(4) ).

Experimental approach: IL-8 mRNA and protein induction and IL-8 promoter and NF-κB activation were assessed in EP expressing HEK cells.

Key results: In HEK-EP(1) and HEK-EP(1) + EP(4) but not HEK or HEK-EP(4) cells, PGE(2) activated the IL-8 promoter and induced IL-8 mRNA and protein synthesis. Stimulation of HEK-EP(1) + EP(4) cells with an EP(1) -specific agonist activated IL-8 promoter and induced IL-8 mRNA and protein, whereas a specific EP(4) agonist neither activated the IL-8 promoter nor induced IL-8 mRNA and protein synthesis. Simultaneous stimulation of HEK- EP(1) + EP(4) cells with both agonists activated IL-8 promoter and induced IL-8 mRNA to the same extent as PGE(2) . In HEK-EP(1) + EP(4) cells, PGE(2) -mediated IL-8 promoter activation and IL-8 mRNA induction were blunted by inhibition of IκB kinase. PGE(2) activated NF-κB in HEK-EP(1) , HEK-EP(4) and HEK-EP(1) + EP(4) cells. In HEK-EP(1) + EP(4) cells, simultaneous activation of both receptors was needed for maximal PGE(2) -induced NF-κB activation. PGE(2) -stimulated NF-κB activation by EP(1) was blocked by inhibitors of PLC, calcium-signalling and Src-kinase, whereas that induced by EP(4) was only blunted by Src-kinase inhibition.

Conclusions and implications: These findings suggest that PGE(2) -mediated NF-κB activation by simultaneous stimulation of EP(1) and EP(4) receptors induces maximal IL-8 promoter activation and IL-8 mRNA and protein induction.


Figures

Figure 1
Figure 1
PGE2 induces IL-8 protein and mRNA synthesis and IL-8 promoter activation in HEK-EP1 but not in HEK or HEK-EP4 cells. HEK, HEK-EP1 and HEK-EP4 cells were stimulated with 1 μM PGE2 or 50 ng mL−1 TNFα for 20 h. For IL-8 promoter activation studies, cells were transfected with an IL-8 minimal promoter luciferase reporter gene plasmid before stimulation. (A) IL-8 protein: IL-8 released in the medium was measured by ELISA. Data shown are means ± SEM of three independent experiments performed in triplicate. Statistics: Student's t-test for unpaired samples. a: significantly higher than control (P < 0.05). (B) IL-8 mRNA: IL-8 mRNA content was measured by qPCR as described in the Methods section with GAPDH as reference gene. Data shown are means ± SEM of four independent experiments performed in triplicate. Statistics: Student's t-test for unpaired samples. a: significantly higher than control (P < 0.05). (C) IL-8 promoter activity: luciferase activity was measured in lysates as described in the Method section. Luciferase activity in control samples of each cell line was set at100%. Data shown are means ± SEM of three to six independent experiments performed in triplicate. Statistics: Student's t-test for unpaired samples. a: significantly higher than control (P < 0.05).
Figure 2
Figure 2
Time-dependence of PGE2-induced IL-8 protein and mRNA synthesis and IL-8 promoter activation in HEK-EP1 + EP4 cells. HEK-EP1 + EP4 cells were stimulated with 1 μM PGE2 for the times indicated. For IL-8 promoter activation studies, cells were transfected with an IL-8 minimal promoter luciferase reporter gene plasmid before stimulation. (A) IL-8 protein: IL-8 released into the medium was measured by ELISA. (B) IL-8 mRNA: IL-8 mRNA content was measured by qPCR as described in the Methods section with GAPDH as reference gene. (C) IL-8 promoter activity: luciferase activity was measured in lysates as described in the Methods section. Luciferase activity in samples of cells treated with PGE2 for 20 h was set at100%. Data shown are means ± SEM of five independent experiments performed in triplicate. Statistics: Student's t-test for unpaired samples. a: significantly higher than control; b: significantly lower than 20 h PGE2 (P < 0.05).
Figure 3
Figure 3
Simultaneous activation of EP1 and EP4 is essential for maximal PGE2-stimulated IL-8 promoter activation and IL-8 mRNA and protein induction in HEK-EP1 + EP4 cells. HEK-EP1 + EP4 cells were stimulated with 1 μM PGE2 or 1 μM of the EP receptor specific agonists ONO-DI-004 (EP1) or ONO-AE1-329 (EP4) or a combination of both agonists for 20 h. For IL-8 promoter activation studies, cells were transfected with an IL-8 minimal promoter luciferase reporter gene plasmid before stimulation. (A) IL-8 protein: IL-8 released in the medium was measured by ELISA. Data shown are means ± SEM of three independent experiments performed in triplicate. Statistics: Student's t-test for unpaired samples. a: significantly higher than control and b: significantly lower than PGE2 (P < 0.05). (B) IL-8 mRNA: IL-8 mRNA content was measured by qPCR as described in the Methods section with GAPDH as reference gene. Data shown are means ± SEM of five independent experiments performed in triplicate. Statistics: Student's t-test for unpaired samples. a: significantly higher than control and b: significantly lower than PGE2 (P < 0.05). (C) IL-8 promoter activity: luciferase activity was measured in lysates as described in the Methods section. Luciferase activity in control samples of each cell line was set at100%. Data shown are means ± SEM of three to six independent experiments performed in triplicate. Statistics: Student's t-test for unpaired samples. a: significantly higher than control and b: significantly lower than PGE2 (P < 0.05).
Figure 4
Figure 4
PGE2-stimulated IL-8 promoter activation and IL-8 mRNA induction in HEK-EP1 + EP4 cells depend on NF-κB activation. HEK-EP1 + EP4 cells were stimulated with 1 μM PGE2 in the absence or presence of the I-κB inhibitor BMS-34551 (10 μM) for 20 h. For IL-8 promoter activation studies, cells were transfected with an IL-8 minimal promoter luciferase reporter gene plasmid before stimulation. (A) IL-8 mRNA: IL-8 mRNA content was measured by qPCR as described in the Methods section with GAPDH as reference gene. Data shown are means ± SEM of five independent experiments performed in triplicate. Statistics: Student's t-test for unpaired samples. a: significantly higher than control and b: significant lower than PGE2 (P < 0.05). (B) IL-8 promoter activity: luciferase activity was measured in lysates as described in the Methods section. Luciferase activity in control samples of each cell line was set at100%. Data shown are means ± SEM of three to six independent experiments performed in triplicate. Statistics: Student's t-test for unpaired samples. a: significantly higher than control and b: significantly lower than PGE2 (P < 0.05).
Figure 5
Figure 5
PGE2 binding to EP1 and EP4 leads to NF-κB activation. HEK, HEK-EP1 and HEK-EP4 cells (A) as well as HEK-EP1 + EP4 cells (B) were transfected with a reporter gene plasmid with firefly luciferase under the control of multiple NF-κB binding sites. After 20 h, cells were stimulated with 1 μM PGE2, 50 ng mL−1 TNFα or 1 μM of EP1 and EP4-specific agonists for a further 20 h. Luciferase activity was measured in lysates as described in the Methods section. Luciferase activity in control samples of each cell line was set at100%. Data shown are means ± SEM of three to six independent experiments performed in triplicate. Statistics: Student's t-test for unpaired samples. a: significantly higher than control and b: significantly lower than PGE2 (P < 0.05).
Figure 6
Figure 6
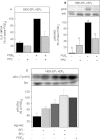
Requirement of simultaneous activation of EP1 and EP4 for maximal short-term activation of I-κB kinase (IKK) in HEK-EP1 + EP4 cells. HEK-EP1 + EP4 cells were incubated with 1 μM PGE2 for the times indicated (A) or with 1 μM PGE2 or receptor-specific agonists for 10 min (B). Proteins were extracted from cells with SDS sample buffer containing fluoride and vanadate to inhibit phosphatases. Phosphorylated and total IKKs were determined by Western blot using specific antibodies, peroxidase-coupled secondary antibodies and a luminogenic substrate. Band intensity was quantified luminometrically and expressed as ratio between phosphorylated and total protein. Values are means ± SEM of a minimum of three independent experiments. Statistics: Student's t-test for unpaired samples a: significantly higher than unstimulated control cells; b: significantly lower than cells stimulated with PGE2, P < 0.05. Representative blots are shown.
Figure 7
Figure 7
NF-κB activation by EP1 is dependent on PLC, Ca2+ signalling and Src but not on PKC. HEK-EP1 cells were transfected with a reporter gene plasmid with firefly luciferase under the control of multiple NF-κB binding sites. After 20 h, cells were stimulated with 1 μM PGE2 or 50 ng mL−1 TNFα in the absence or presence or of the PLC inhibitor U73122 (10 μM), the Ca2+ chelator EGTA (2 mM), the CaMKII inhibitor KN-62 (10 μM), the Src kinase inhibitor PP2 (10 μM) or the PKC inhibitor BIM (0.15 μM) for a further 16 h. Luciferase activity was measured in lysates as described in the Methods section. Luciferase activity in control samples of each cell line was set at 100%. Data shown are means ± SEM of three to six independent experiments performed in triplicate. Statistics: Student's t-test for unpaired samples. b: significantly lower than naive (P < 0.05).
Figure 8
Figure 8
NF-κB activation by EP1 and EP4 is dependent on Src but not on PKA or PI3K. HEK-EP1 + EP4 cells were transfected with a reporter gene plasmid with firefly luciferase under the control of multiple NF-κB binding sites. After 20 h, cells were stimulated with 1 μM PGE2 or EP1/EP4-specific agonists in the presence of the Src inhibitor PP2 (10 μM), the PKA inhibitor H89 (10 μM) or the PI3K inhibitor wortmannin (Wort; 0.1 μM) for a further 20 h. Luciferase activity was measured in lysates as described in the Methods section. Luciferase activity in control samples of each cell line was set at 100%. Data shown are means ± SEM of three to six independent experiments performed in triplicate. Statistics: Student's t-test for unpaired samples. b: significantly lower than naive (P < 0.05).
Figure 9
Figure 9
Involvement of PGE2-mediated activation of Src kinase in HEK-EP1 + EP4 cells in PGE2-dependent IL-8 induction. (A) HEK-EP1 + EP4 cells were stimulated with 1 μM PGE2 in the absence or presence of the Src kinase inhibitor PP2 (10 μM) for 20 h. IL-8 mRNA content was measured by qPCR as described in the Methods section with GAPDH as reference gene. (B and C): HEK-EP1 + EP4 cells were pre-incubated with PP2 (10 μM) for 1 h and subsequently stimulated with 1 μM PGE2 or receptor-specific agonists for 10 min. Proteins were extracted from cells with SDS sample buffer containing fluoride and vanadate to inhibit phosphatases. Phosphorylated and total IKKs (B) or Src kinase (C) were determined by Western blot using specific antibodies, peroxidase-coupled secondary antibodies and a luminogenic substrate. Band intensity was quantified luminometrically and expressed as ratio between phosphorylated and total protein. Values are means ± SEM of a minimum of three independent experiments. Statistics: Student's t-test for unpaired samples a: significantly higher than non-stimulated control cells; b: significant lower than cells stimulated with PGE2, P < 0.05. Representative blots are shown.
Figure 10
Figure 10
Model of PGE2/EP1 + EP4-mediated NF-κB activation and IL-8 induction. PGE2-bound EP1 activates PLC and/or Ca2+-channels in the plasma membrane by Gq and/or an as yet unknown G protein. This leads to a transient increase in intracellular Ca2+, that thereby activates CamKII. CamKII directly or indirectly via tyrosine kinase Src phosphorylates IKKs and signals I-κB degradation. Src-mediated IKK-phosphorylation is also triggered by PGE2-binding to the Gs-coupled EP4, which leads to maximal I-κB degradation. The released NF-κB translocates to the nucleus and promotes IL-8 transcription by binding to the IL-8 promoter.

Similar articles

Cited by

References

    1. Breyer RM, Bagdassarian CK, Myers SA, Breyer MD. Prostanoid receptors: subtypes and signaling. Annu Rev Pharmacol Toxicol. 2001;41:661–690. - PubMed
    1. Buchanan FG, Gorden DL, Matta P, Shi Q, Matrisian LM, DuBois RN. Role of beta-arrestin 1 in the metastatic progression of colorectal cancer. Proc Natl Acad Sci U S A. 2006;103:1492–1497. - PMC - PubMed
    1. Caristi S, Piraino G, Cucinotta M, Valenti A, Loddo S, Teti D. Prostaglandin E2 induces interleukin-8 gene transcription by activating C/EBP homologous protein in human T lymphocytes. J Biol Chem. 2005;280:14433–14442. - PubMed
    1. Dey I, Chadee K. Prostaglandin E2 produced by Entamoeba histolytica binds to EP4 receptors and stimulates interleukin-8 production in human colonic cells. Infect Immun. 2008;76:5158–5163. - PMC - PubMed
    1. Dey I, Giembycz MA, Chadee K. Prostaglandin E(2) couples through EP(4) prostanoid receptors to induce IL-8 production in human colonic epithelial cell lines. Br J Pharmacol. 2009;156:475–485. - PMC - PubMed

MeSH terms