. 2012 Aug 27:6:111.
doi: 10.1186/1752-0509-6-111.

Balancing speed and accuracy of polyclonal T cell activation: a role for extracellular feedback

Affiliations

Balancing speed and accuracy of polyclonal T cell activation: a role for extracellular feedback

Yonatan Savir et al. BMC Syst Biol. .

Abstract

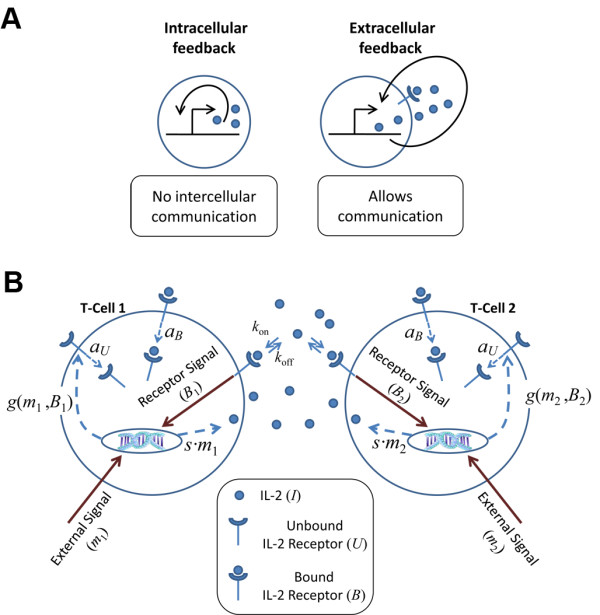
Background: Extracellular feedback is an abundant module of intercellular communication networks, yet a detailed understanding of its role is still lacking. Here, we study interactions between polyclonal activated T cells that are mediated by IL-2 extracellular feedback as a model system.

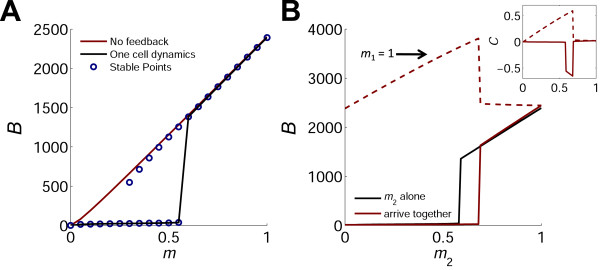
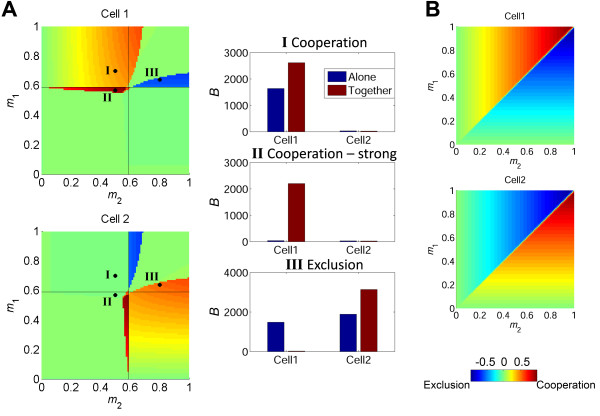
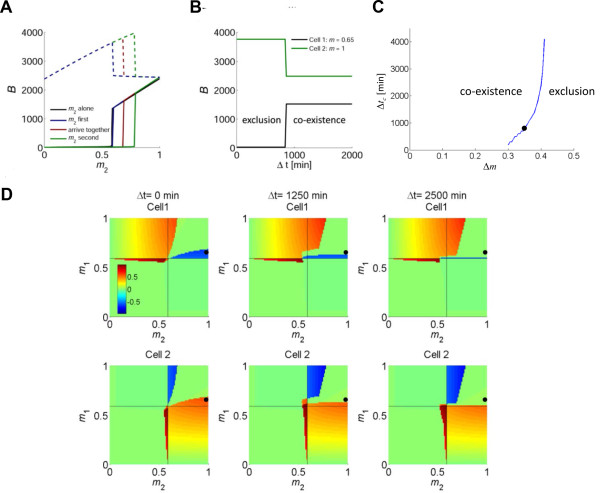
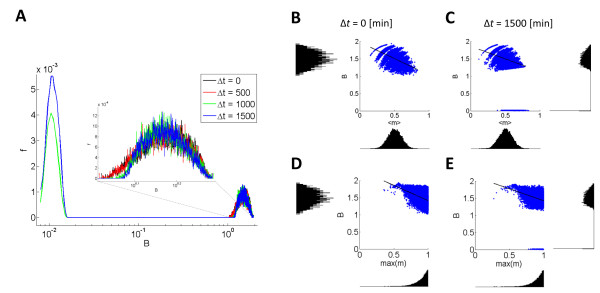
Results: Using mathematical modeling we show that extracellular feedback can give rise to opposite outcomes: competition or cooperation between interacting T cells, depending on their relative levels of activation. Furthermore, the outcome of the interaction also depends on the relative timing of activation of the cells. A critical time window exists after which a cell that has been more strongly activated nevertheless cannot exclude an inferior competitor.

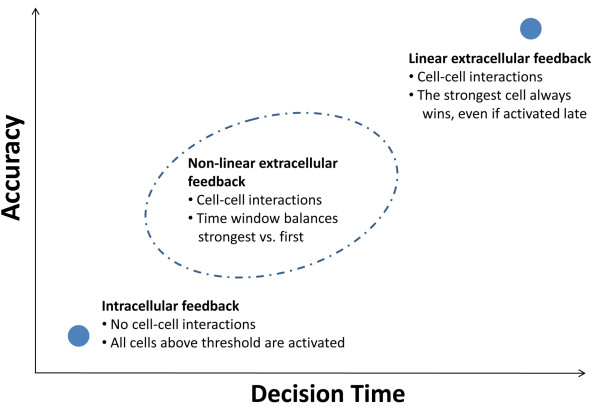
Conclusions: In a number of experimental studies of polyclonal T-cell systems, outcomes ranging from cooperation to competition as well as time dependent competition were observed. Our model suggests that extracellular feedback can contribute to these observed behaviors as it translates quantitative differences in T cells' activation strength and in their relative activation time into qualitatively different outcomes. We propose extracellular feedback as a general mechanism that can balance speed and accuracy - choosing the most suitable responders out of a polyclonal population under the clock of an escalating threat.


Figures

Figure 1
Figure 1
The extracellular feedback module. (A) Extracellular feedback allows for communication between cells. Intracellular feedback (left) relies on sensing a molecule’s level inside the cell. Extracellular feedback (right) relies on sensing the level of a molecule that is secreted to the environment, thus allowing neighboring cells to sense it and engage in the feedback themselves. Sensing the cell’s environment requires receptors, and thus the feedback can modulate the rate of production of the signaling molecule and/or its receptor. (B) Schematics of the IL-2 extracellular feedback system in T-cell activation. T-cells are activated through binding of the T-cell receptors (TCRs) by their cognate peptide-MHC complex. TCR binding induces signals with different strengths, depending on binding affinity and number of bound receptors. Activation signal strength is denoted by m1 and m2 for the two interacting cells. Following TCR signal, the cytokine IL-2 is secreted with a rate that is proportional to the TCR signal level (s·m). In the absence of IL-2, the unbound IL-2 receptor (IL-2R) is generated at a low constitutive rate and is internalized at a rate aU, thus is present in low numbers (~100 molecules per cell). The binding of IL-2 to its receptor causes up-regulation of IL-2R synthesis. The overall IL-2R production rate, g(m, B), depends on the TCR signal strength, m, and on the number of bound IL-2R, B. The IL-2R internalization rate is also increased upon binding of IL-2 (aB). The IL-2 molecule is released to the intercellular space and can be captured by any T-cell. Thus, two processes are in effect: autocrine and paracrine positive feedbacks. These processes allow two nearby T-cells, potentially with different TCR specificities, to communicate and influence each other.
Figure 2
Figure 2
Activation curves of one cell and of two interacting cells. (A) A single cell. The stable fixed points for the level of bound IL-2 receptor, B, were analytically calculated as a function of the TCR signal strength, m (blue circles). The system has two branches of stable solutions in an intermediate range of TCR signal strengths. The actual state of the system as calculated numerically (black line) exhibits a sharp transition between low and high levels of B when the TCR signal strength exceeds a threshold m value. Also shown is the response in the case of no feedback, where the induced synthesis rate of IL-2 receptors is constant (red line). In this case, the number of bound receptors increases linearly with m for almost all m values, and no threshold exists. (B) Two interacting cells. Red line: fixed points of B were calculated for a cell that is interacting with a strongly activated cell (m1 = 1). The black line is the same as in A (for one cell alone), shown for comparison. Due to the intercellular interaction, the activation curve of Cell2 shifts to the right and the threshold m level increases. The dashed red line shows the number of bound receptors of Cell1 which increases since it can utilize the IL-2 secreted by Cell2. Inset: The normalized interaction index, C (see text and Eq. 5) of the two cells. In the range where C2 = 0, Cell2 (black line) is indifferent to the presence of Cell1. Where C2< 0, Cell2 suffers from the interaction (competition and exclusion). In the range where C1> 0, Cell1 (dashed red line) benefits from the interaction (cooperation).
Figure 3
Figure 3
Extracellular non-linear positive feedback gives rise to cooperation and competition. (A) Left panel shows heat maps of the simulated normalized interaction index, C, for the entire range of activation signals (m1, m2) of two interacting cells. Color bar on the bottom right depicts C values. Different areas emerge, in which the cells cooperate or compete with each other over IL-2. The black lines show the threshold of activation for each cell if it was activated alone. Three representative scenarios are marked with a black dot and the corresponding B levels of the two interacting cells are shown in the right panel (red bars), compared to B levels when the cells are activated alone (blue bars). (I) Cell1, that would have been activated had it been alone, is activated alongside Cell2 which would not have passed the activation threshold had it been alone. In this case, the stronger cell utilizes the IL-2 of the weaker cell and increases its number of bound IL-2R. (II) Two cells that would not have been activated were they alone pool their IL-2 and as a result Cell1 that is activated more strongly is driven above threshold. (III) Two cells that are above threshold by their own are activated together. In this case, Cell2 that is activated more strongly depletes the IL-2 reservoir and thus pushes its neighbor beneath the activation threshold. (B) Simulated C values for two interacting cells in the case of a (hypothetical) linear feedback. In this case the interaction would always lead to mutual exclusion, resulting in the activation of the stronger cell (same color bar as in A).
Figure 4
Figure 4
Interaction outcome depends on the relative time of activation of the two cells. (A) The activation curve of a T-cell with varying m2 values that is activated before, alongside or after a strong T-cell, m1 = 1. The black line marks the activation curve for a single cell alone. The threshold m2 level depends on the order of activation. If Cell2 is activated markedly (2500 minutes) before Cell1, its activation curve does not change significantly (blue). However, if the two cells are activated together the activation curve shifts to the right and the threshold m value for Cell2 increases (red, similar to Figure 2B). Thirdly, if the order reverses and Cell1 is activated a long time (2500 minutes) before Cell2, the competition is increased and the activation threshold for Cell2 is shifted to even higher values. (B) Time dependent competition in a representative case (m1 = 0.65 and m2 = 1). Cell1 is activated at time 0, and after Δt minutes, Cell2 is activated. A critical time window for competition exists: if Cell2 (green line) is activated within the time window, it excludes the weaker Cell1 (black line). However, if Cell2 is activated after the window closes, it is unable to suppress Cell1, and the two coexist. (C) The length of the critical time window increases with the difference in activation strengths of the two cells. The line represent the calculated time window for exclusion, for the case of a cell with m1 = 0.65 activated at time 0, interacting with a stronger cell (m2 = m1+ Δm) that is activated later. The scenario shown in (B) is marked by a black dot. (D) Simulated normalized interaction index, C, of two interacting cells, for 3 different time delays: Cell2 is activated with a delay of Δt = 0, 1250, 2500 minutes after Cell1. Color bar is the same for all panels. Note changes in both competition and cooperation behaviors over time. For example, when Cell1 is above threshold, the ability of a stronger Cell2 to exclude it diminishes with time (top row, blue patch in upper right quadrant). The black dot marks the case of m1 = 0.65 and m2 = 1 that is illustrated in (B).
Figure 5
Figure 5
Interaction between multiple cells. (A) The distribution of bound IL-2R, B, of a cell with m = 1, Cell1, while interacting with 9 other cells with random m values. The number of IL-2R of Cell1 was normalized by its value when there is no interaction. Δt is the time difference between the activation of Cell1 and the random ensemble. When the time delay is short (black, red), Cell1 benefits from the interaction. However, when Cell1 is activated after a longer delay (green, blue), a bi-modal distribution emerges with an additional peak around very low values of B. Even the ‘strongest’ cell can be excluded if activated too late. The volume of interaction for this graph is 5 times the volume that was used for 2 cell interaction and thus the cell density is the same. The m values in each ensemble were randomly pulled out of a uniform distribution. Each distribution is the result of 10,000 runs. (B-E) The effect of ensemble composition on the response of Cell1. As the mean TCR strength of the competitors is larger (B, C) the amount of IL-2R of cell1 decreases. If the delay is long, exclusion may occur only if the mean m of the competing group is high enough (above ~ 0.5). On the top of it, the maximal competitor has to be strong enough (above ~ 0.75) for exclusion to occur (D, E).
Figure 6
Figure 6
Non linear extracellular feedback: a design principle that can balance speed and accuracy of a recognition system. Consider a system of cells that can be activated by recognition of a ligand. Each cell responds at a different level, depending on its specificity, and recognition threshold for cell activation is set through a positive feedback. Cells search for ligand and are thus activated in a random timing. We compare three cases: an intracellular feedback, a linear extracellular feedback and a non-linear extracellular feedback. In the case of an intracellular feedback (no intercellular communication), the system’s response is fast as every cell that passes the recognition threshold is activated. However, the response will be less specific, since all cells above threshold respond, not only the strongest ones (lower left point). In the case of a linear extracellular feedback, the strongest cell always wins, regardless of the time of its activation. In this case specificity of the system’s response is high, but time is lost until the strongest cell is activated, thus the response can be slow (upper right point). A non-linear extracellular feedback balances this tradeoff by opening a window of opportunity for competition. The strongest cell that arrives during this time window will win. The length of this time window is tunable, and depends on the relative activation levels of the interacting cells.

Similar articles

Cited by

References

    1. Sneppen K, Krishna S, Semsey S. Simplified Models of Biological Networks. Annual review of biophysics. 2010;39:43–59. doi: 10.1146/annurev.biophys.093008.131241. - DOI - PubMed
    1. Crespi BJ. Vicious circles: positive feedback in major evolutionary and ecological transitions. Trends in ecology & evolution (Personal edition) 2004;19:627–633. - PubMed
    1. Murray JD. In: Mathematical Biology. Third. Antman SS, Marsden JE, Sirovich L, Wiggins S, editor. Springer, New York; 2002. Biological Oscillators and Switches.
    1. Ozbudak EM, Thattai M, Lim HN, Shraiman BI, Van Oudenaarden A. Multistability in the lactose utilization network of Escherichia coli. Nature. 2004;427:737–740. doi: 10.1038/nature02298. - DOI - PubMed
    1. Brandman O, Meyer T. Feedback loops shape cellular signals in space and time. Science (New York, N.Y.) 2008;322:5. - PMC - PubMed

Publication types

MeSH terms

LinkOut - more resources