

Application of Variable Life Adjusted Displays (VLAD) on Victorian Admitted Episodes Dataset (VAED)
- PMID: 22925089
- PMCID: PMC3576249
- DOI: 10.1186/1472-6963-12-278
Application of Variable Life Adjusted Displays (VLAD) on Victorian Admitted Episodes Dataset (VAED)
Abstract
Background: The need to improve patient safety has been identified as a major priority for health reform in developed countries, including Australia. We investigated the implementation and appropriateness of Variable Life Adjusted Displays as a quality control procedure to monitor "in-control" versus "out-of-control" processes in Victorian public hospitals.
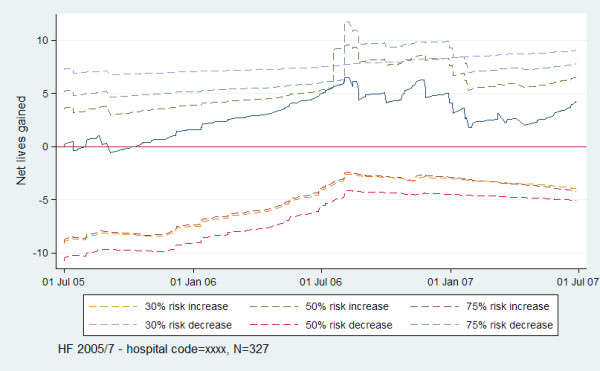
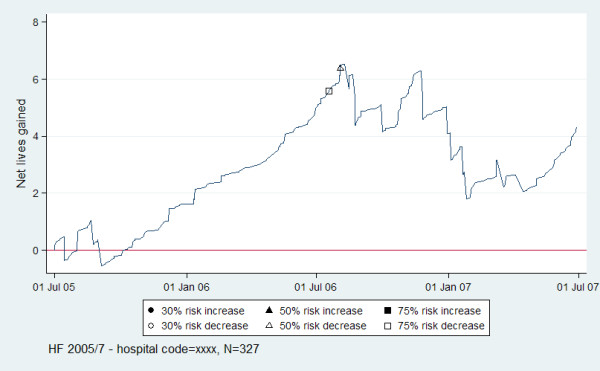
Methods: Victorian Admitted Episode Data from Department of Human Services, Victoria for 2004-7 were used. The VLAD is a plot of a cumulative sum of the difference in expected outcome (range 0-1) and observed outcome (0 or 1) for sequential separations. Three outcomes were assessed: in-hospital mortality for acute myocardial infarction, stroke and heart failure. Logistic regression was used to obtain a realistic measure of expected mortality over the period 2004-5, adjusting for covariates and comorbidities, to estimate expected mortality risk for the separations between 2005-7. VLAD were plotted for the years 2005-7, by the 11 hospitals with the highest frequency of separations. Signalling limits for 30%, 50% and 75% risk decrease and risk increase were determined and plotted for each VLAD utilizing risk-adjusted cumulative sum techniques. This is a likelihood-ratio test statistic for signalling. If the VLAD signalled by intersecting with a limit, the limit was reset.
Results: The three logit models displayed reasonable fit to the observed data. There were n = 2999 separations in the AMI model, n = 3598 in the HF model and n = 1922 in the stroke model. The number of separations plotted by VLAD ranged from n = 126 to n = 648. No signals were observed in 64%, 55% and 18% of VLAD for AMI, HF and stroke respectively. For AMI and HF 9% of hospitals signalled at least once for each of 30%, 50% and 75% risk increase, whereas this was 45% for stroke. Hospitals signalling at least once for risk decrease ranged from 18% to 36% across the levels of risk and outcomes. No VLAD signalled for both risk decrease and increase.
Conclusions: VLAD intersecting with limits to signal "out-of-control" states, may be an appropriate technique to help hospitals assess quality control. Preliminary work displays some between hospital differences. Relevant signals can be used to investigate why a system is potentially performing better than or worse than expected. Types and levels of investigation could depend on the type of signalling. Validation work, for example attempting to correlate signals with clinical notes, prior to VLAD distribution needs to be undertaken.
Figures
References
-
- Van Der Weyden MB. The Bundaberg Hospital scandal: the need for reform in Queensland and beyond [editorial] Medical Journal of Australia. 2005;183:284–285. - PubMed
-
- Shipman Inquiry: The First Report. http://www.shipman-inquiry.org.uk/images/firstreport/narrative/pdf/vol1.pdf]
MeSH terms
LinkOut - more resources
Full Text Sources
Research Materials
Miscellaneous
