. 2012 Aug 28:5:460.
doi: 10.1186/1756-0500-5-460.

Rapid phylogenetic and functional classification of short genomic fragments with signature peptides

Affiliations

Rapid phylogenetic and functional classification of short genomic fragments with signature peptides

Joel Berendzen et al. BMC Res Notes. .

Abstract

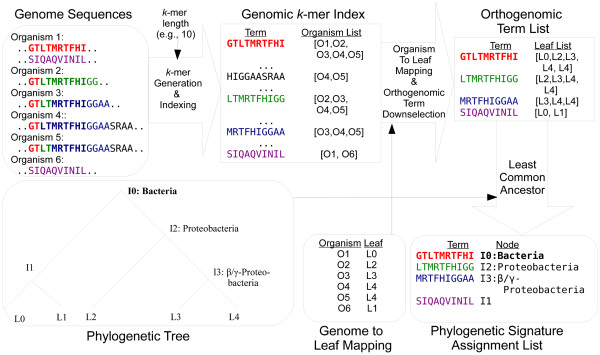
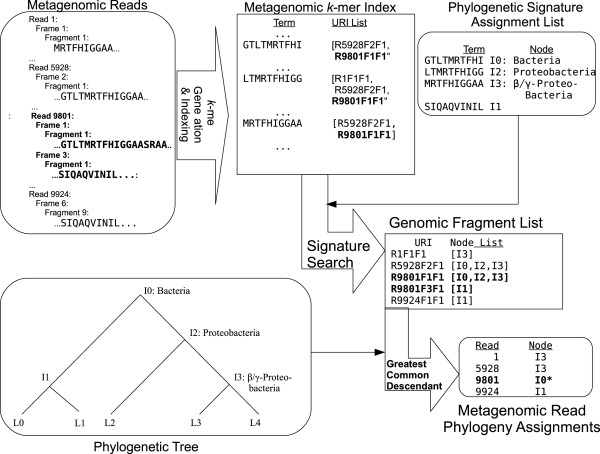
Background: Classification is difficult for shotgun metagenomics data from environments such as soils, where the diversity of sequences is high and where reference sequences from close relatives may not exist. Approaches based on sequence-similarity scores must deal with the confounding effects that inheritance and functional pressures exert on the relation between scores and phylogenetic distance, while approaches based on sequence alignment and tree-building are typically limited to a small fraction of gene families. We describe an approach based on finding one or more exact matches between a read and a precomputed set of peptide 10-mers.

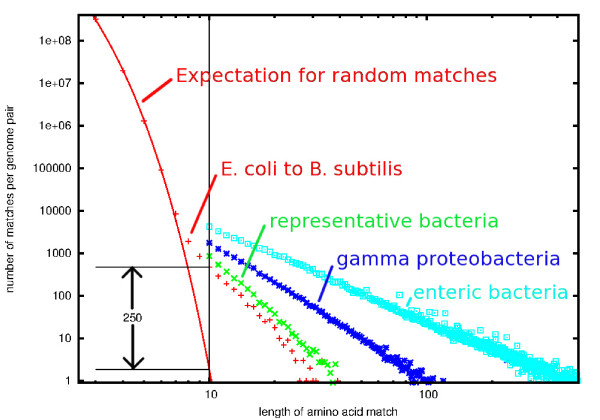
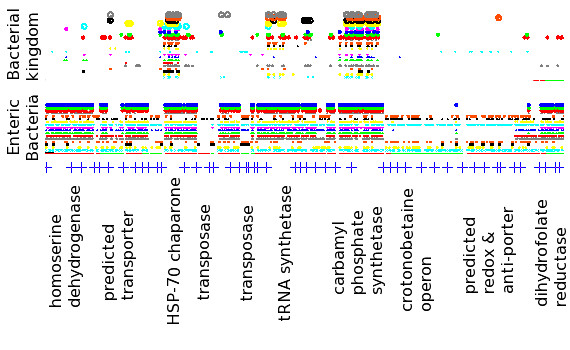
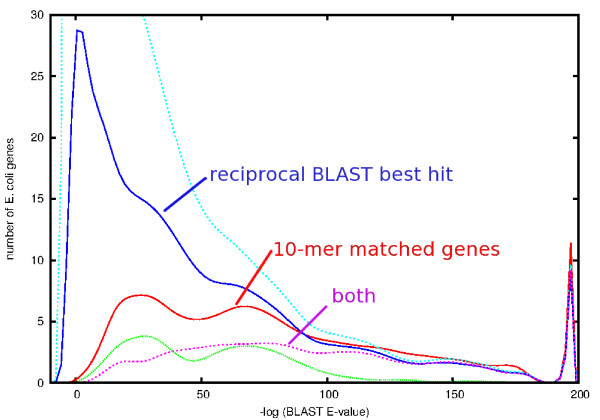
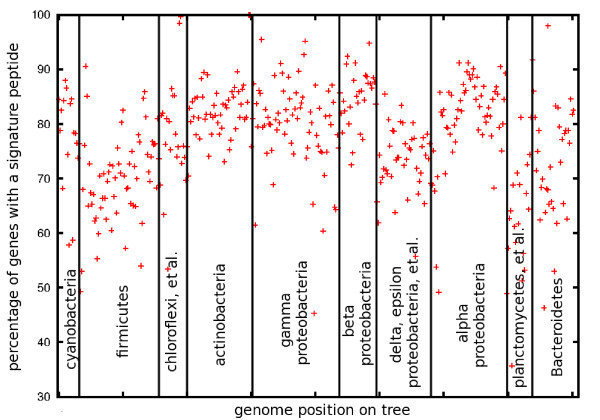
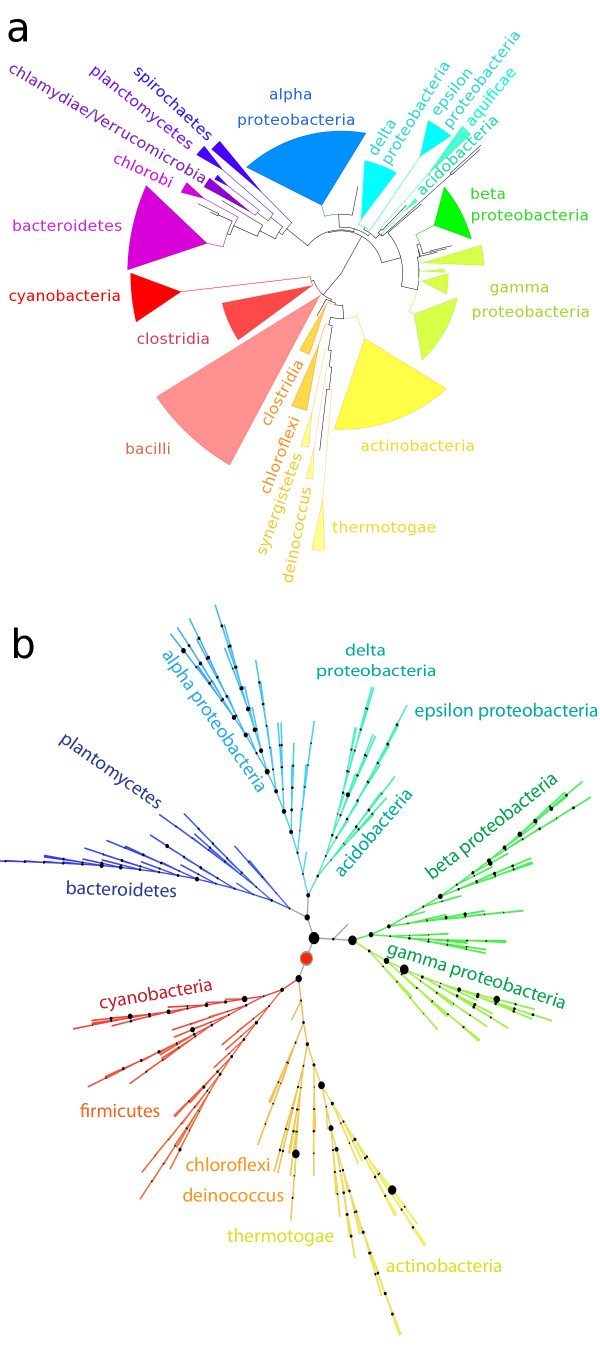
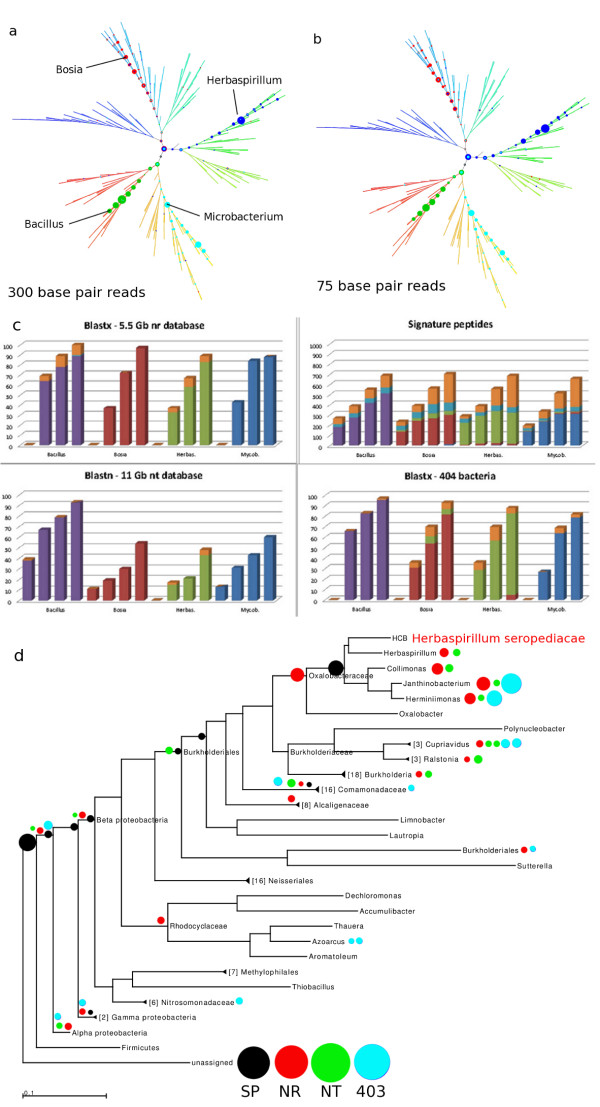
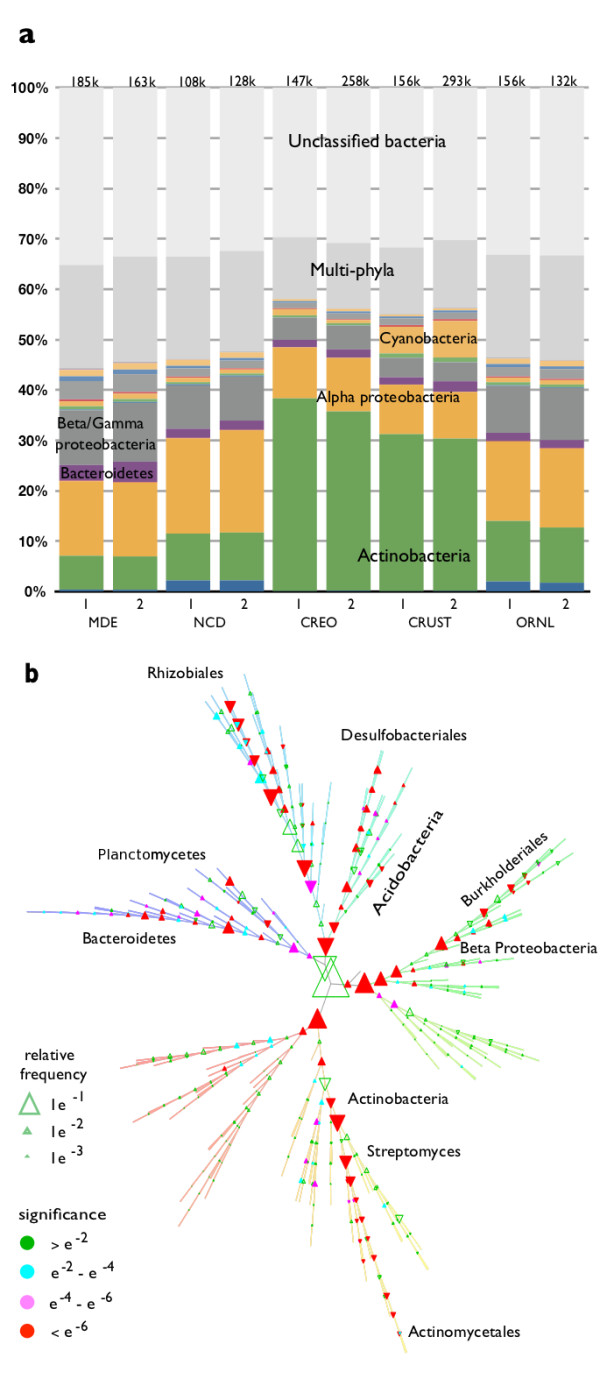
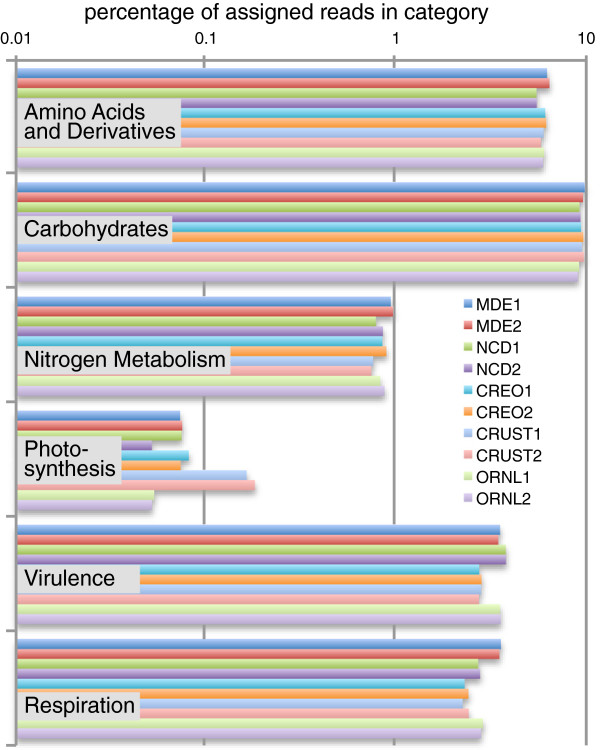
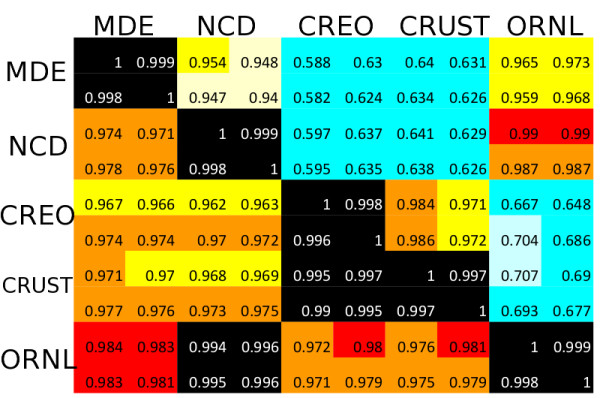
Results: At even the largest phylogenetic distances, thousands of 10-mer peptide exact matches can be found between pairs of bacterial genomes. Genes that share one or more peptide 10-mers typically have high reciprocal BLAST scores. Among a set of 403 representative bacterial genomes, some 20 million 10-mer peptides were found to be shared. We assign each of these peptides as a signature of a particular node in a phylogenetic reference tree based on the RNA polymerase genes. We classify the phylogeny of a genomic fragment (e.g., read) at the most specific node on the reference tree that is consistent with the phylogeny of observed signature peptides it contains. Using both synthetic data from four newly-sequenced soil-bacterium genomes and ten real soil metagenomics data sets, we demonstrate a sensitivity and specificity comparable to that of the MEGAN metagenomics analysis package using BLASTX against the NR database. Phylogenetic and functional similarity metrics applied to real metagenomics data indicates a signal-to-noise ratio of approximately 400 for distinguishing among environments. Our method assigns ~6.6 Gbp/hr on a single CPU, compared with 25 kbp/hr for methods based on BLASTX against the NR database.

Conclusions: Classification by exact matching against a precomputed list of signature peptides provides comparable results to existing techniques for reads longer than about 300 bp and does not degrade severely with shorter reads. Orders of magnitude faster than existing methods, the approach is suitable now for inclusion in analysis pipelines and appears to be extensible in several different directions.


Figures

Figure 1
Figure 1
Run-length distributions. Symbols show the number of matches between E. coli and several sets of genomes as a function of the length of the exact amino-acid match. Each match is counted only once, at the value of its maximal extension. For E. coli compared to B. subtilis (red crosses), the distribution is extended down to k = 3, and an exponential fit is shown as a solid red line. For k > 9, run-length distributions are shown for E. coli compared to a set of 22 other representative bacteria (green x), a set of 35 gamma proteobacteria (blue asterisks), and 17 representative enteric bacteria (cyan boxes).
Figure 2
Figure 2
Distribution of matches of length 10 or longer across the first 50 kilobases of theE. coligenome. Starts of individual genes are indicated by the blue crosses along the bottom, and matches to a particular genome are indicated in a line above the crosses in a particular color. The first line above the crosses indicates the coding direction of the proteins: either forward (red) or reverse (green). Names of several genes and operons are indicated at the bottom. Black squares in the bottom portion and cyan triangles in the top portion indicate matches to other portions of the E. coli genome (paralogs) are shown for completeness, but not discussed further in this work. The matching signature peptides and annotations of matched genes are enumerated for B. subtilis (black squares in the top panel) in Additional file 1, and discussed below.
Figure 3
Figure 3
Distribution of Protein BLAST scores (−log(E-value)) for various sets ofE. coligenes scored against genes in theB. subtilisgenome. At the top, in cyan, is the distribution of the best-match BLAST scores for each of the 4145 genes in the E. coli genome. 1461 of these are also reciprocal best hits of the B. subtilis genome against E. coli; the distribution of these scores is shown in dark blue. 746 distinct pairs of E. coliB. subtilis genes are connected by one or more 10-mer matches; the distribution of BLAST scores for these matches is shown in red. In magenta is shown the distribution of BLAST scores for the 388 genes that are both reciprocal BLAST best hits and connected by one or more 10-mers. At the bottom of the plot, in green, is the distribution for genes with matching 10-mers and the word ‘transporter’ in either gene’s annotation. The peak at the right of the plot indicates the 37 pairs of genes given an E-value of ‘0.0’ by BLAST.
Figure 4
Figure 4
Fraction of genes containing at least one signature peptide in genomes across the 403 bacterial reference genomes. As described in the text, signature peptides are exact matches of length 10 between genomes of different bacterial genera. The genomes are ordered along the x-axis according to their position in our bacterial phylogeny provided as Additional file 2 and Additional file 3; the ordering corresponds to that in Figure 5, starting at the 9:00 position and proceeding counter-clockwise around the radial tree.
Figure 5
Figure 5
Bacterial phylogeny, and the distribution of 20 million orthogenomic signatures across this phylogeny. ( a) Our computed RNA polymerase based phylogeny, showing the deep branches between bacterial phyla, and ( b) The distribution of signature peptides across the nodes of this phylogeny, with branch-length information removed. The symbol area at each node represents the fraction of total number of signatures assigned to the node. The root node, with 11% of the signatures, is shown in red. Most phyla are labeled and can be used together with the complete tree (Additional file 2, Additional file 3) to identify which taxa are covered by each node.
Figure 6
Figure 6
Sensitivity and specificity of simulated reads from draft soil genomes. Simulated reads were constructed using MetaSim [63] from genomes of four soil bacteria. Herbaspirillum seropedicae and Bacillus mojavensis are species from genera represented in the BLAST databases NR and NT as well as our signature peptide database (SP). Microbacterium trichotecenolytcum represents a genus found in NR and NT but not in SP. Bosea thiooxidans is from a genus not found in any of the three. ( a) Specificity of placement of simulated reads on the reference tree using our method, for 300-bp reads. ( b) Placement of 75-bp reads using our method. ( c) Comparison of sensitivity of our method (top right panel) and MEGAN [8] using three different BLAST databases: BLASTX and NR (top left) BLASTN and NT (bottom left), and BLASTX against the same genomes used in SP (bottom right). Simulated read lengths of 75, 150, 300, and 600 bp were used for each of the four genomes in each of the four panels. Colors indicate specificity of placement, with gold indicating non-specific placement near the root node in each case. (d) Details of specificity of placement of simulated 150-bp Herbaspirillium seropediacae for the 4 methods: our method (black), MEGAN4 with BLASTX against NR (red), MEGAN4 with BLASTN against NT (green), and MEGAN4 with BLASTX against the same genomes used in SP (cyan).
Figure 7
Figure 7
Phylogenetic breakdown of metagenomic soil samples. ( a) shows the high level classification of the metagenomics reads across 10 samples (two field replicates from each of 5 different sites), with the number of reads identified as bacterial at the top of each column, in thousands. ( b) shows the differences between samples from the MDE and NCD sites across all 402 interior nodes of the phylogenetic tree. Symbol size indicates number of recruited reads, while color indicates the statistical significance of the change (p-values: blue ~0.05, red ~0.000001). Triangles which point up indicates a higher prevalence in MDE; triangles with point down indicates a higher prevalence in NCD.
Figure 8
Figure 8
Phylogeny of rhizobiales CREO and CRUST samples compared to reference database, using 16S sequences. Maximum likelihood tree of full-length (black labels, reference genomes) and half-length 16S ribosomal sequences from Sanger sequence preparations of samples similar to the CREO (green labels) and CRUST (red labels) samples. The nine red dots at the nodes of the tree indicate the nine most populated nodes for the signature peptide analysis of the four samples represented in the CREO and CRUST samples, with an area proportional to the number of reads recruited. Labels to the right of the tree refer to assignments from the Baysian classifier at the ribosomal database project [53].
Figure 9
Figure 9
Functional profile of metagenomic samples. The functional assignments across the ten samples are broken down according to the highest level SEED categories, shown for six of 28 categories.
Figure 10
Figure 10
Phylogenetic and functional similarity. The normalized dot product (correlation) of phylogeny (upper right) and functional (lower left) profiles across the ten sites, defined by the number of reads assigned to each of the 402 nodes on the phylogenetic tree, or the 1088 SEED subsystems. For the phylogeny vectors, the root node was eliminated before computing the normalized dot product.
Figure 11
Figure 11
Visualizing two root-level signature peptides in the enzyme RuBisCO. Two root-level signature peptides (green and blue surfaces) correspond to regions of the protein which cross each other at an angle to form the bottom of a hydrophobic pocket where the substrate analog inhibitor 2,2-carboxyarabinitol-1,5-bisphosphate (spheres) binds. Residues in the signature peptides interact with the substrate, but also with each other. The former interactions contribute to substrate specificity, while the latter contribute to stability. Structure coordinates from PDB entry 1WDD.
Figure 12
Figure 12
The signature production process. Approximately 400 million overlapping 10-mers from the 403 bacterial reference genomic sequences are enumerated and collated into a genomic k-mer index. The 5% of this list that appears in multiple genera of bacterial reference genomes are collected, together with the list of leaves (taxa) which contain the signature. Using our inferred phylogeny of reference genomes (provided as Additional file 2, Additional file 3), we use the least common ancestor algorithm to assign the signature to the most specific node that covers all observations of the 10-mer.
Figure 13
Figure 13
The metagenomic read analysis process. Metagenomic reads are translated in the 6 possible reading frames as peptides and indexed as 10-mers of amino acids. This index is searched for phylogenetic signatures and the node assignments of the signatures are collated per read. Reads are assigned to nodes on the phylogenetic tree at the most specific node for which there is consistent evidence via the greatest common descendant algorithm.

Similar articles

Cited by

References

    1. Daniel R. The metagenomics of soil. Nat Rev Microbiol. 2005;3:470. doi: 10.1038/nrmicro1160. - DOI - PubMed
    1. Tamames J, Abellan JJ, Pignatelli M, Camacho A, Moya A. Environmental distribution of prokaryotic taxa. BMC Microbiol. 2010;10:85. doi: 10.1186/1471-2180-10-85. - DOI - PMC - PubMed
    1. Blaser MJ. Harnessing the power of the human microbiome. Proc Natl Acad Sci USA. 2010;107:6125–6126. doi: 10.1073/pnas.1002112107. - DOI - PMC - PubMed
    1. Handelsman J, The new science of metagenomics: Revealing the secrets of our microbial planet. National Research Council, Washington, DC; 2007. - PubMed
    1. Altschul SF, Gish W, Miller W, Myers EW, Lipman DJ. Basic local alignment search tool. J Mol Biol. 1990;215:403–410. - PubMed

Publication types