. 2013 Feb;62(2):383-91.
doi: 10.1007/s00262-012-1343-0. Epub 2012 Aug 25.

Metronomic chemotherapy with low-dose cyclophosphamide plus gemcitabine can induce anti-tumor T cell immunity in vivo

Affiliations

Metronomic chemotherapy with low-dose cyclophosphamide plus gemcitabine can induce anti-tumor T cell immunity in vivo

Miki Tongu et al. Cancer Immunol Immunother. 2013 Feb.

Abstract

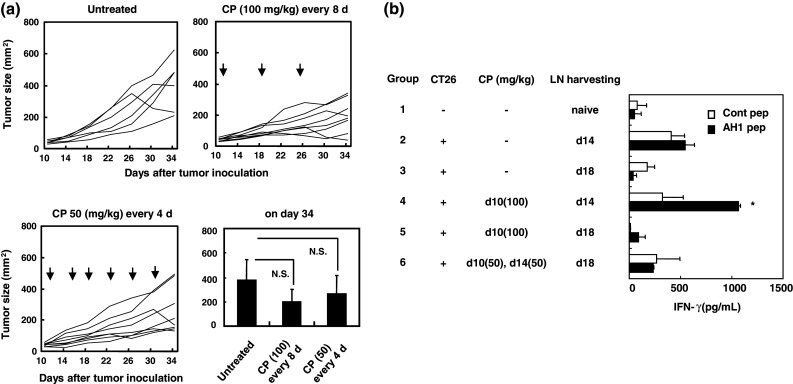
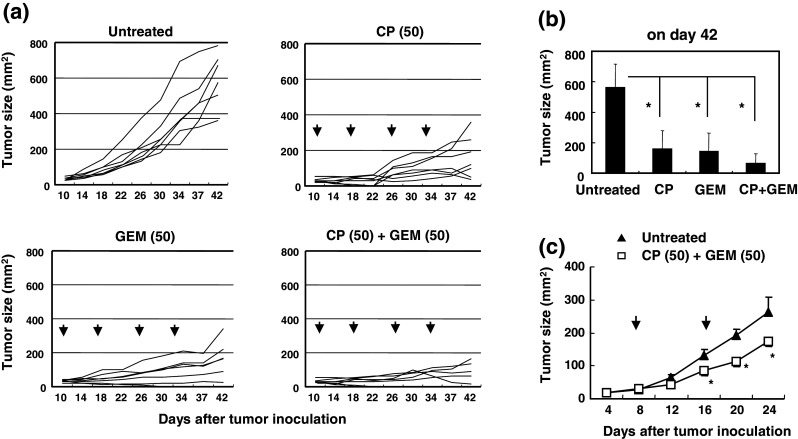
Several chemotherapeutic drugs have immune-modulating effects. For example, cyclophosphamide (CP) and gemcitabine (GEM) diminish immunosuppression by regulatory T cells (Tregs) and myeloid-derived suppressor cells (MDSCs), respectively. Here, we show that intermittent (metronomic) chemotherapy with low-dose CP plus GEM can induce anti-tumor T cell immunity in CT26 colon carcinoma-bearing mice. Although no significant growth suppression was observed by injections of CP (100 mg/kg) at 8-day intervals or those of CP (50 mg/kg) at 4-day intervals, CP injection (100 mg/kg) increased the frequency of tumor peptide-specific T lymphocytes in draining lymph nodes, which was abolished by two injections of CP (50 mg/kg) at a 4-day interval. Alternatively, injection of GEM (50 mg/kg) was superior to that of GEM (100 mg/kg) in suppressing tumor growth in vivo, despite the smaller dose. When CT26-bearing mice were treated with low-dose (50 mg/kg) CP plus (50 mg/kg) GEM at 8-day intervals, tumor growth was suppressed without impairing T cell function; the effect was mainly T cell dependent. The metronomic combination chemotherapy cured one-third of CT26-bearing mice that acquired tumor-specific T cell immunity. The combination therapy decreased Foxp3 and arginase-1 mRNA levels but increased IFN-γ mRNA expression in tumor tissues. The percentages of tumor-infiltrating CD45(+) cells, especially Gr-1(high) CD11b(+) MDSCs, were decreased. These results indicate that metronomic chemotherapy with low-dose CP plus GEM is a promising protocol to mitigate totally Treg- and MDSC-mediated immunosuppression and elicit anti-tumor T cell immunity in vivo.


Conflict of interest statement

The authors declare that they have no conflict of interest.

Figures

Fig. 1
Fig. 1
Anti-tumor effects induced by intermittent injections of low-dose CP. a BALB/c mice were injected s.c. with 5 × 105 CT26 cells into the right flank. On day 10, mice were injected i.p. with either CP (100 mg/kg) with an 8-day interval or CP (50 mg/kg) with a 4-day interval between injections. Arrows indicate the CP injection. Tumor size (mm2) was measured twice weekly. Each group consisted of six or eight mice, and lines represent tumor growth. The mean ± SD of the results on day 34 after tumor inoculation are shown. Similar results were obtained in three experiments. NS, not significant by ANOVA with Dunnett’s post hoc test. b BALB/c mice were injected s.c. with 5 × 105 CT26 cells into the right flank. On the indicated days, mice were injected i.p. with CP (50 or 100 mg/kg) and draining LNs were harvested, pooled, and stimulated in vitro with the AH1 or the control peptide. After 3 days, IFN-γ levels in the supernatant were determined by ELISA. Each group consisted of three mice. *P < 0.05 indicates statistical significance by Student’s t test
Fig. 2
Fig. 2
Injection of low-dose GEM suppresses tumor growth in vivo. BALB/c mice were injected s.c. with 5 × 105 CT26 cells into the right flank. On day 10, mice were injected i.p. with GEM (50 or 100 mg/kg). Arrows indicate the injection of GEM. Tumor size (mm2) was measured twice weekly. Each group consisted of five or six mice, and lines represent tumor growth in each mouse. The mean ± SD of the results on day 30 after tumor inoculation are also shown. Similar results were obtained in two experiments. *P < 0.05 indicates statistical significance by ANOVA with Dunnett’s post hoc test. NS, not significant
Fig. 3
Fig. 3
No suppressive effect of the combination chemotherapy with low-dose CP plus GEM on splenic T cell function. a Naïve BALB/c mice were injected i.p. with CP (50 mg/kg) and GEM (50 mg/kg) on the indicated days. Spleen cells were harvested, counted, and analyzed by flow cytometry. Each group consisted of four mice. *P < 0.05 indicates statistical significance by Student’s t test. b Spleen cells from individual mice were cultured in anti-CD3 mAb-coated wells for 2 days, and IFN-γ levels in supernatants were determined by ELISA. Numbers represent individual mice
Fig. 4
Fig. 4
Injections of low-dose CP and GEM with an 8-day interval suppress tumor growth. a BALB/c mice were injected s.c. with 5 × 105 CT26 cells into the right flank. Ten days later, these mice were injected i.p. with CP (50 mg/kg) and/or GEM (50 mg/kg) with an 8-day interval between injections. Arrows represent the injections. Tumor size (mm2) was measured twice weekly. Each group consisted of six or seven mice, and lines represent tumor growth. b The mean ± SD of the results on day 42 after tumor inoculation are shown. *P < 0.05 indicates statistical significance by ANOVA with Dunnett’s post hoc test. Similar results were obtained in three experiments. c BALB/c nude mice were injected s.c. with 5 × 105 CT26 cells into the right flank. On days 8 and 16, these mice were injected i.p. with CP (50 mg/kg) and GEM (50 mg/kg). Arrows indicate the injections of CP and GEM. Each group consisted of five mice. *P < 0.05 indicates statistical significance by Student’s t test
Fig. 5
Fig. 5
Tumor-specific T cell immunity in CT26-cured mice after metronomic combination chemotherapy. a BALB/c mice were injected s.c. with 5 × 105 CT26 cells into the right flank. On days 10, 18, and 26, these mice (n = 24) were injected i.p. with CP (50 mg/kg) and GEM (50 mg/kg). Arrows indicate the injections. Tumor size (mm2) was measured twice weekly. Lines represent tumor growth. Six mice that cured of CT26 were inoculated s.c. with 2 × 105 CT26 cells 60 days after the initial tumor inoculation. Inset shows the tumor growth in naïve BALB/c mice that were inoculated s.c. with 2 × 105 CT26 cells. b Spleen cells from naïve or CT26-cured mice were cultured with MMC-treated CT26 or RENCA cells for 3 days, and IFN-γ levels in supernatants were determined by ELISA. Numbers represent individual mice. *P < 0.05 indicates statistical significance by Student’s t test
Fig. 6
Fig. 6
Effects of the combination therapy of CP and GEM on tumor-infiltrating immune cells. a BALB/c mice were injected s.c. with 5 × 105 CT-26 cells into the right flank. On day 10, mice were injected i.p. with CP and/or GEM at a dose of 50 mg/kg. Two days later, tumor tissues were collected and mRNA expression was evaluated by real-time PCR. Each group consisted of five mice. *P < 0.05 and **P < 0.01 indicate statistical significance by Student’s t test. b Tumor tissue cell suspensions were stained with FITC-conjugated anti-Gr-1 mAb, PE-conjugated anti-CD11b mAb, and APC-conjugated anti-CD45 mAb, and the percentage of tumor-infiltrating immune cells was determined (upper, left). CD45+ cells were sub-divided (upper, right) into Gr-1low CD11b+ or Gr-1high CD11b+ cells. Each group consisted of four mice. *P < 0.05 and **P < 0.01 indicate statistical significance by Student’s t test

References

    1. Yamaguchi T, Sakaguchi S. Regulatory T cells in immune surveillance and treatment of cancer. Semin Cancer Biol. 2006;16:115–123. doi: 10.1016/j.semcancer.2005.11.005. - DOI - PubMed
    1. Ostrand-Rosenberg S, Sinha P. Myeloid-derived suppressor cells: linking inflammation and cancer. J Immunol. 2009;182:4499–4506. doi: 10.4049/jimmunol.0802740. - DOI - PMC - PubMed
    1. Curiel TJ, Coukos G, Zou L, et al. Specific recruitment of regulatory T cells in ovarian carcinoma fosters immune privilege and predicts reduced survival. Nat Med. 2004;10:942–949. doi: 10.1038/nm1093. - DOI - PubMed
    1. Sato E, Olson SH, Ahn J, et al. Intraepithelial CD8+ tumor-infiltrating lymphocytes and a high CD8+/regulatory T cell ratio are associated with favorable prognosis in ovarian cancer. Proc Natl Acad Sci USA. 2005;102:18538–18543. doi: 10.1073/pnas.0509182102. - DOI - PMC - PubMed
    1. Young MR, Wright MA, Pandit R. Myeloid differentiation treatment to diminish the presence of immune-suppressive CD34+ cells within human head and neck suqamous cell carcinomas. J Immunol. 1997;159:990–996. - PubMed

Publication types

MeSH terms