. 2012 Nov-Dec;66(3):246-56.
doi: 10.1016/j.vascn.2012.08.167. Epub 2012 Aug 25.

High throughput measurement of Ca²⁺ dynamics for drug risk assessment in human stem cell-derived cardiomyocytes by kinetic image cytometry

Affiliations

High throughput measurement of Ca²⁺ dynamics for drug risk assessment in human stem cell-derived cardiomyocytes by kinetic image cytometry

Fabio Cerignoli et al. J Pharmacol Toxicol Methods. 2012 Nov-Dec.

Abstract

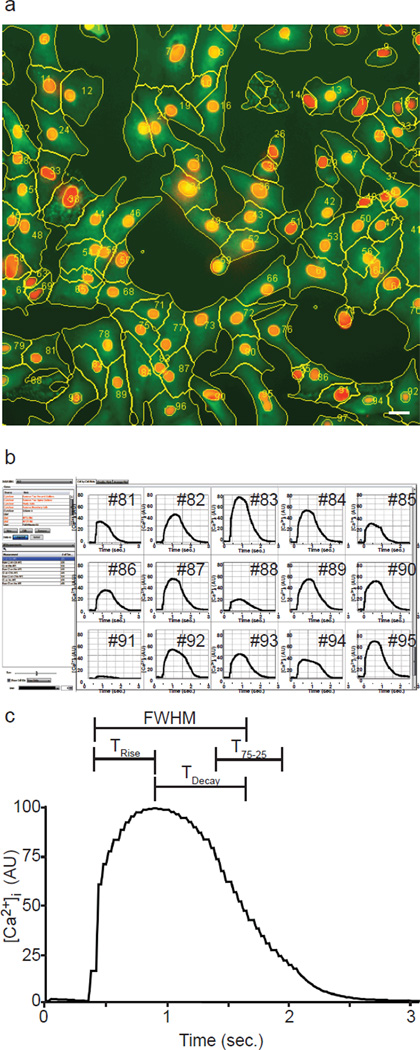
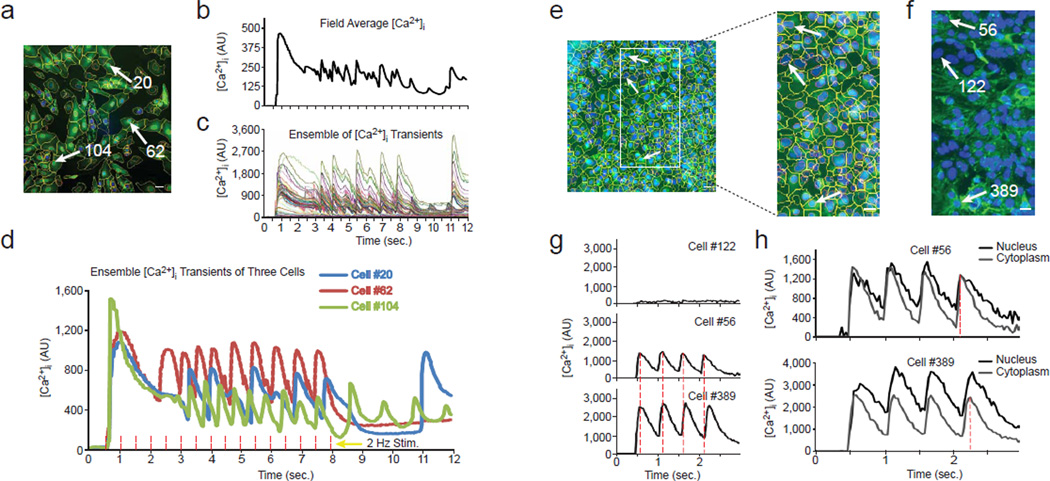
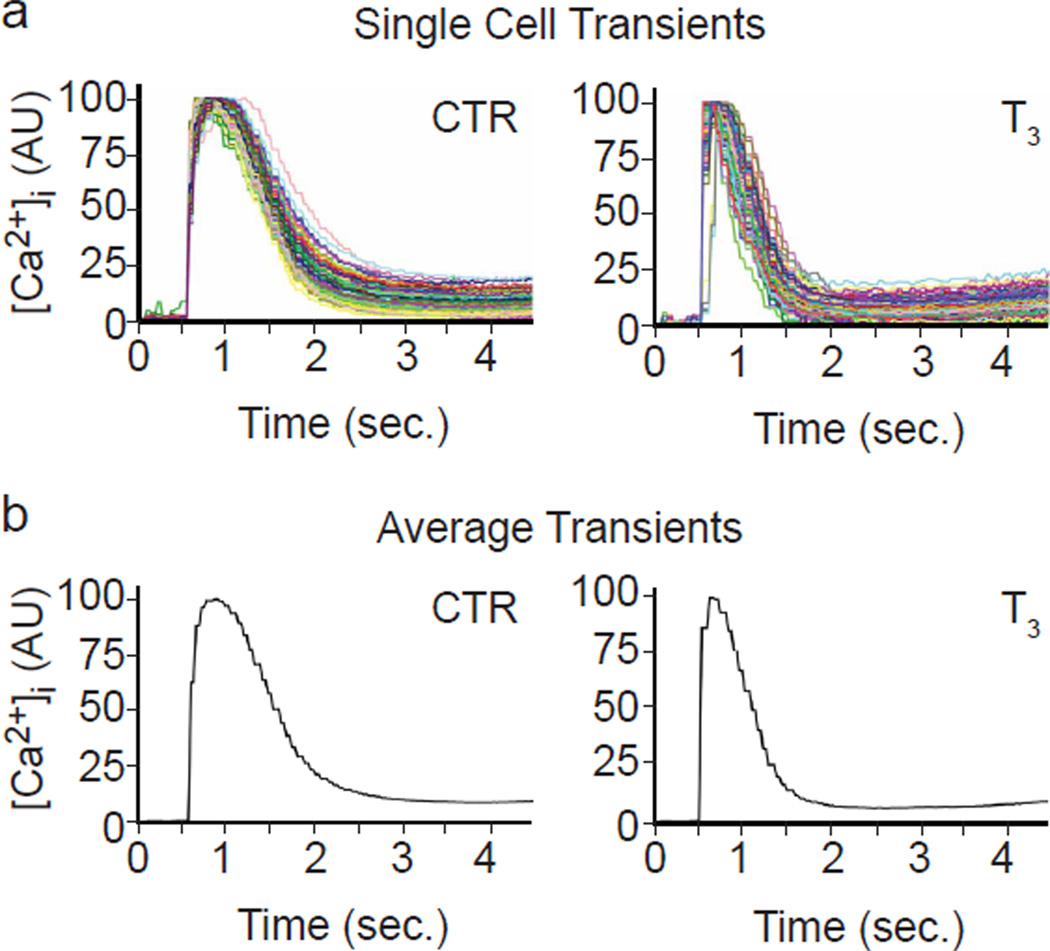
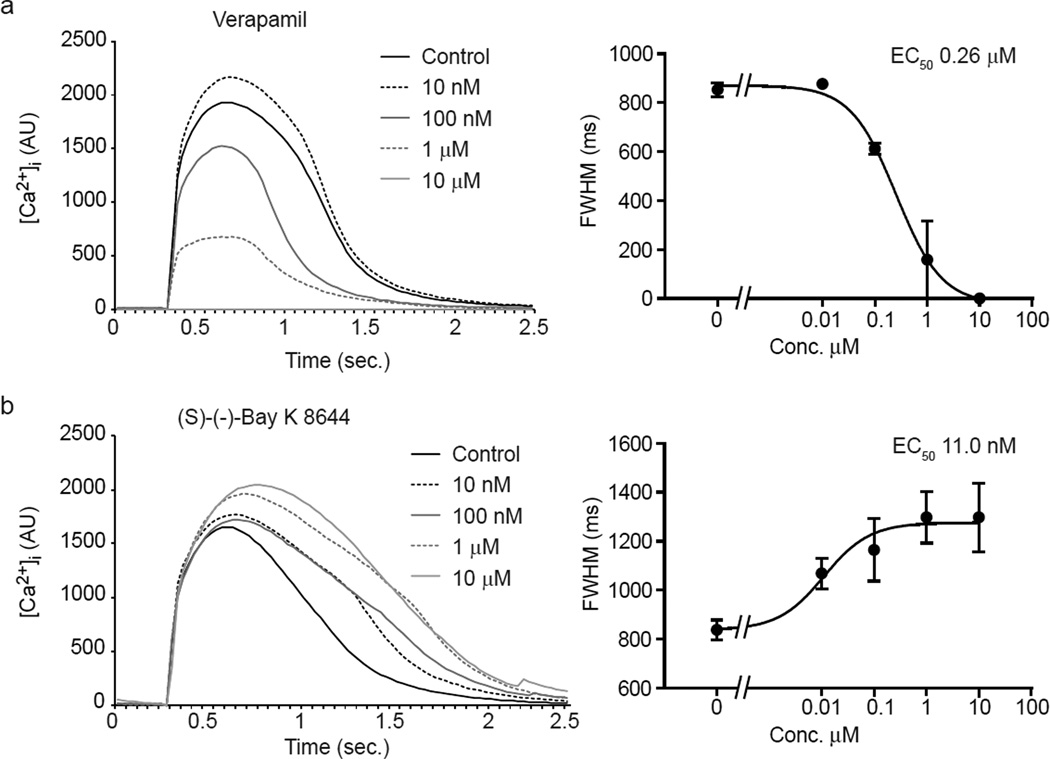
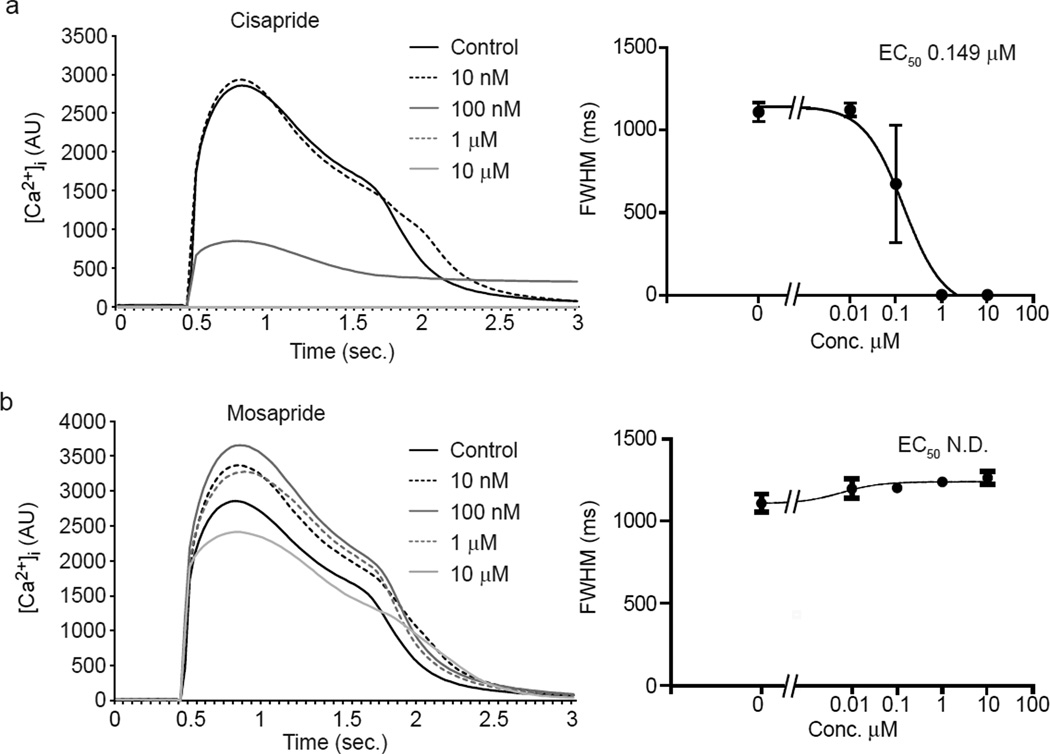
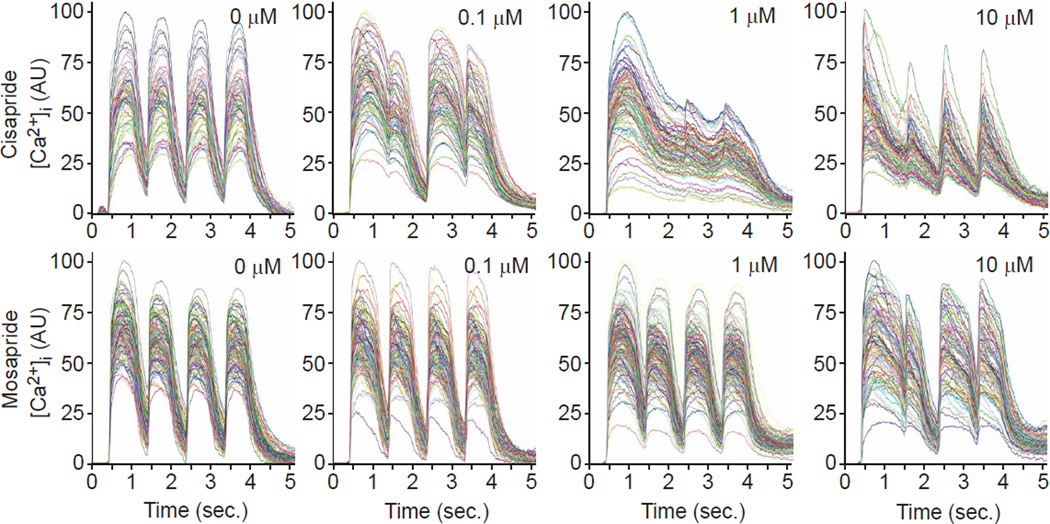
Current methods to measure physiological properties of cardiomyocytes and predict fatal arrhythmias that can cause sudden death, such as Torsade de Pointes, lack either the automation and throughput needed for early-stage drug discovery and/or have poor predictive value. To increase throughput and predictive power of in vitro assays, we developed kinetic imaging cytometry (KIC) for automated cell-by-cell analyses via intracellular fluorescence Ca²⁺ indicators. The KIC instrument simultaneously records and analyzes intracellular calcium concentration [Ca²⁺](i) at 30-ms resolution from hundreds of individual cells/well of 96-well plates in seconds, providing kinetic details not previously possible with well averaging technologies such as plate readers. Analyses of human embryonic stem cell and induced pluripotent stem cell-derived cardiomyocytes revealed effects of known cardiotoxic and arrhythmogenic drugs on kinetic parameters of Ca²⁺ dynamics, suggesting that KIC will aid in the assessment of cardiotoxic risk and in the elucidation of pathogenic mechanisms of heart disease associated with drugs treatment and/or genetic background.


Figures

Fig. 1
Fig. 1. Image segmentation and single-cell Ca2+ analysis
(a) Cell nuclei (red), average Ca2+ signal (green) and cell boundaries (yellow lines) are shown for NRVMs electrically stimulated with one single pulse, cell numbers are overlaid (yellow). Bar, 20 µm. (b) A screenshot shows single-cell Ca2+ traces plotted for some of the cells identified in ‘a’. (c) An averaged Ca2+ transient curve is shown with the kinetic parameters that are automatically recorded for each cell.
Fig. 2
Fig. 2. High content Ca2+ analysis on asynchronized cardiomyocytes
(a) The average Ca2+ image with cell segmentation masks is shown for NRVMs treated for three days with 100 nM T3 and paced at 2 Hz frequency in presence of 100 µM sparfloxacin (from Video 1). The nuclei are blue, the average [Ca2+] fluorescence signal is green, the cell boundaries are yellow and the nuclear boundaries are red. Bar, 20 µm. (b) Whole region-averaged analysis emulates plate readers by showing the fluorescence integrated over the whole image, rather than cell-by-cell. In this and subsequent panels, baseline level was set to 0 (see Methods). (c) In contrast, single cell traces from all of the cells overlaid by CyteSeer enables observation of asynchronous subsets of [Ca2+]i transients. (d) Superimposed single-cell traces from three asynchronous cells. Cells #20 and #104 show [Ca2+]i transients at the end of the sequence not induced by the electrical stimulation. The red dashed lines correspond to the times of electrical stimulation. (e) Average Ca2+ image and cell segmentation are shown for hESC-derived cardiomyocytes stimulated at 2 Hz frequency (from Video 2), along with a magnified region. Bars, 20 µm. (f) α-actinin immunofluorescence and nuclear staining of the same magnified region as in ‘e’, acquired after Ca2+ recording, fixation and labeling. The white arrows point to the same nuclei both in the Ca2+ (e) and immunofluorescence images (f). (g) Average transients of cells located in different regions of the image. Cell #122 represents a non-cardiomyocyte that did not respond to the electrical stimuli. Cell #56 from the upper region of the image and Cell #389 from the lower region of the image demonstrate a progressively increased delay between their respective [Ca2+]i transients (the dashed red lines are the positions of the peaks for cell #56). (h) Differences between nuclear and cytoplasmic transients in the cells #56 and #389. The dotted lines show the positions of the maxima of the fourth cytoplasmic [Ca2+]i transients.
Fig. 3
Fig. 3. T3 treatment in NRVMs
(a) Ensembles of 138 control (CTR, medium alone) and 96 T3 (100 nM T3) single cell Ca2+ traces in NRVMs cultured for three days are shown. For plotting, the software normalized the [Ca2+]i-mediated fluorescence of each baseline (level just prior to the rapid rise) to 0.0 and the peak to 100. Errors in automated peak determination account for the apparent truncation. (b) Average [Ca2+]i traces of the same plots as in ‘a’ create the “kinetic average cell” plots shown.
Fig. 4
Fig. 4. Opposite effects of an L-type Ca2+ inhibitor and activator on calcium transients in hiPSC-CMs
(a,b) Average calcium transient curves (left) and dose-response plot (right) for the FWHM in hiPSC-CMs treated with the L-type Ca2+ channel blocker verapamil (a) or channel activator Bay K 8644 (b). Calcium transients were averaged between well replicates and aligned at the beginning of the upstroke.
Fig. 5
Fig. 5. Different sensitivity to prokinetic agents cisapride and mosapride measuring calcium transient in hiPSC-CMs
(a,b) Average calcium transient curves (left) and dose-response plot for the FWHM (right) in hiPSC-CMs treated with cisapride (a) and the structural analog mosapride (b). Calcium transients were averaged between well replicates and aligned at the beginning of the upstroke. Note that cisapride, which blocks hERG, elicits pronounced dose-dependent elongation of FWHM.
Fig. 6
Fig. 6. Testing cardiotoxic drugs in hiPSC-derived cardiomyocytes using electrical field stimulation and 1 Hz pacing
Ensembles of single cell traces are shown for samples treated with cisapride (top) and mosapride (bottom) at increasing doses and paced at 1 Hz.

Similar articles

Cited by

References

    1. Antzelevitch C. Arrhythmogenic mechanisms of QT prolonging drugs: Is QT prolongation really the problem? Journal of Electrocardiology. 2004;37:15–24. - PubMed
    1. Balasubramaniam R, Chawla S, Grace AA, Huang CLH. Caffeine-induced arrhythmias in murine hearts parallel changes in cellular Ca2+ homeostasis. Am J Physiol Heart Circ Physiol. 2005;289:1584–1593. - PubMed
    1. Bers DM. Cardiac excitation-contraction coupling. Nature. 2002;415:198–205. - PubMed
    1. Bode G, Olejniczak K. ICH Topic: The draft ICH S7B step 2: Note for guidance on safety pharmacology studies for human pharmaceuticals. Fundamental & Clinical Pharmacology. 2002;16:105–118. - PubMed
    1. Bootman MD, Fearnley C, Smyrnias I, MacDonald F, Roderick HL. An update on nuclear calcium signalling. J Cell Sci. 2009;122:2337–2350. - PubMed

Publication types

MeSH terms