. 2013 Jul 11;32(28):3359-70.
doi: 10.1038/onc.2012.352. Epub 2012 Aug 27.

Histone methylase MLL1 has critical roles in tumor growth and angiogenesis and its knockdown suppresses tumor growth in vivo

Affiliations

Histone methylase MLL1 has critical roles in tumor growth and angiogenesis and its knockdown suppresses tumor growth in vivo

K I Ansari et al. Oncogene. .

Abstract

Mixed lineage leukemias (MLLs) are human histone H3 lysine-4-specific methyl transferases that have critical roles in gene expression, epigenetics and cancer. Herein, we demonstrated that antisense-mediated knockdown of MLL1 induced cell-cycle arrest and apoptosis in cultured cells. Intriguingly, application of MLL1 antisense specifically knocked down MLL1 in vivo and suppressed the growth of xenografted cervical tumor implanted in nude mouse. MLL1 knockdown downregulated various growth and angiogenic factors, such as HIF1α, VEGF and CD31, in tumor tissue affecting tumor growth. MLL1 is overexpressed along the line of vascular network and localized adjacent to endothelial cell layer expressing CD31, indicating potential roles of MLL1 in vasculogenesis. MLL1 is also overexpressed in the hypoxic regions along with HIF1α. Overall, our studies demonstrated that MLL1 is a key factor in hypoxia signaling, vasculogenesis and tumor growth, and its depletion suppresses tumor growth in vivo, indicating its potential in novel cancer therapy.


Figures
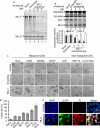
Figure 1
Figure 1. Effect of MLL1-knockdown on cell viability
(a-b) Knockdown of MLL1: HeLa cells were transfected with varying concentrations of MLL1-antisense or scramble antisense for 48 h. (a) Proteins from control and antisense-treated cells were analyzed by western blotting using MLL1 and MLL2 (control) antibodies. Lane 1: control cells; lane 2: cells transfected with scramble antisense; lanes 3-5: cells transfected with 3-7 μg of MLL1 antisense. (b) RNA from control and antisense-treated cells were reverse transcribed and analyzed by regular PCR (top panel) and qPCR (bottom panel) using primers specific to MLL1, MLL2 (control) and β-actin (control). Each reaction in qPCR was done in three parallel replicates and experiment was repeated at least twice (n = 6, p < 0.05) (c) Microscopic analysis of MLL1-antisense treated cells. Different types of cancer and normal cells [HeLa (cervical cancer), H358 (lung cancer), SW-480 (colon cancer), JAR (placenta cancer), CCD-18Co (colon normal), MCF7 (breast cancer), and MCF10 (breast normal)] were transfected with 7 μg MLL1-specific or scramble antisense for 48 h and then cells were visualized under a microscope. (d) Quantification of viable cells using MTT assay: Different types of cancer and non-cancer cells were transfected with 7 μg MLL1-antisense or scramble antisense for 48 h and then subjected to MTT assay. The relative (%) cell viability (MLL1-antisense vs scramble) was plotted for different cell lines. Bars indicated standard error (n = 10, p < 0.05) (e) TUNEL assay: HeLa cells were transfected with MLL1 antisense for 48 h, fixed in 70 % EtOH and subjected to terminal nicked end-labeling using fluorescent dUTP. In parallel cells were also stained with DAPI (nuclear staining, blue fluorescence) and propidium iodide (PI that stains nucleus of dead cells, red color). dUTP stained green speckles represent apoptotic cells with fragmented nuclei.
Figure 2
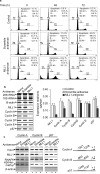
Figure 2. Roles of MLL1 in cell cycle progression
(a) FACS analysis: HeLa cells were transfected with MLL1- or scramble antisense for different time periods (24-72 hr), fixed in 70 % ethanol, and analyzed by flow cytometer. Percent (%) cell populations at different stages of cell cycles are listed within the panels. (b) Effect of MLL1 knockdown on regulation of cyclins and p-proteins. HeLa cells were transfected with MLL1-antisense and scramble antisense for 48 h. Cells were harvested and RNA extracts were subjected to RT-PCR analysis by using primer specific to cycle regulatory genes cyclin A, cyclin B, cyclin D, cyclin E, p57. 28S and 18S rRNA was used as loading control. Real time quantification relative to GAPDH is shown in the right panel. Bars indicate standard errors (n = 3, p < 0.05). (c) ChIP analysis. MLL1-antisense and scramble antisense treated cells were fixed in formaldehyde, sonicated to shear the chromatin and then subjected to immuno-precipitated by using MLL1, H3K4 tri-methyl and RNAPII specific antibodies. β-actin specific antibody was used as non-specific control. The immuno-precipitated chromatin was PCR-amplified with primer specific to promoter regions of cyclin A, cyclin B, and p57. The position of the amplicons are shown the right panels.
Figure 3
Figure 3. Regression of cervical cancer xenograft by MLL1-antisense
HeLa cells were subcutaneously injected on the right hinge region of six weeks old athymic nude (nu/nu) mice. Mice were regularly observed for appearance of tumor. Once the tumor reached about 32 mm2 of cross-sectional area, mice were intraperitoneally administered with MLL1-antisense (MLL1-A3 and MLL1-A5, 300 μg/ 20 gm body weight) on the left hinge region at 4 days interval for 4 weeks. Control mice were administered with either PBS (diluent) or a same doze of scramble antisense. Tumor sizes were measured using a slid caliper at every two days intervals. (a) Area of tumor cross-sections was plotted against time. Bars indicated standard errors (n = 9, p < 0.05). (b) Representative pictures of the control and treated (MLL1-A3) mice at different stages of antisense treatments are shown.
Figure 4
Figure 4. Antisense-mediated MLL1 knockdown, analysis of target gene expression and tumor histology
(a) Representative image of the control and MLL1-antisense treated tumor xenograft (excised after 28 days of treatment) is shown in the top panel. Coss-sections of above respective tumors are shown at bottom panel. (b) Haematoxylin/eosin (H&E) staining of the tumor cross sections of control and MLL1-antisense treated tumors. (c) RT-PCR analysis: RNA was isolated from control and MLL1-antisense treated tumor tissues and subjected to RT-PCR analysis using MLL1 and MLL2 (as control) specific primers. The rRNA (28S and 18S) was shown as loading control. The real-time quantification of MLL1 expression relative to GAPDH is shown in right panel. Bars indicate standard error (n = 3, p < 0.05). (d) Western blotting: Proteins from the control and MLL1-antisense treated tumors were analyzed by western blotting using antibodies specific to MLL1 and MLL2 (control). (e) Immunofluorescence staining: The control and MLL1-antisense treated mice with cervical cancer xenograft were perfused with 4% paraformaldehyde at 28th day of treatment. The tumors were excised, sectioned and subjected to immunofluorescence staining with MLL1 antibody. Nuclear counter-staining was done with DAPI and analyzed under fluorescence microscope. Representative images showing the cellular morphology (DIC), nuclear integrity (DAPI) and MLL1 expression in the control and MLL1-antisense treated tumors are shown. (f) TUNEL assay: Paraformaldehyde perfused tumor sections were subjected to terminal nicked end-labeling using fluorescent dUTP. In parallel the sections were also stained with DAPI and propidium iodide. dUTP stained green speckles represent apoptotic cells with fragmented nuclei.
Figure 5
Figure 5. Effect of MLL1-knockdown on expression of tumor growth, angiogenic, and hypoxia signaling factors
(a) Analysis of growth and angiogenic factors by qPCR: RNA from the control and MLL1-antisense treated tumor tissues were reverse transcribed and analyzed by RT-PCR using primers specific to MLL1, VEGF, CD31, HIF1α and β-actin (control). The real-time quantifications of each gene expression (relative to GAPDH) are shown in bottom panel. Bars indicate standard error (n = 3, p < 0.05). (b) ChIP assay showing the binding of MLL1, RNAPII and level of H3K4-trimethylation in the promoters of VEGF, CD31 and HIF1α upon MLL1 depletion. The control and MLL1-antisense treated mice with cervical cancer xenograft were perfused with 4 % formaldehyde at 28th day of treatment. The tumors were excised, homogenized, sonicated to shear the chromatins, and subjected to ChIP assay using antibodies specific to MLL1, RNAP II, and H3K4-trimethyl antibodies. The immuno-precipitated DNA was PCR-amplified using primer specific to promoter region of VEGF, CD31 and HIF1α. IgG was used as antibody control. Real-time quantification of MLL1 and RNAPII recruitment and level of H3K4 trimethylation relative to input is shown in the bottom panel. Bars indicate standard error (n = 3, p < 0.05). The position of the amplicons are shown the middle panels.
Figure 6
Figure 6. Roles MLL1 in vasculogenesis
(a-c) Co-immunofluorescence staining of CD31 and MLL1. Para-formaldehyde perfused tumor xenograft tissue (control and MLL1-antisense treated) were sectioned and subjected to co-immunostaining with CD31 and MLL1 antibodies, followed by staining with FITC and rhodamine conjugated secondary antibodies. Nuclear counter staining was done with DAPI and then visualized under fluorescence microscope. Representative images of the exterior periphery (a) and interior core (b) of the control and MLL1-antisense treated xenografted tumor tissue are shown. Arrows indicate live human tissue at the exterior periphery of MLL1-antisense treated xenograft. (c) Immunofluorescence staining showing localization of MLL1 and CD31 in surroundings of a vascular channel (vertical cross-section). (d-e) DAB staining showing the localization of MLL1 and CD31 around vascular track. The cervical xenograft containing mice were perfused with 4% formaldehyde and the tumors were excised, sectioned and subjected to DAB staining using MLL1 and CD31 antibodies, independently. Nuclear counter staining was done with DAPI. (f) H&E staining of tumor cross section along with DAB staining of CD31 and MLL1. Positions of CD31 and MLL1 along the vascular linings are shown by arrows. (g) Immunofluorescence staining of CD31 and VEGF in the control tumor tissue.
Figure 7
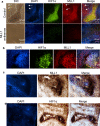
Figure 7. Histochemical analysis showing the localization of HIF1α and MLL1 around hypoxic regions
(a-b) Co-immunofluorescence staining of HIF1α and MLL1: Para-formaldehyde perfused tumor xenograft tissue (control and MLL1-antisense treated) were sectioned and subjected to co-immunostaining with HIF1α and MLL1 antibodies, followed by staining with FITC and rhodamine conjugated secondary antibodies. Nuclear counter staining was done with DAPI and then visualized under fluorescence microscope. In the control tumor, hypoxic regions are distinctly visible (marked with dashed boundary in DIC image). Arrows indicate blood vessels surrounding hypoxic region. A high resolution/magnification image showing nuclear staining of HIF1α and MLL1 in the hypoxic region is shown in panel b. (c-d) DAB staining showing the localization of MLL1 and HIF1α. Formaldehyde-fixed tumors sections were subjected to DAB staining using MLL1 and HIF1α antibodies, independently. Nuclear counter staining was done with DAPI.

Similar articles

Cited by

References

    1. Corey DR. Telomerase inhibition, oligonucleotides, and clinical trials. Oncogene. 2002 Jan 21;21(4):631–7. - PubMed
    1. Gleave ME, Monia BP. Antisense therapy for cancer. Nat Rev Cancer. 2005 Jun;5(6):468–79. - PubMed
    1. Lu B, Mu Y, Cao C, Zeng F, Schneider S, Tan J, et al. Survivin as a therapeutic target for radiation sensitization in lung cancer. Cancer Res. 2004 Apr 15;64(8):2840–5. - PubMed
    1. Ryan BM, O'Donovan N, Duffy MJ. Survivin: a new target for anti-cancer therapy. Cancer Treat Rev. 2009 Nov;35(7):553–62. - PubMed
    1. Halatsch ME, Schmidt U, Behnke-Mursch J, Unterberg A, Wirtz CR. Epidermal growth factor receptor inhibition for the treatment of glioblastoma multiforme and other malignant brain tumours. Cancer Treat Rev. 2006 Apr;32(2):74–89. - PubMed

Publication types

MeSH terms

Substances