. 2012 Nov 1;72(21):5600-12.
doi: 10.1158/0008-5472.CAN-11-3666. Epub 2012 Aug 27.

CD24 is an effector of HIF-1-driven primary tumor growth and metastasis

Affiliations

CD24 is an effector of HIF-1-driven primary tumor growth and metastasis

Shibu Thomas et al. Cancer Res. .

Abstract

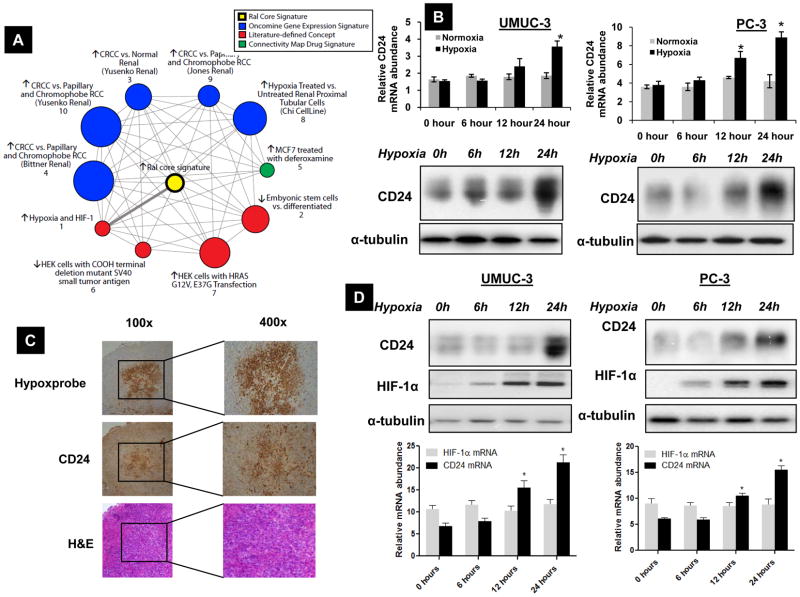
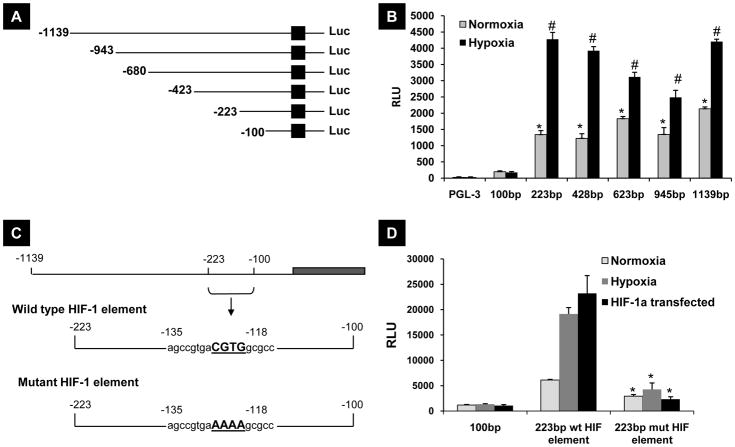
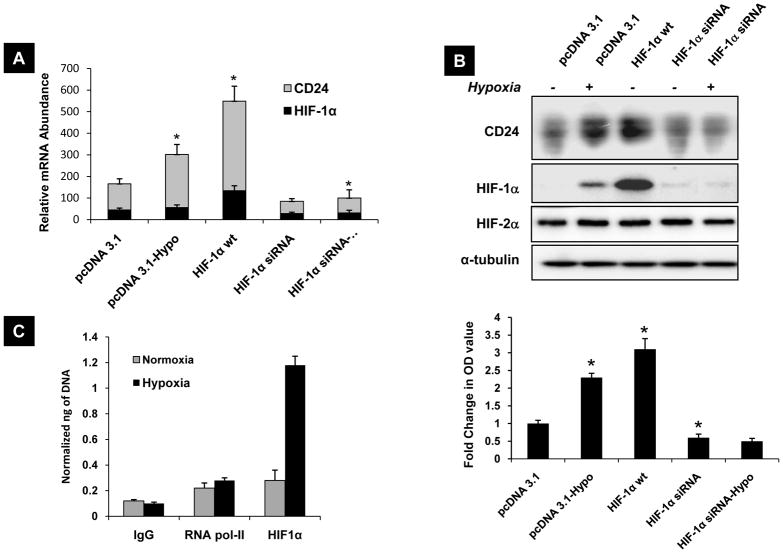
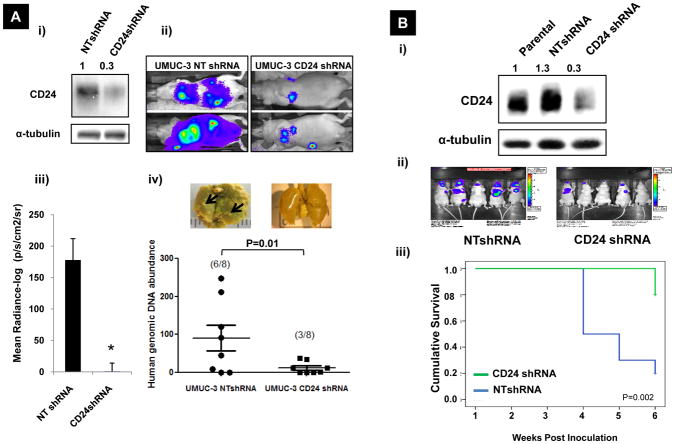
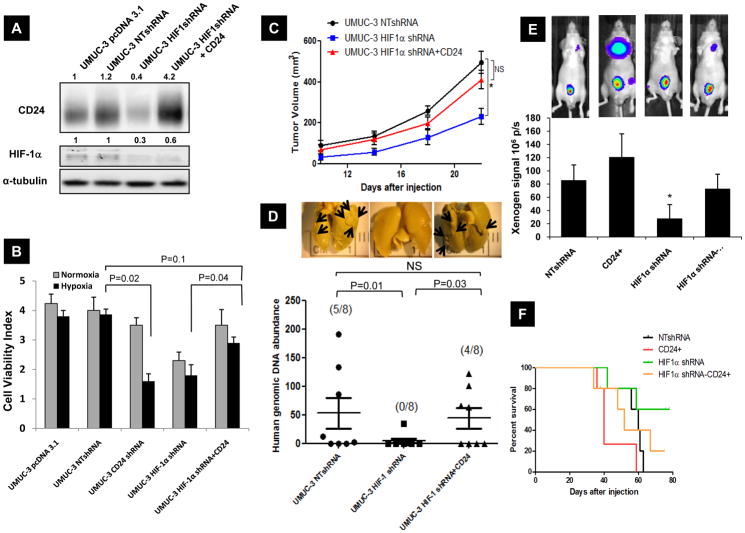
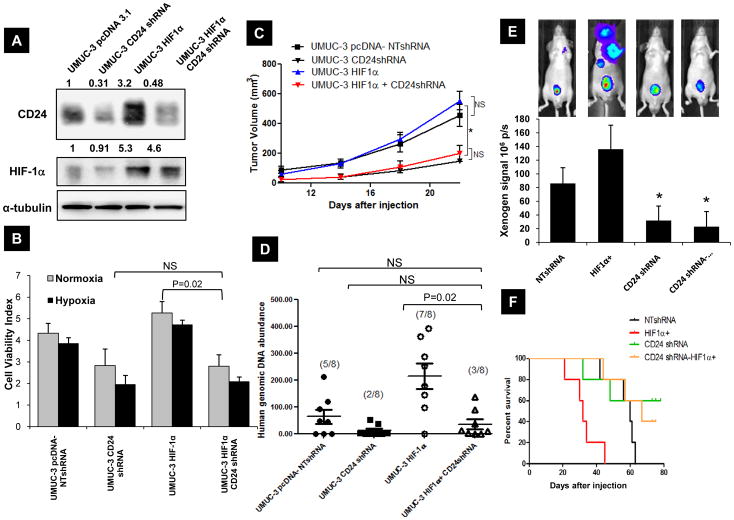
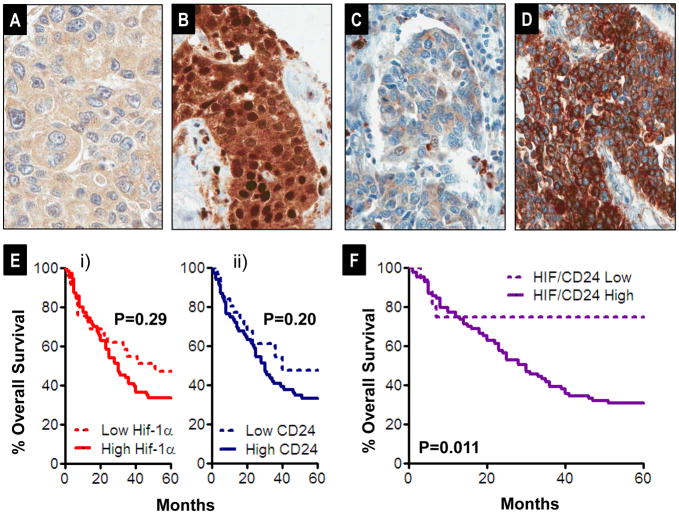
Hypoxia drives malignant progression in part by promoting accumulation of the oncogenic transcription factor hypoxia inducible factor-1α (HIF-1α) in tumor cells. Tumor aggressiveness also relates to elevation of the cancer stem cell-associated membrane protein CD24, which has been causally implicated in tumor formation and metastasis in experimental models. Here, we link these two elements by showing that hypoxia induces CD24 expression through a functional hypoxia responsive element in the CD24 promoter. HIF-1α overexpression induced CD24 mRNA and protein under normoxic conditions, with this effect traced to a recruitment of endogenous HIF-1α to the CD24 promoter. Short hairpin RNA-mediated attenuation of HIF-1α or CD24 expression reduced cancer cell survival in vitro and in vivo at the levels of primary and metastatic tumor growth. CD24 overexpression in HIF-1α-depleted cancer cells rescued this decrease, whereas HIF-1α overexpression in CD24-depleted cells did not. Analysis of clinical tumor specimens revealed a correlation between HIF-1α and CD24 levels and an association of their coexpression to decreased patient survival. Our results establish a mechanistic linkage between 2 critically important molecules in cancer, identifying CD24 as a critical HIF-1α transcriptional target and biologic effector, strengthening the rationale to target CD24 for cancer therapy.


Conflict of interest statement

Conflict of interests: None of the authors have any financial conflict of interest that might be construed to influence the results or interpretation of the manuscript.

Figures

Figure 1
Figure 1
A) Molecular concepts map (14, 15) of a core transcriptional signature of the Ral GTPase pathway (“Ral core signature” shown as (yellow ringed node), generated from genes expressed 2-fold higher in control as compared to Ral siRNA treated cells (n=32). Each node represents a molecular concept, or set of biologically related genes, while node size is proportional to the number of genes in the concept. The concept color indicates the concept type according to the legend. Each edge represents a significant enrichment (p<1E-4), with the thick edge representing the most significantly enriched concept. Several concepts implicate hypoxia (Nodes #1, 3, 4, & 5), while others are likely reflective of known functions of Ral, including acting downstream of Ras (Node #7) or small T antigen (Node #6). B). UMUC-3, PC-3 cells were exposed to hypoxia for various time periods as indicated. RNA extracted from these samples was analyzed by real-time quantitative PCR for CD24 mRNA expression. Paired lysates were analyzed for CD24 protein expression by western. *Significant difference compared to samples at 0h (p<0.01). C) Immunohistochemical (IHC) evaluation of CD24 expression in UMUC-3 tumor xenograft sections and corresponding Pimonidazole (Hypoxyprobe) staining and H&E (hematoxylin & eosin) staining in serial sections. Magnification indicated. D) UMUC-3 and PC-3 cells exposed to hypoxia for various time periods as indicated examined for HIF-1α and CD24 protein and mRNA expression. *Significant difference to the samples at 0h (p<0.01). * Significant difference to the samples at 0h (p<0.05). B, C and D) Blots are representative of three separate experiments. Error bars are SD of triplicate samples from one of three independent experiments.
Figure 2
Figure 2
A) Deletion mutants of the 5’-flanking region of CD24 gene. B) Deletion mutants were transiently transfected in UMUC-3 cells and the effect of deletions on hypoxia mediated promoter activity was assessed by measuring luciferase activity as explained in Methods. * Compared to PGL-3 vector transfected cells in grown in normoxia (p<0.01), # Compared to PGL-3 vector transfected cells exposed to hypoxia (p<0.01). C) Site directed mutation of HIF-1 binding site on CD24 promoter. The region CGTG between −118 and −135 on CD24 promoter was mutated to AAAA. D) Functional activity of these mutations were measured by transfecting wild type and mutated HIF-1 element followed by exposing them to normoxia, hypoxia or by co-transfecting HIF-1α transgene together. The results are representative of three independent experiments. *Compared to wild type CD24 promoter reporter transfected cells exposed to normoxia, hypoxia or after introduction of HIF-1 transgene (p<0.01)
Figure 3
Figure 3
A) UMUC-3 cells transfected with pcDNA 3.1 vector, wild type HIF-1α and HIF-1α siRNA cells after exposure to 24 hours of hypoxia and mRNA expression of HIF-1α and CD24 assessed by quantitative realtime-PCR. * p<0.05, significantly different form pcDNA 3.1 transfected UMUC-3 cells. B) Corresponding proteins from A were analyzed for CD24 HIF-1α and HIF-2α expression by western blotting as explained in methods. The bar graph shows the fold change in expression of CD24 in all respective lanes normalized to α-tubulin OD values. * p<0.05, significantly different form pcDNA 3.1 transfected UMUC-3 cells. C) ChIP assay was performed on extracts from cells exposed to 12 hours of hypoxia and normoxia of UMUC-3 cells. HIF-1α immunoprecipitation was performed using specific anti-HIF-1α antibody. Primers spanning the HIF-1 binding region on CD24 promoter was used for quantitative real-time PCR amplification. The bars represent the normalized abundance of CD24 promoter region in these immunoprecipitated samples. IgG and Pol-II bars indicate the PCR amplification obtained when extracts were immunoprecipitated with a nonimmune mouse immunoglobulin and an antibody raised against the RNA polymerase II (Pol2 II). A–C) Blots are representative of three separate experiments. Error bars are SD of triplicate samples from one of three independent experiments.
Figure 4
Figure 4
A) Effect of CD24 depletion on lung colonization of UMUC-3 cells: i) Western blots characterizing stable cell lines pre-inoculation; bands were quantified (numbers in figure) as described in the Methods ii) BLI images of representative animals; iii) Graph of mean radiance measured; iv) Human genomic DNA measured using 12p PCR in lung extracted from mice. Inset: Representative Bouin’s stained lungs metastasis development at 6 weeks. Arrows indicate surface metastasis sites. B) Effect of CD24 knock-down on metastasis of PC-3 cells: i) Western blots characterizing stable cell lines pre-inoculation; bands were quantified (numbers in figure) as described in the Methods ii) BLI images of representative animals; iii) Comparison of overall survival of mice injected with PC-3 CD24shRNA cells and non-target controls. (p=0.002 by Log Rank (Mantel-Cox) test of equality of survival distributions).
Figure 5
Figure 5
A) Western blot of UMUC-3 cells transfected with pcDNA 3.1 vector, non-target control shRNA (NT-shRNA), HIF-1α shRNA, and CD24 overexpressed in HIF-1α shRNA transduced cells as explained in Methods. Bands were quantified as described in the Methods (numbers in figure). Data shown are representative blots of three separate experiments. B) Monolayer cell growth of 1000 cells / well in 96 well plate was estimated using “Live-Dead” assay (Molecular Probes) after 24 hours of exposed in normoxia and hypoxia as described. C) Subcutaneous tumor growth of engineered UMUC-3 cells in nude mice for a period of 25 days post injection. 10 mice were inoculated in each group. Tumor sizes were measured every fourth day and quantitated as in the Methods. * p=0.013, volume of tumors produced by UMUC-3-HIF-1α shRNA cells are significantly different form UMUC-3 NTshRNA cells. D) Quantitation of in vivo lung metastasis of HIF-1α and CD24 modified UMUC-3 cells by visual evaluation of surface lung metastases and total lung 12p quantitative PCR in mice injected via tail vein (n=8). Inset: Representative Bouin’s stained images of lung metastasis development at 8 weeks. Arrows indicate surface metastasis sites (visual quantitation of lung metastasis is shown in Supplementary Table 1). E) Quantitation of in vivo metastasis of HIF-1α and CD24 modified PC-3 cells injected orthotopically in prostate by Bioluminescence imaging (BLI) (n=8). Inset: Representative BLI images showing distant metastasis. Significant difference compared to BLI signal at 6 weeks post inoculation in NTshRNA group of animals (p<0.01). F) Kaplan Meyer curves indicating the survival as defined in materials and methods of nude mice injected with HIF-1α and CD24 modified PC-3 cells.
Figure 6
Figure 6
A) Western blot of UMUC-3 cells transfected with pcDNA 3.1 vector, non-target control shRNA (NT-shRNA), HIF-1α overexpressing, and CD24 shRNA transduced in HIF-1α overexpressed cells as explained in Methods. Bands were quantified as described in the Methods (numbers in figure). Data shown are representative blots of three separate experiments. B) Monolayer cell growth of 1000 cells / well in 96 well plate was estimated using “Live-Dead” assay (Molecular Probes) after 24 hours of exposed in normoxia and hypoxia as described. C) Subcutaneous tumor growth of engineered UMUC-3 cells in nude mice for a period of 25 days post injection. 10 mice were inoculated in each group. Tumor sizes were measured every fourth day and quantitated as in the Methods. * p=0.024, volume of tumors produced by UMUC-3-HIF-1α CD24shRNA cells are significantly different form UMUC-3 NTshRNA or HIF-1α over expressing UMUC-3 cells. D) Quantitation of in vivo lung metastasis of HIF-1α and CD24 modified UMUC-3 cells by visual evaluation of surface lung metastases and total lung 12p quantitative PCR in mice injected via tail vein (n=8). E) Quantitation of in vivo metastasis of HIF-1α and CD24 modified PC-3 cells injected orthotopically in prostate by Bioluminescence imaging (BLI) (n=8). Inset: Representative BLI images showing distant metastasis. Significant difference compared to BLI signal at 6 weeks post inoculation in NTshRNA group of animals (p<0.01). F) Kaplan Meyer curves indicating the survival as defined in materials and methods of nude mice injected with HIF-1α and CD24 modified PC-3 cells.
Figure 7
Figure 7
A–B) Representative 0+ (%0 nuclear positivity) and 3+ (>50% nuclear positivity) staining of HIF-1α on tissue microarray cores of human urothelial carcinoma, respectively. C–D) Representative 1+ (weak intensity) and 3+ (diffuse, intense) CD24 staining, respectively. E) Kaplan Meier analysis of overall survival post cystectomy of 101 urothelial carcinomas from the tissue microarray, stratified as a function of i) CD24 level (low CD24 (0+, 1+, N=31) and high CD24 (2+ and 3+, N=70)). Differences evaluated by Log Rank test. ii) Similar analysis to that of i) but comparing survival stratified by low HIF-1α (0+ and 1+ nuclear positivity, N=29) and high HIF-1α (2+ and 3+, N=72). F) Similar analysis to that in E but examining survival as a function of HIF-1α and CD24 combined (HIF+CD24) score, comparing low scores (0+, 1+, and 2+, N=16) to high scores (3+ to 6+, N).

References

    1. Giaccia AJ, Simon MC, Johnson R. The biology of hypoxia: the role of oxygen sensing in development, normal function, and disease. Genes Dev. 2004;18:2183–94. - PMC - PubMed
    1. Semenza GL. Targeting HIF-1 for cancer therapy. Nat Rev Cancer. 2003;3:721–32. - PubMed
    1. Sutherland RM. Tumor hypoxia and gene expression--implications for malignant progression and therapy. Acta Oncol. 1998;37:567–74. - PubMed
    1. Sullivan R, Graham CH. Hypoxia-driven selection of the metastatic phenotype. Cancer Metastasis Rev. 2007;26:319–31. - PubMed
    1. Kristiansen G, Sammar M, Altevogt P. Tumour biological aspects of CD24, a mucin-like adhesion molecule. J Mol Histol. 2004;35:255–62. - PubMed

Publication types

MeSH terms