

Mannose-capped Lipoarabinomannan from Mycobacterium tuberculosis induces soluble tumor necrosis factor receptor production through tumor necrosis factor alpha-converting enzyme activation
- PMID: 22927046
- PMCID: PMC3486036
- DOI: 10.1128/IAI.00060-12
Mannose-capped Lipoarabinomannan from Mycobacterium tuberculosis induces soluble tumor necrosis factor receptor production through tumor necrosis factor alpha-converting enzyme activation
Erratum in
- Infect Immun. 2013 Feb;81(2):618. Kim, Yun Seong [added]
Abstract
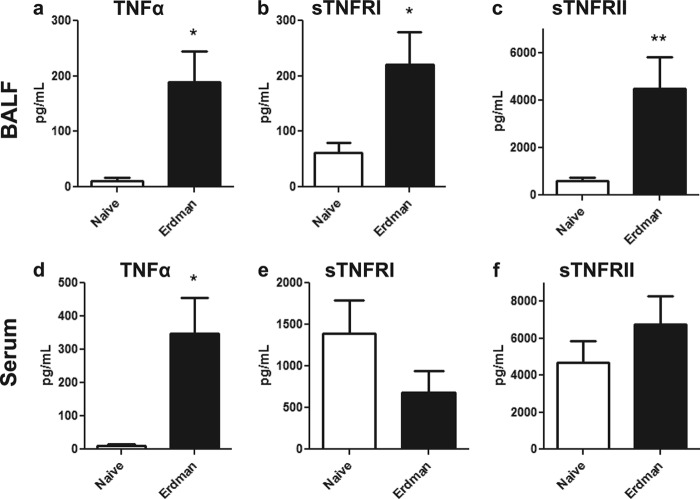
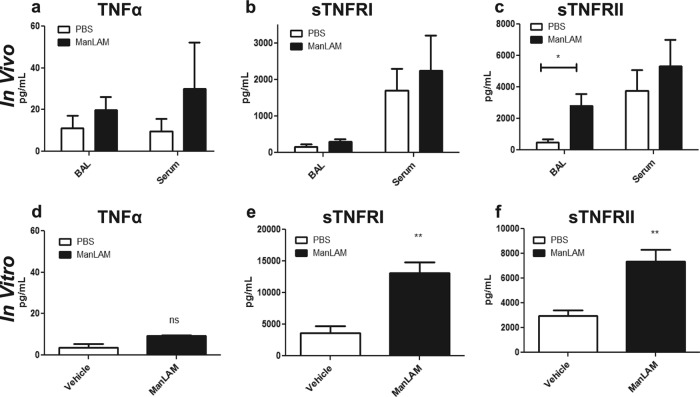
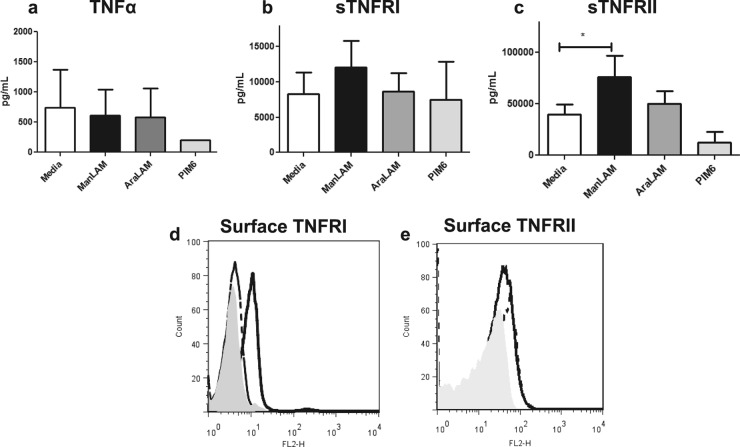
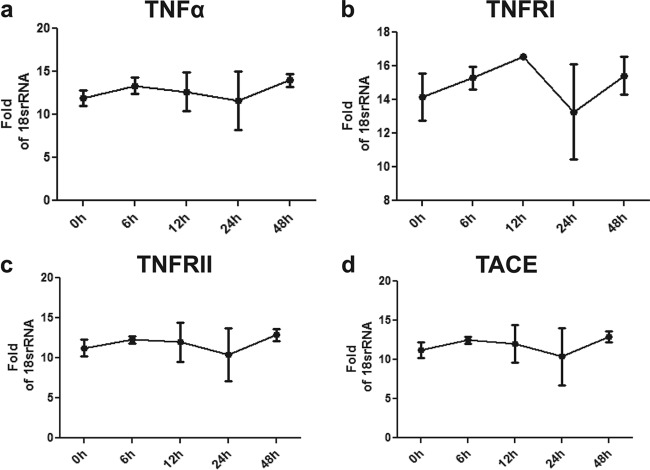
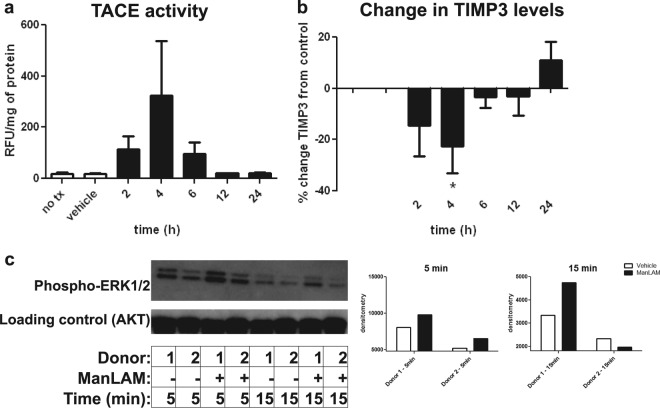
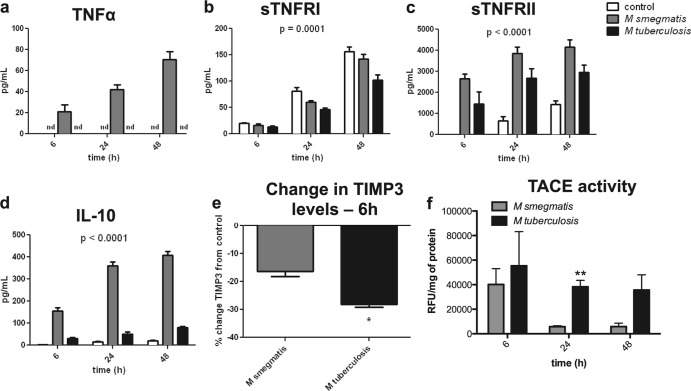
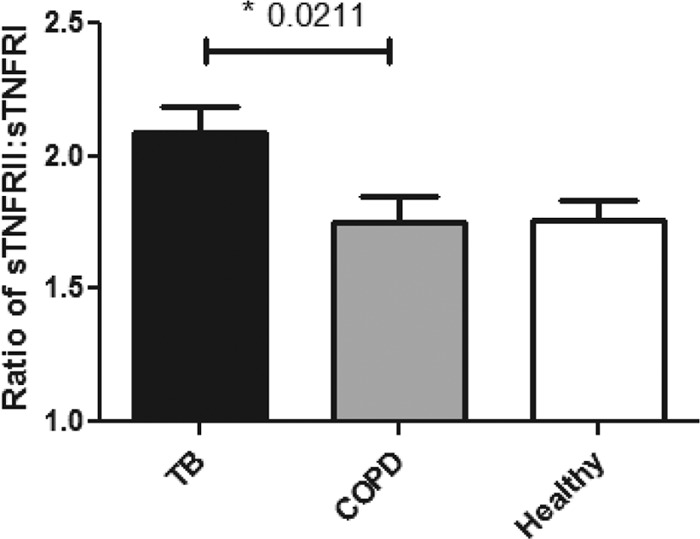
Primary Mycobacterium tuberculosis infection results in granuloma formation in lung tissue. A granuloma encapsulates mycobacterium-containing cells, thereby preventing dissemination and further infection. Tumor necrosis factor alpha (TNF-α) is a host-protective cytokine during M. tuberculosis infection due to its role in promoting and sustaining granuloma formation. TNF activity is regulated through the production of soluble TNF receptors (sTNFRI and sTNFRII). Therefore, we examined the potential production of endogenous sTNFRs during M. tuberculosis infection. Using the murine model of aerosol M. tuberculosis infection, we determined that levels of sTNFR production were elevated in bronchoalveolar lavage fluid 1 month following infection. An investigation of M. tuberculosis cell wall components identified that the known virulence factor mannose-capped lipoarabinomannan (ManLAM) was sufficient to induce sTNFR production, with sTNFRII being produced preferentially compared with sTNFRI. ManLAM stimulated the release of sTNFRs without TNF production, which corresponded to an increase in TNF-α-converting enzyme (TACE) activity. To determine the relevance of these findings, serum samples from M. tuberculosis-infected patients were tested and found to have an increase in the sTNFRII/sTNFRI ratio. These data identify a mechanism by which M. tuberculosis infection can promote the neutralization of TNF and furthermore suggest the potential use of the sTNFRII/sTNFRI ratio as an indicator of tuberculosis disease.
Figures
Similar articles
-
Mycobacterium tuberculosis mannose-capped lipoarabinomannan can induce NF-kappaB-dependent activation of human immunodeficiency virus type 1 long terminal repeat in T cells.J Gen Virol. 1998 Jun;79 ( Pt 6):1353-61. doi: 10.1099/0022-1317-79-6-1353. J Gen Virol. 1998. PMID: 9634075
-
Mycobacterium tuberculosis lipoarabinomannan enhances LPS-induced TNF-α production and inhibits NO secretion by engaging scavenger receptors.Microb Pathog. 2011 Jun;50(6):350-9. doi: 10.1016/j.micpath.2011.03.001. Epub 2011 Mar 23. Microb Pathog. 2011. PMID: 21419839
-
Role of cellular activation and tumor necrosis factor-alpha in the early expression of Mycobacterium tuberculosis 85B mRNA in human alveolar macrophages.J Infect Dis. 2004 Jul 15;190(2):341-51. doi: 10.1086/421522. Epub 2004 Jun 18. J Infect Dis. 2004. PMID: 15216471
-
Mannose-capped lipoarabinomannan in Mycobacterium tuberculosis pathogenesis.Pathog Dis. 2018 Jun 1;76(4):fty026. doi: 10.1093/femspd/fty026. Pathog Dis. 2018. PMID: 29722821 Free PMC article. Review.
-
TNF-alpha in tuberculosis: a cytokine with a split personality.Inflamm Allergy Drug Targets. 2009 Mar;8(1):53-62. doi: 10.2174/187152809787582543. Inflamm Allergy Drug Targets. 2009. PMID: 19275693 Review.
Cited by
-
Immunological recovery in patients with pulmonary tuberculosis after intensive phase treatment.J Int Med Res. 2018 Sep;46(9):3539-3551. doi: 10.1177/0300060518773258. Epub 2018 May 13. J Int Med Res. 2018. PMID: 29756540 Free PMC article.
-
Attenuation of Excess TNF-α Release in Crohn's Disease by Silencing of iRHOMs 1/2 and the Restoration of TGF-β Mediated Immunosuppression Through Modulation of TACE Trafficking.Front Immunol. 2022 May 2;13:887830. doi: 10.3389/fimmu.2022.887830. eCollection 2022. Front Immunol. 2022. PMID: 35585977 Free PMC article.
-
Mycobacterium tuberculosis Methyltransferase Rv1515c Can Suppress Host Defense Mechanisms by Modulating Immune Functions Utilizing a Multipronged Mechanism.Front Mol Biosci. 2022 Jun 24;9:906387. doi: 10.3389/fmolb.2022.906387. eCollection 2022. Front Mol Biosci. 2022. PMID: 35813825 Free PMC article.
-
The rs11684747 and rs55790676 SNPs of ADAM17 influence tuberculosis susceptibility and plasma levels of TNF, TNFR1, and TNFR2.Front Microbiol. 2024 May 31;15:1392782. doi: 10.3389/fmicb.2024.1392782. eCollection 2024. Front Microbiol. 2024. PMID: 38881671 Free PMC article.
-
Manipulation of the endocytic pathway and phagocyte functions by Mycobacterium tuberculosis lipoarabinomannan.Front Cell Infect Microbiol. 2015 Jan 12;4:187. doi: 10.3389/fcimb.2014.00187. eCollection 2014. Front Cell Infect Microbiol. 2015. PMID: 25629008 Free PMC article. Review.
References
-
- Aggarwal BB. 2003. Signalling pathways of the TNF superfamily: a double-edged sword. Nat. Rev. Immunol. 3:745–756 - PubMed
-
- Algood HMS, Lin PL, Flynn JL. 2005. Tumor necrosis factor and chemokine interactions in the formation and maintenance of granulomas in tuberculosis. Clin. Infect. Dis. 41(Suppl 3):S189–S193 doi:10.1086/429994 - DOI - PubMed
-
- Amour A, et al. 1998. TNF-alpha converting enzyme (TACE) is inhibited by TIMP-3. FEBS Lett. 435:39–44 - PubMed
-
- Balcewicz-Sablinska MK, Keane J, Kornfeld H, Remold HG. 1998. Pathogenic Mycobacterium tuberculosis evades apoptosis of host macrophages by release of TNF-R2, resulting in inactivation of TNF-alpha. J. Immunol. 161:2636–2641 - PubMed
Publication types
MeSH terms
Substances
Grants and funding
LinkOut - more resources
Full Text Sources
Miscellaneous
