

Escape from Adaptive Conflict follows from weak functional trade-offs and mutational robustness
- PMID: 22927372
- PMCID: PMC3443171
- DOI: 10.1073/pnas.1115620109
Escape from Adaptive Conflict follows from weak functional trade-offs and mutational robustness
Abstract
A fundamental question in molecular evolution is how proteins can adapt to new functions while being conserved for an existing function at the same time. Several theoretical models have been put forward to explain this apparent paradox. The most popular models include neofunctionalization, subfunctionalization (SUBF) by degenerative mutations, and dosage models. All of these models focus on adaptation after gene duplication. A newly proposed model named "Escape from Adaptive Conflict" (EAC) includes adaptive processes before and after gene duplication that lead to multifunctional proteins, and divergence (SUBF). Support for the importance of multifunctionality for the evolution of new protein functions comes from two experimental observations. First, many enzymes have highly evolvable promiscuous side activities. Second, different structural states of the same protein can be associated with different functions. How these observations may be related to the EAC model, under which conditions EAC is possible, and how the different models relate to each other is still unclear. Here, we present a theoretical framework that uses biophysical principles to infer the roles of functional promiscuity, gene dosage, gene duplication, point mutations, and selection pressures in the evolution of proteins. We find that selection pressures can determine whether neofunctionalization or SUBF is the more likely evolutionary process. Multifunctional proteins, arising during EAC evolution, allow rapid adaptation independent of gene duplication. This becomes a crucial advantage when gene duplications are rare. Finally, we propose that an increase in mutational robustness, not necessarily functional optimization, can be the sole driving force behind SUBF.
Conflict of interest statement
The authors declare no conflict of interest.
Figures
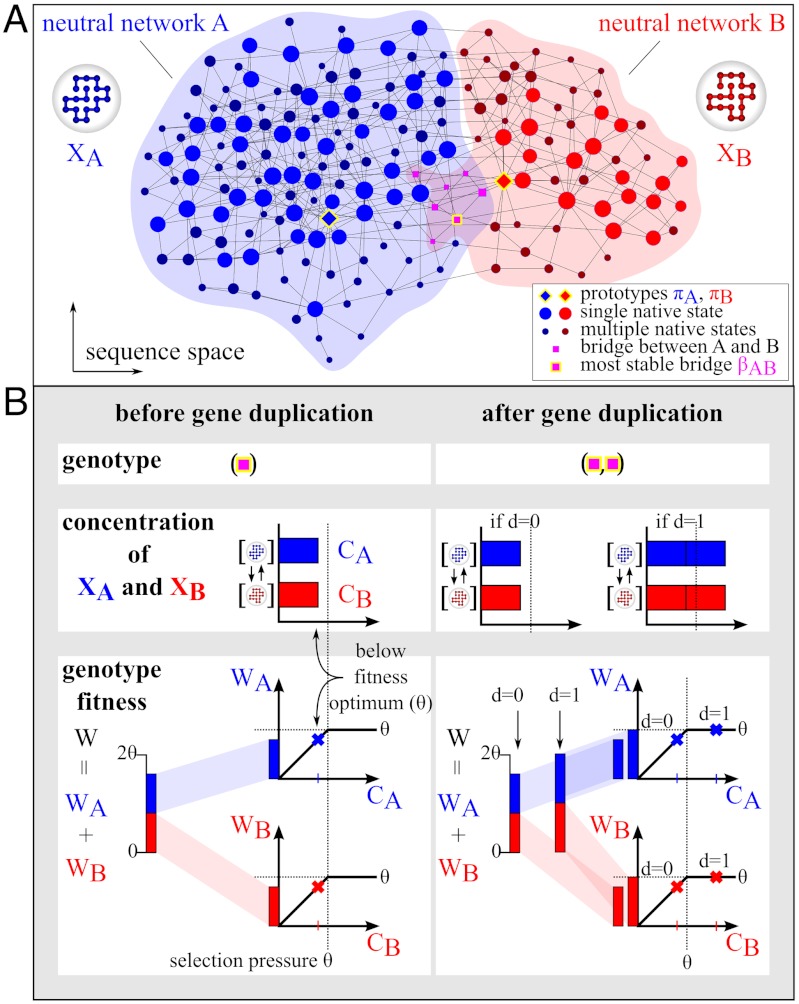
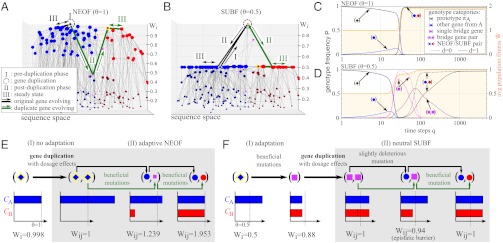
 is plotted in orange (right vertical scale). Evolution in the two scenarios of dosage effect after gene duplication (d = 0 or 1) are also compared. (E, F) Schematics of evolutionary steps during NEOF (E) and SUBF (F) with dosage effects (d = 1). Genotype fitness is given as Wi (single genes) or Wij (gene pairs) that depends on protein concentrations CA and CB (cf. Fig. 1B).
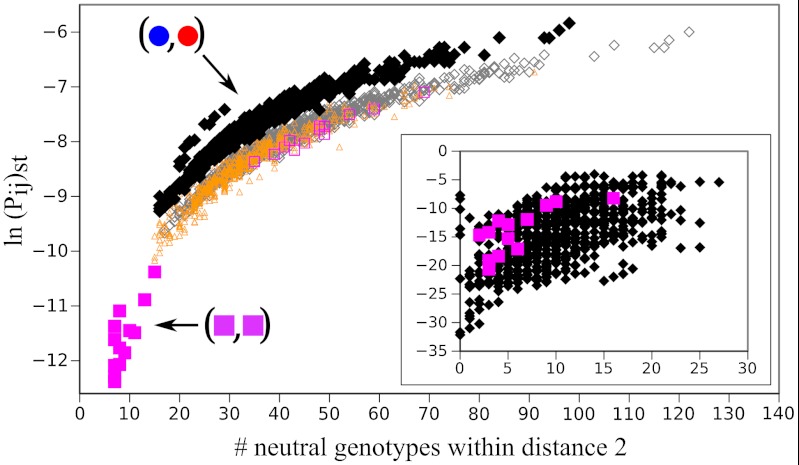
 were obtained from the SUBF simulations in Fig. 2D (θ = 0.5 and d = 1). The scatter plot shows ln(Pij)st versus the number of genotypes that are within two point mutations from (i,j) in the network. Data points for the 24 bridge pairs and 1,728 subfunctionalized pairs are plotted, respectively, by filled magenta squares and black diamonds. The plot thus contains all 1,752 genotypes with maximum fitness at steady state (among all 34,410 genotypes—single genes and gene pairs—for XA and XB in Fig. 1A). The corresponding scatter plot for a randomized network topology is shown in the Inset. Results from a control simulation that artificially eliminated the epistatic barriers are shown by the open symbols. Magenta squares, orange triangles, and gray diamonds represent data points for bridge, mixed, and SUBF pairs, respectively. The inclusion of mixed pairs with ad hoc optimal fitness leads to increased numbers of neutral genotypes adjacent to the bridge pairs and thus abolishes the separation between bridge and SUBF pairs observed in the original model. Nevertheless, a tight correlation between ln(Pij)st and genotype entropy is maintained and SUBF pairs remain the most populated steady-state genotypes.
References
-
- Ohno S. Evolution by Gene Duplication. New York: Springer; 1970.
-
- Conant GC, Wolfe KH. Turning a hobby into a job: How duplicated genes find new functions. Nat Rev Genet. 2008;9:938–950. - PubMed
-
- Innan H, Kondrashov FA. The evolution of gene duplications: Classifying and distinguishing between models. Nat Rev Genet. 2010;11:97–108. - PubMed
-
- Hittinger CT, Carroll SB. Gene duplication and the adaptive evolution of a classic genetic switch. Nature. 2007;449:677–681. - PubMed
Publication types
MeSH terms
Substances
Grants and funding
LinkOut - more resources
Full Text Sources
