

Structure and dynamics of protein waters revealed by radiolysis and mass spectrometry
- PMID: 22927377
- PMCID: PMC3443160
- DOI: 10.1073/pnas.1209060109
Structure and dynamics of protein waters revealed by radiolysis and mass spectrometry
Abstract
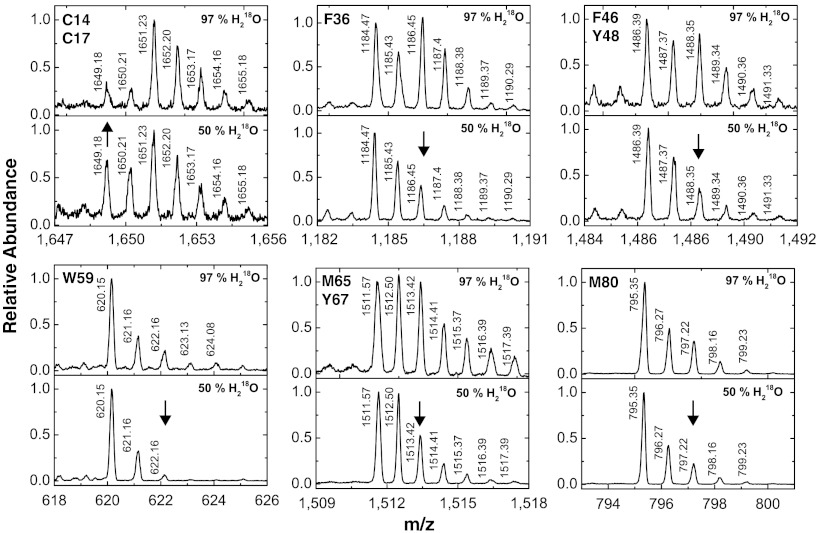
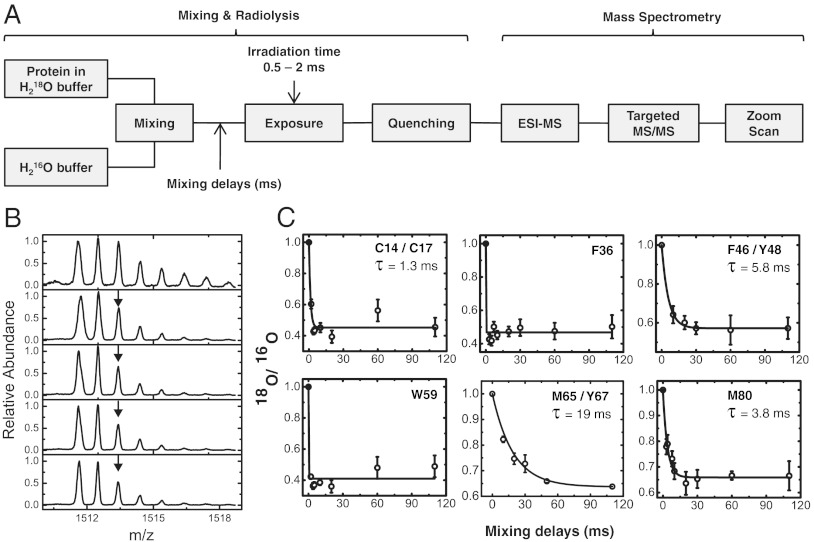
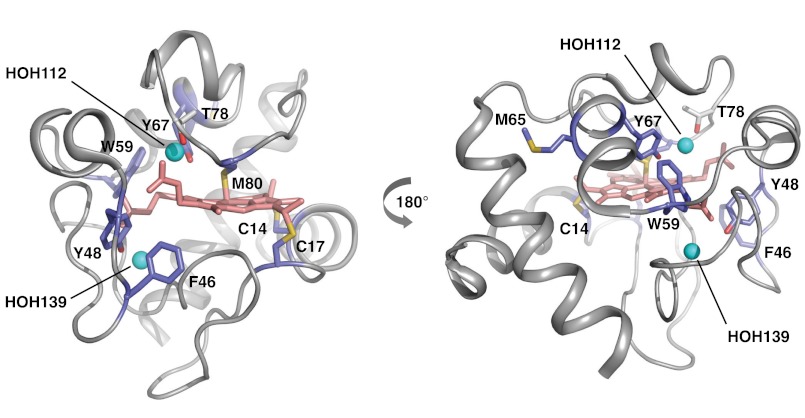
Water is critical for the structure, stability, and functions of macromolecules. Diffraction and NMR studies have revealed structure and dynamics of bound waters at atomic resolution. However, localizing the sites and measuring the dynamics of bound waters, particularly on timescales relevant to catalysis and macromolecular assembly, is quite challenging. Here we demonstrate two techniques: first, temperature-dependent radiolytic hydroxyl radical labeling with a mass spectrometry (MS)-based readout to identify sites of bulk and bound water interactions with surface and internal residue side chains, and second, H(2)(18)O radiolytic exchange coupled MS to measure the millisecond dynamics of bound water interactions with various internal residue side chains. Through an application of the methods to cytochrome c and ubiquitin, we identify sites of water binding and measure the millisecond dynamics of bound waters in protein crevices. As these MS-based techniques are very sensitive and not protein size limited, they promise to provide unique insights into protein-water interactions and water dynamics for both small and large proteins and their complexes.
Conflict of interest statement
The authors declare no conflict of interest.
Figures

Similar articles
-
Visualizing water molecules in transmembrane proteins using radiolytic labeling methods.Biochemistry. 2010 Feb 9;49(5):827-34. doi: 10.1021/bi901889t. Biochemistry. 2010. PMID: 20047303 Free PMC article. Review.
-
Radiolytic protein footprinting with mass spectrometry to probe the structure of macromolecular complexes.Annu Rev Biophys Biomol Struct. 2006;35:251-76. doi: 10.1146/annurev.biophys.35.040405.102050. Annu Rev Biophys Biomol Struct. 2006. PMID: 16689636 Review.
-
Structural waters define a functional channel mediating activation of the GPCR, rhodopsin.Proc Natl Acad Sci U S A. 2009 Aug 25;106(34):14367-72. doi: 10.1073/pnas.0901074106. Epub 2009 Aug 13. Proc Natl Acad Sci U S A. 2009. PMID: 19706523 Free PMC article.
-
Millisecond radiolytic modification of peptides by synchrotron X-rays identified by mass spectrometry.Anal Chem. 1999 Sep 15;71(18):3965-73. doi: 10.1021/ac990500e. Anal Chem. 1999. PMID: 10500483
-
Using X-ray Footprinting and Mass Spectrometry to Study the Structure and Function of Membrane Proteins.Protein Pept Lett. 2019;26(1):44-54. doi: 10.2174/0929866526666181128142401. Protein Pept Lett. 2019. PMID: 30484402 Free PMC article. Review.
Cited by
-
Fast Protein Footprinting by X-ray Mediated Radical Trifluoromethylation.J Am Soc Mass Spectrom. 2020 May 6;31(5):1019-1024. doi: 10.1021/jasms.0c00085. Epub 2020 Apr 21. J Am Soc Mass Spectrom. 2020. PMID: 32255631 Free PMC article.
-
Synchrotron X-ray footprinting as a method to visualize water in proteins.J Synchrotron Radiat. 2016 Sep 1;23(Pt 5):1056-69. doi: 10.1107/S1600577516009024. Epub 2016 Jul 27. J Synchrotron Radiat. 2016. PMID: 27577756 Free PMC article.
-
A hybrid structural approach to analyze ligand binding by the serotonin type 4 receptor (5-HT4).Mol Cell Proteomics. 2013 May;12(5):1259-71. doi: 10.1074/mcp.M112.025536. Epub 2013 Feb 1. Mol Cell Proteomics. 2013. PMID: 23378516 Free PMC article.
-
The Hydration Shell of Monomeric and Dimeric Insulin Studied by Terahertz Time-Domain Spectroscopy.Biophys J. 2019 Aug 6;117(3):533-541. doi: 10.1016/j.bpj.2019.06.028. Epub 2019 Jul 3. Biophys J. 2019. PMID: 31326108 Free PMC article.
-
Synchrotron X-ray footprinting on tour.J Synchrotron Radiat. 2014 Jan;21(Pt 1):24-31. doi: 10.1107/S1600577513024715. Epub 2013 Nov 2. J Synchrotron Radiat. 2014. PMID: 24365913 Free PMC article.
References
-
- Carugo O, Bordo D. How many water molecules can be detected by protein crystallography? Acta Crystallogr D Biol Crystallogr. 1999;55:479–483. - PubMed
-
- Jiang JS, Brunger AT. Protein hydration observed by X-ray diffraction. Solvation properties of penicillopepsin and neuraminidase crystal structures. J Mol Biol. 1994;243:100–115. - PubMed
Publication types
MeSH terms
Substances
Grants and funding
LinkOut - more resources
Full Text Sources
Other Literature Sources
Research Materials
