Unifying the spatial epidemiology and molecular evolution of emerging epidemics
- PMID: 22927414
- PMCID: PMC3443149
- DOI: 10.1073/pnas.1206598109
Unifying the spatial epidemiology and molecular evolution of emerging epidemics
Abstract
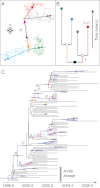
We introduce a conceptual bridge between the previously unlinked fields of phylogenetics and mathematical spatial ecology, which enables the spatial parameters of an emerging epidemic to be directly estimated from sampled pathogen genome sequences. By using phylogenetic history to correct for spatial autocorrelation, we illustrate how a fundamental spatial variable, the diffusion coefficient, can be estimated using robust nonparametric statistics, and how heterogeneity in dispersal can be readily quantified. We apply this framework to the spread of the West Nile virus across North America, an important recent instance of spatial invasion by an emerging infectious disease. We demonstrate that the dispersal of West Nile virus is greater and far more variable than previously measured, such that its dissemination was critically determined by rare, long-range movements that are unlikely to be discerned during field observations. Our results indicate that, by ignoring this heterogeneity, previous models of the epidemic have substantially overestimated its basic reproductive number. More generally, our approach demonstrates that easily obtainable genetic data can be used to measure the spatial dynamics of natural populations that are otherwise difficult or costly to quantify.
Conflict of interest statement
The authors declare no conflict of interest.
Figures


References
-
- Snow J. The cholera near Golden Square and at Deptford. Med Times Gazette. 1854;9:321–322.
-
- Skellam JG. Random dispersal in theoretical populations. Biometrika. 1951;38:196–218. - PubMed
-
- Mollison D. Spatial contact models for ecological and epidemic spread. J Roy Stat Soc B. 1977;39:283–326.
-
- Noble JV. Geographic and temporal development of plagues. Nature. 1974;250:726–729. - PubMed
-
- Murray JD, Stanley EA, Brown DL. On the spatial spread of rabies among foxes. Proc R Soc Lond B Biol Sci. 1986;229:111–150. - PubMed
Publication types
MeSH terms
Associated data
- Actions
- Actions
- Actions
- Actions
- Actions
- Actions
- Actions
- Actions
- Actions
- Actions
- Actions
- Actions
- Actions
- Actions
- Actions
- Actions
- Actions
Grants and funding
LinkOut - more resources
Full Text Sources
Other Literature Sources
Medical

