. 2012 Sep 11;109(37):E2424-32.
doi: 10.1073/pnas.1207846109. Epub 2012 Aug 27.

Global mapping of translation initiation sites in mammalian cells at single-nucleotide resolution

Affiliations

Global mapping of translation initiation sites in mammalian cells at single-nucleotide resolution

Sooncheol Lee et al. Proc Natl Acad Sci U S A. .

Abstract

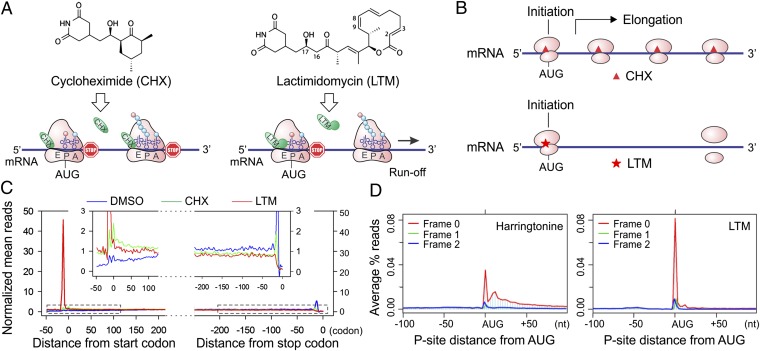
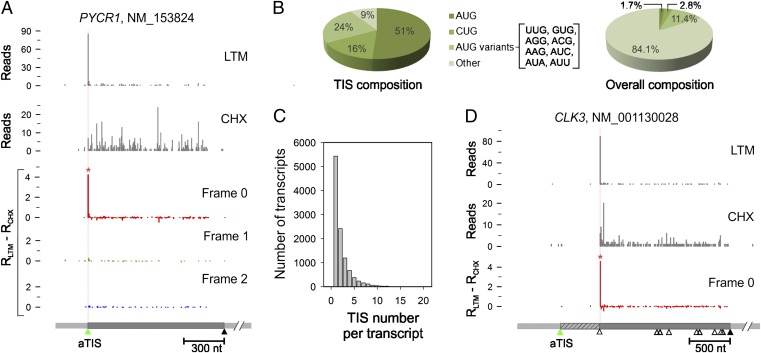
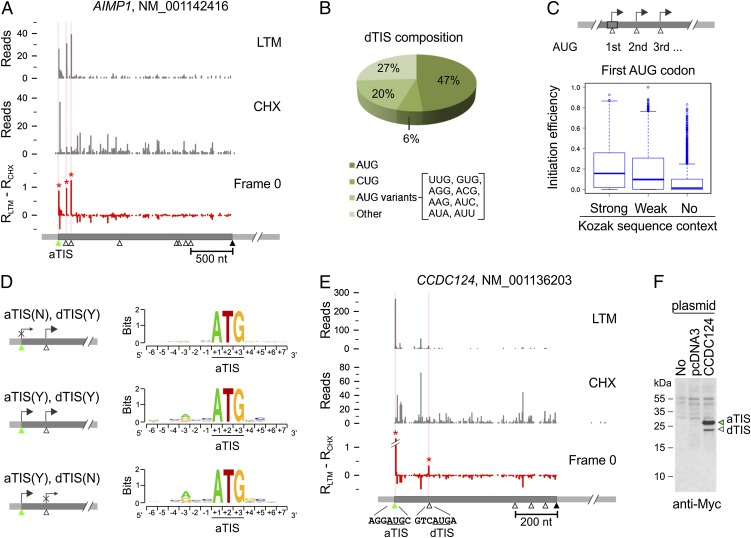
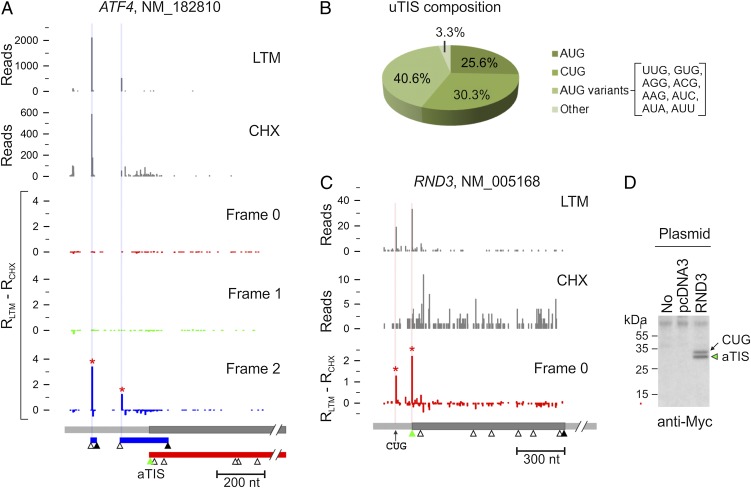
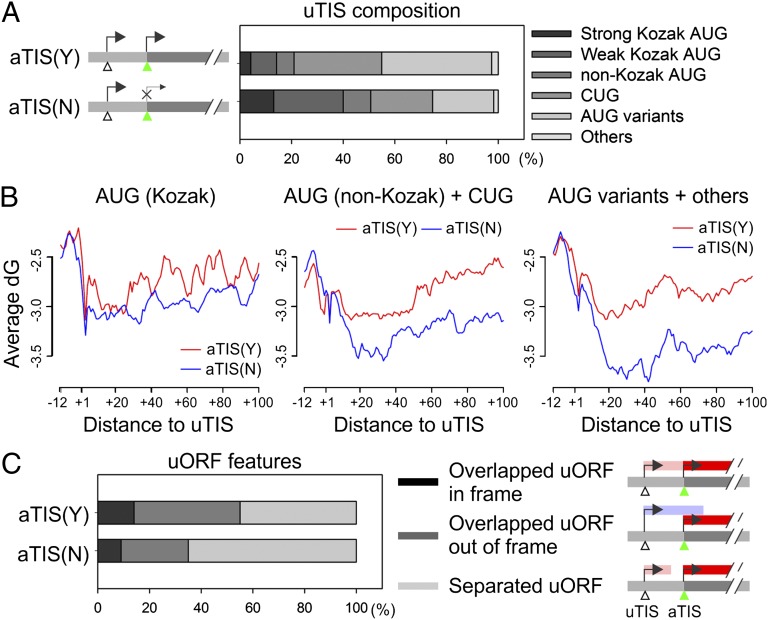
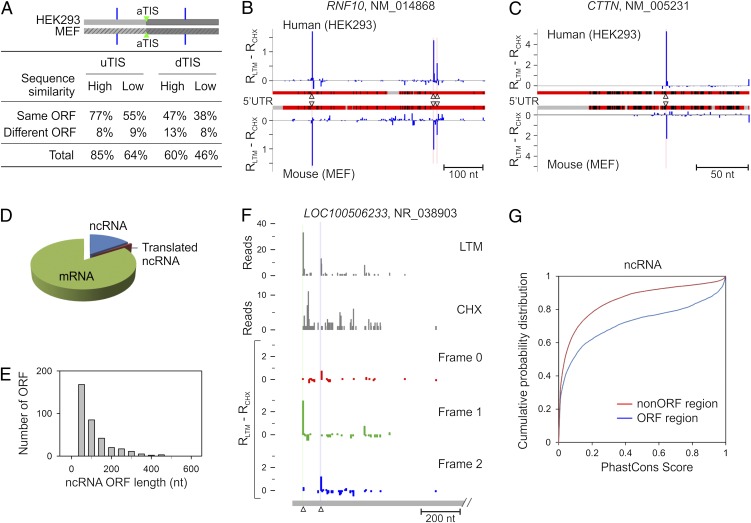
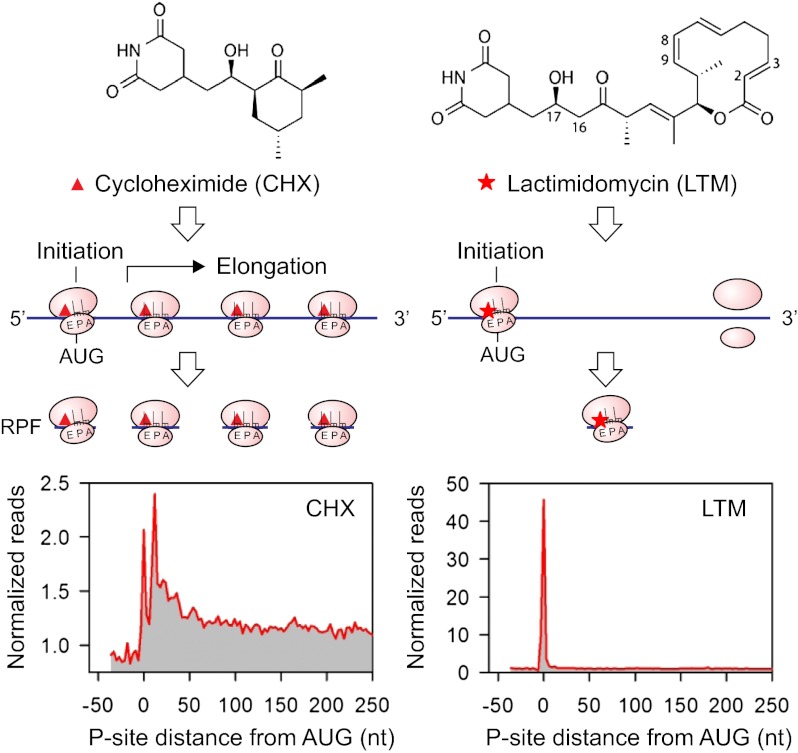
Understanding translational control in gene expression relies on precise and comprehensive determination of translation initiation sites (TIS) across the entire transcriptome. The recently developed ribosome-profiling technique enables global translation analysis, providing a wealth of information about both the position and the density of ribosomes on mRNAs. Here we present an approach, global translation initiation sequencing, applying in parallel the ribosome E-site translation inhibitors lactimidomycin and cycloheximide to achieve simultaneous detection of both initiation and elongation events on a genome-wide scale. This approach provides a view of alternative translation initiation in mammalian cells with single-nucleotide resolution. Systemic analysis of TIS positions supports the ribosome linear-scanning mechanism in TIS selection. The alternative TIS positions and the associated ORFs identified by global translation initiation sequencing are conserved between human and mouse cells, implying physiological significance of alternative translation. Our study establishes a practical platform for uncovering the hidden coding potential of the transcriptome and offers a greater understanding of the complexity of translation initiation.


Conflict of interest statement

The authors declare no conflict of interest.

Figures

Fig. 1.
Fig. 1.
Experimental strategy of GTI-seq using ribosome E-site translation inhibitors. (A) Schematic diagram of the experimental design for GTI-seq. Translation inhibitors CHX and LTM bind to the ribosome E-site, resulting in inhibition of translocation. CHX binds to all translating ribosomes (Left), but LTM preferentially incorporates into the initiating ribosomes when the E-site is free of tRNA (Right). (B) Ribosome profiling using CHX and LTM side by side allows the initiating ribosome to be distinguished from the elongating one. (C) HEK293 cells were treated with DMSO, 100 μM CHX, or 50 μM LTM for 30 min before ribosome profiling. Normalized RPF reads are averaged across the entire transcriptome, aligned at either their start site or stop codon from the 5′ end of RPFs. (D) Metagene analysis of RPFs obtained from HEK293 cells treated with harringtonine (Left) or LTM (Right). All mapped reads are aligned at the annotated start codon AUG, and the density of reads at each nucleotide position is averaged using the P-site of RPFs.
Fig. 2.
Fig. 2.
Global identification of TIS by GTI-seq. (A) TIS identification on the PYCR1 transcript. LTM and CHX reads are plotted as gray bar graphs. TIS identification is based on normalized density of LTM reads minus the density of CHX reads. The three reading frames are separated and presented as distinct colors. The identified TIS position is marked by a red asterisk and highlighted by a vertical line color-coded by the corresponding reading frame. The annotated coding region is indicated by a green triangle (start codon) and a black triangle (stop codon). (B) Codon composition of all TIS codons identified by GTI-seq (Left) is shown in comparison with the overall codon distribution over the entire transcriptome (Right). (C) Histogram showing the overall distribution of TIS numbers identified on each transcript. (D) Misannotation of the start codon on the CLK3 transcript. The annotated coding region is indicated by the green (start codon) and black (stop codon) triangles. AUG codons on the body of the coding region are also shown as open triangles. For clarity, only one reading frame is shown.
Fig. 3.
Fig. 3.
Characterization of dTIS. (A) Identification of multiple TIS codons on the AIMP1 transcript. For clarity, only one reading frame is shown. (B) Codon composition of total dTIS codons identified by GTI-seq. (C) Relative efficiency of initiation at the first AUG codon with different Kozak sequence contexts (one-tailed Wilcoxon rank sum test: strong vs. weak: P = 7.92 × 10⁻²⁴; weak vs. no Kozak context: P = 1.34 × 10−75). (D) Genes are grouped according to the identified initiation at an aTIS, at a dTIS, or at both. The sequence context surrounding the aTIS is shown as sequence logos. χ2 test, P = 2.57 × 10−100 for the −3 position and P = 3.95 × 10⁻¹⁸ for the +4 position. (E) Identification of multiple TIS codons on the CCDC124 transcript. (F) Validation of CCDC124 TIS codons by immunoblotting. The DNA fragment encompassing both the 5′ UTR and the CDS of CCDC124 was cloned and transfected into HEK 293 cells. Whole-cell lysates were immunoblotted using c-myc antibody.
Fig. 4.
Fig. 4.
Characterization of uTIS. (A) Identification of multiple TIS codons on the ATF4 transcript. Inset shows a region of frame 0 with the y axis enlarged 10-fold, showing the LTM peak at the annotated start codon AUG. Different ORFs are shown in boxes color-coded for the different reading frames. (B) Codon composition of total uTIS codons identified by GTI-seq. (C) Identification of multiple TIS codons on the RND3 transcript. (D) Validation of RND3 TIS codons by immunoblotting. The DNA fragment encompassing both the 5′ UTR and the CDS of RND3 was cloned and transfected into HEK 293 cells. Whole-cell lysates were immunoblotted using c-myc antibody.
Fig. 5.
Fig. 5.
Impact of uORF features on translational regulation. (A) The sequence composition of uTIS codons for genes with [aTIS(Y)] or without [aTIS(N)] aTIS initiation. Genes are classified into two groups based on aTIS initiation, and the uTIS sequence composition is categorized based on the consensus features shown on the right. (B) The contribution of mRNA secondary structure to TIS selection. Genes are grouped based on uTIS codon features listed in A. For each group, the transcripts with (red line) or without (blue line) aTIS initiation are analyzed for the averaged Gibbs free energy (ΔG) value in regions surrounding the identified uTIS codons. (C) The composition of uORFs in gene groups with or without aTIS initiation on their transcripts. Different ORF features are shown on the right.
Fig. 6.
Fig. 6.
Cross-species conservation of alternative TIS positions and identification of translated ncRNA. (A) Evolutionary conservation of alternative TIS positions identified by GTI-seq in HEK293 and MEF cells. Alternative uTIS and dTIS positions identified on human-mouse ortholog mRNA pairs are each classified into two subsets according to the alignment score of relevant sequences (5′ UTR for uTIS and CDS for dTIS). Each subset is divided further based on types of alternative ORFs. Percentage values are presented in the table. (B) Conservation of uTIS positions on the RNF10 transcript with high 5′ UTR sequence similarity between HEK293 and MEF cells. Red regions indicate matched sequences, black regions indicate mismatched sequences, and gray regions indicate sequence gaps. Identified uTIS positions are indicated by triangles. (C) Conservation of uTIS positions on the CTTN transcript with low sequence similarity of 5′ UTR between HEK293 and MEF cells. (D) Pie chart showing the relative percentage of mRNA, ncRNA and translated ncRNA identified by GTI-seq. (E) Histogram showing the overall length distribution of ORFs identified in ncRNAs. (F) Identification of multiple TIS positions on the ncRNA LOC100506233. (G) Evolutionary conservation of the ORF region on ncRNAs identified by GTI-seq. PhastCons scores are retrieved from the primate genome sequence alignment.
Fig. P1.
Fig. P1.
Experimental strategy of GTI-seq using ribosome E-site translation inhibitors. CHX and LTM inhibit protein synthesis by binding to the ribosomal E-site, resulting in inhibition of elongation. CHX binds to all translating ribosomes (Left), but LTM incorporates preferentially into the initiating ribosomes when the E-site is free of transfer RNA (Right). Ribosome profiling using CHX and LTM side by side thus distinguishes initiating ribosomes from elongating ribosomes. Treatment of HEK293 cells with 100 μM CHX or 50 μM LTM resulted in different patterns of RPFs as revealed by metagene analysis. CHX-associated RPFs are located mainly in the body of the coding region. Remarkably, LTM-associated RPFs are enriched at the annotated start codon. GTI-seq thus offers a method for uncovering the hidden coding potential of the transcriptome.

References

    1. Sonenberg N, Hinnebusch AG. Regulation of translation initiation in eukaryotes: Mechanisms and biological targets. Cell. 2009;136:731–745. - PMC - PubMed
    1. Jackson RJ, Hellen CU, Pestova TV. The mechanism of eukaryotic translation initiation and principles of its regulation. Nat Rev Mol Cell Biol. 2010;11:113–127. - PMC - PubMed
    1. Gray NK, Wickens M. Control of translation initiation in animals. Annu Rev Cell Dev Biol. 1998;14:399–458. - PubMed
    1. Kozak M. Pushing the limits of the scanning mechanism for initiation of translation. Gene. 2002;299:1–34. - PMC - PubMed
    1. Kozak M. Structural features in eukaryotic mRNAs that modulate the initiation of translation. J Biol Chem. 1991;266:19867–19870. - PubMed

Publication types

MeSH terms

LinkOut - more resources