. 2012 Oct 12;287(42):35565-35575.
doi: 10.1074/jbc.M112.363978. Epub 2012 Aug 27.

Kcnh1 voltage-gated potassium channels are essential for early zebrafish development

Affiliations

Kcnh1 voltage-gated potassium channels are essential for early zebrafish development

Rayk Stengel et al. J Biol Chem. .

Abstract

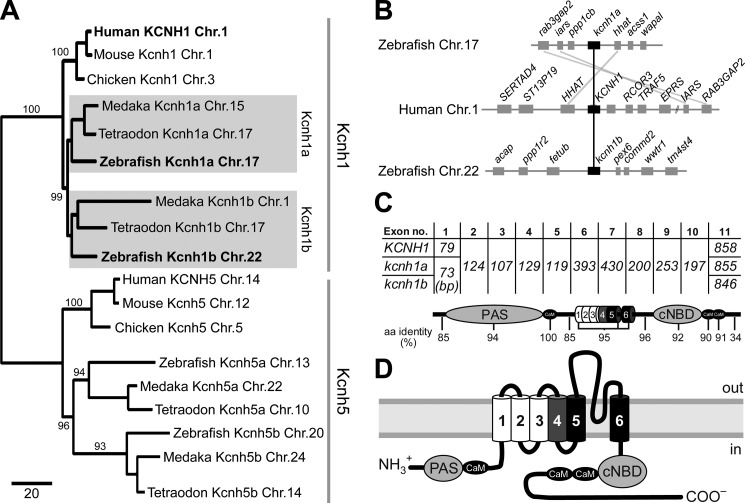
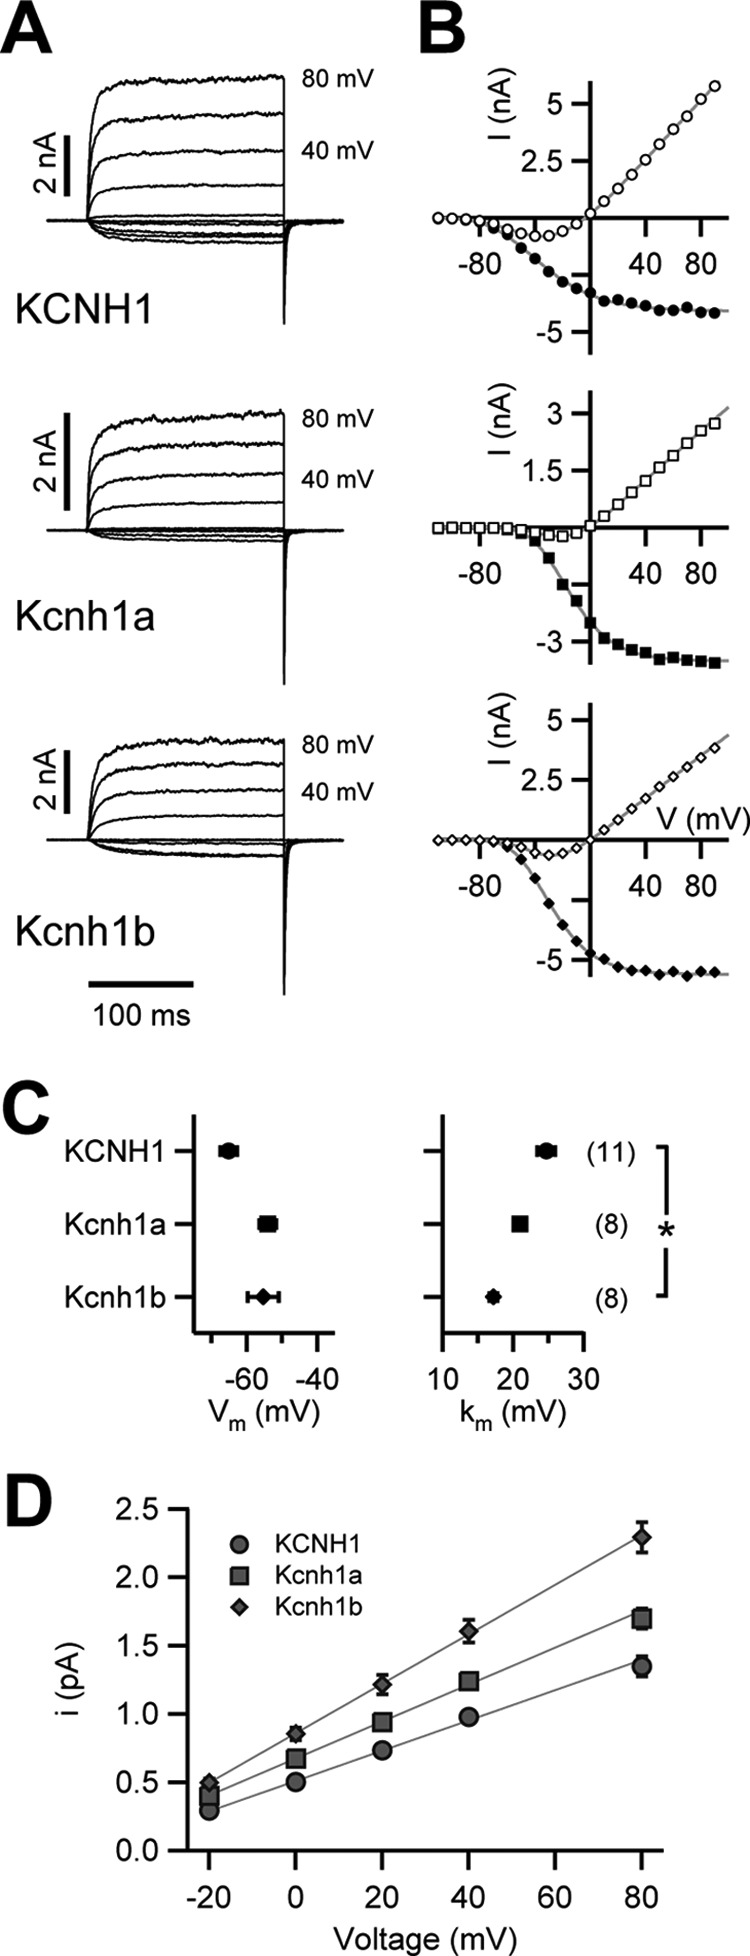
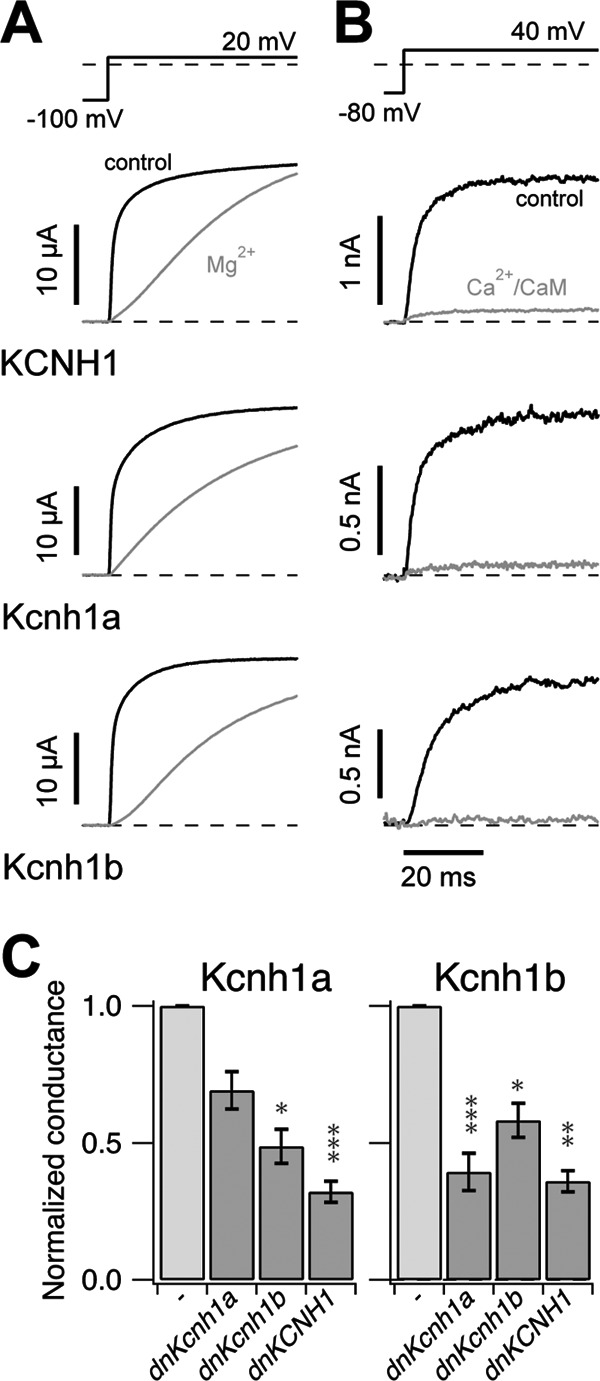
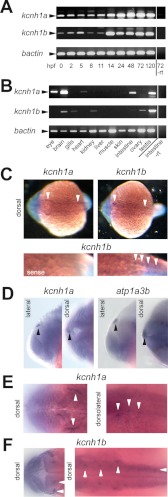
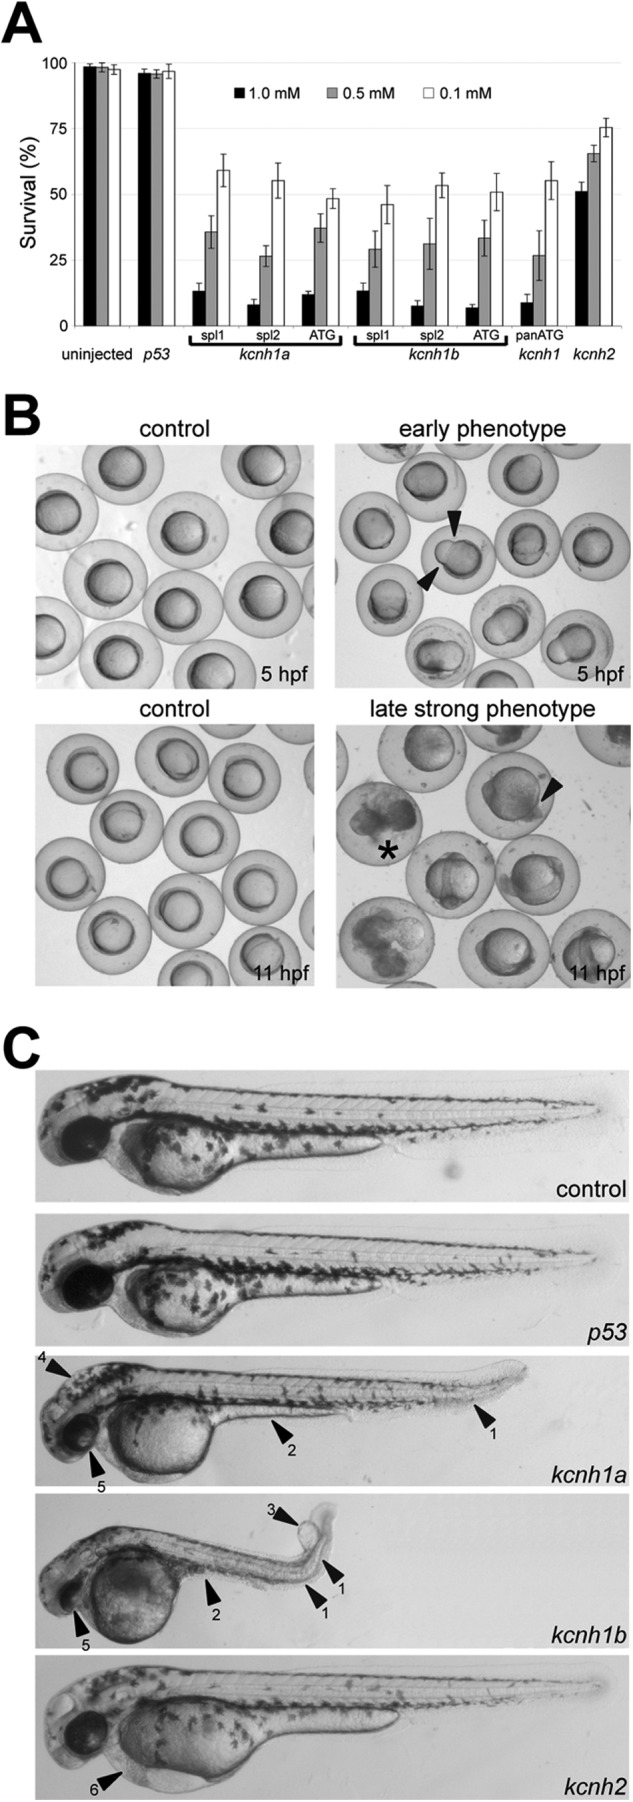
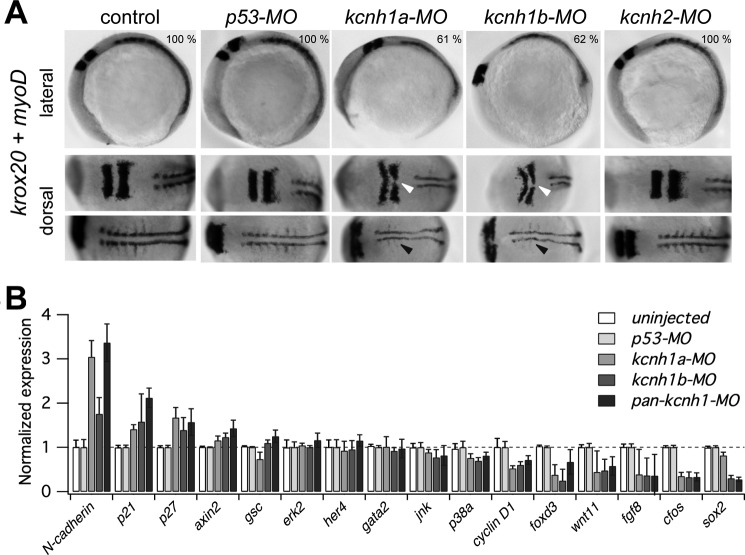
The Kcnh1 gene encodes a voltage-gated potassium channel highly expressed in neurons and involved in tumor cell proliferation, yet its physiological roles remain unclear. We have used the zebrafish as a model to analyze Kcnh1 function in vitro and in vivo. We found that the kcnh1 gene is duplicated in teleost fish (i.e. kcnh1a and kcnh1b) and that both genes are maternally expressed during early development. In adult zebrafish, kcnh1a and kcnh1b have distinct expression patterns but share expression in brain and testis. Heterologous expression of both genes in Xenopus oocytes revealed a strong conservation of characteristic functional properties between human and fish channels, including a unique sensitivity to intracellular Ca(2+)/calmodulin and modulation of voltage-dependent gating by extracellular Mg(2+). Using a morpholino antisense approach, we demonstrate a strong kcnh1 loss-of-function phenotype in developing zebrafish, characterized by growth retardation, delayed hindbrain formation, and embryonic lethality. This late phenotype was preceded by transcriptional up-regulation of known cell-cycle inhibitors (p21, p27, cdh2) and down-regulation of pro-proliferative factors, including cyclin D1, at 70% epiboly. These results reveal an unanticipated basic activity of kcnh1 that is crucial for early embryonic development and patterning.


Figures

FIGURE 1.
FIGURE 1.
Conserved Kcnh1 channels in zebrafish and man. A, shown is a distance-based phylogenetic tree of kcnh1 and kcnh5 genes in three fish genomes and their human, mouse, and chicken orthologs. Fish kcnh1a and kcnh1b paralogs are highlighted with gray boxes. The chromosome (Chr.) number associated with each gene is provided. Numbers at internodes indicate supporting bootstrap values after 1000 iterations. Branch lengths represent the relative amount of molecular divergence as indicated in the scale bar (standardized rate of amino acid replacements per site). B, synteny analysis of human and zebrafish Kcnh1 loci reveal conservation of gene clusters in fish and man. C, shown is exon distribution and amino acid identities among Kcnh1 proteins. Exon lengths in base pairs are indicated for human (KCNH1) and zebrafish (kcnh1a/b) genes. Conserved structural domains of the Kcnh1 proteins are assigned to the corresponding coding exons, and the identity of amino acid sequences between all three proteins is indicated below. D, membrane topology and domain structure of a single Kcnh1 subunit is shown. The positively charged voltage-sensor helix and the two pore helices are indicated in gray and black, respectively. PAS, Per-ARNT-Sim domain; cNBD, cyclic nucleotide-binding domain. Binding sites for Ca2+/CaM are shown as black ovals.
FIGURE 2.
FIGURE 2.
Electrophysiological properties of Kcnh1 channels expressed in Xenopus oocytes. A, current-voltage relationships were determined in inside-out patch configuration. Shown are superimposed current traces for depolarizing 200-ms steps ranging from −110 to +100 mV (from a holding potential of −120 mV) in steps of 10 mV at an interval of 5 s (only traces between −100 and +80 mV are shown, step size 20 mV; +80- and +40-mV traces are labeled). B, shown is mean current within the last 50 ms of the depolarizing steps (open symbols) and peak tail currents at −120 mV (filled symbols) as a function of the test voltage. Superimposed gray curves are fits according to a 4th-order Boltzmann function (tail currents) or a 4th-order Boltzmann function with consideration of a linear conductance (mean currents), yielding a half-maximal voltage of gate activation (Vm) and a corresponding slope factor (km). C, shown are the results of the analysis of steady-state voltage dependence of activation; Vm and km as the mean ± S.E. The numbers of experiments for A–C are shown in parentheses; * denotes statistical difference to the value obtained for KCNH1 with p < 0.05 (Student's t test). D, single-channel conductance determination for zebrafish Kcnh1 channels and human KCNH1 are shown. Single-channel current amplitudes are plotted as a function of test voltage determined with non-stationary noise analysis from on-cell membrane patches. Error bars denote S.E. values (n = 4–7). The straight lines are linear fits to estimate the single-channel conductance.
FIGURE 3.
FIGURE 3.
Kcnh1-specific characteristics of channel activation and inhibition. A, shown is dependence of channel activation on prepulse potential and Mg2+ ions. Current traces elicited by depolarizing 300-ms steps to 20 mV from holding potentials as indicated in the corresponding pulse protocol (upper panel) were measured in the absence (black curves) and presence (gray curves) of external 5 mm Mg2+ ions. Measurements were performed using two-electrode voltage clamp. B, channel inhibition by Ca2+/CaM is shown. Superimposition of current traces before (black) and 100 s after (gray) internal application of 100 nm CaM + 1 μm Ca2+ was measured from inside-out oocyte patches. Normalized residual currents in Ca2+/CaM were 12.6 ± 4.3, 18.9 ± 7.1, and 8.8 ± 5.7% for KCNH1 (n = 4), Kcnh1a (n = 5), and Kcnh1b (n = 5), respectively. C, Kcnh1 channels can form heteromers. mRNA encoding dominant-negative (dn) mutants of Kcnh1a (G438C), Kcnh1b (G438C), or human KCNH1 (G440C) were co-injected at 1:1 ratio with wild-type mRNA of Kcnh1a or Kcnh1b, respectively. Using two-electrode voltage clamp, K+ currents were elicited by stepwise depolarization (as in Fig. 2A), and the maximal conductances (Gmax) were determined. The bars show the mean ± S.E. from three independent experiments (n = 7–15). All values are normalized to Gmax measured after injection of wild-type channel mRNA alone. Student's t tests are indicated as * (<0.05), ** (<0.01), and *** (<0.001).
FIGURE 4.
FIGURE 4.
Expression of kcnh1a and kcnh1b during early development and in the adult zebrafish. A, temporal mRNA expression patterns of kcnh1a and kcnh1b in zebrafish embryos at the specified stages (in hours post fertilization, hpf) were analyzed by RT-PCR. One sample without reverse transcriptase (−rt) was used as a negative control. bactin was used as a housekeeping gene. Arrowheads indicate the expected amplicon sizes. B, shown is the expression pattern of kcnh1a/b in adult zebrafish tissues. mRNA was isolated from the specified organs, and analysis was performed as in A. C–F, dorsal and lateral views, anterior to the left, of zebrafish embryos at 19 hpf (C) and 24 hpf (D–F) were stained by whole-mount in situ hybridization. Arrowheads point to specific expression domains. C, upper panels show whole-mount staining for kcnh1a (left) and kcnh1b (right); the lower panels show enlarged posterior sections after kcnh1b staining (right) versus control staining with a kcnh1b sense probe (left). D, the two left panels (lateral and dorsal view) show an expression domain for kcnh1a (arrowheads) that was absent in kcnh1b staining. For comparison, the right-hand images show equivalent staining with an atp1a3b-specific probe that was previously shown to mark the epiphysis (30). E, image details show kcnh1a expression domains (arrowheads) in anterior (left, dorsal) and central to posterior parts (right, dorsolateral) of the embryo. F, dorsal view images in two focal planes show kcnh1b expression domains (arrowheads) in anterior (left) and central to posterior regions (right) of the embryo.
FIGURE 5.
FIGURE 5.
Phenotype of kcnh1a and kcnh1b zebrafish morphants. A, shown are survival rates of morphants at 24 h post-injection of the indicated MO concentrations. For both kcnh1a and kcnh1b, three different gene-specific MOs, affecting either splicing (spl1, spl2) or translation (ATG), were used to knock down gene function. A panATG MO was directed against both kcnh1 paralogs. Uninjected embryos and embryos injected with MOs targeting p53 or kcnh2 genes served as controls. Results are based on four independent injections (mean ± S.E., n = 20–50). B, shown are two representative phenotypes of kcnh1a morphants after injection of ATG-interfering MOs (0.5 mm) at the indicated time points. Arrowheads in the upper right image indicate a typical constriction of the marginal enveloping cell layer at 5 hpf. At later stages (11 hpf), a strong phenotype was characterized by progressive cell detachment at the tail region (lower right panel, arrowhead), and subsequent necrosis (asterisk). C, shown is a phenotype of kcnh1 morphants at 48 hpf in comparison to uninjected controls and p53 or kcnh2 morphants. All injections were performed with ATG-MO at 0.5 mm. Note the general growth retardation of kcnh1 morphants and frequent characteristics, such as kinked tails (arrowhead 1), yolk-sac extension defects (2), tail edemas (3), hydrocephaly (4), and poorly developed eyes (5). The bottom image shows a kcnh2 morphant with typical heart edema (arrowhead 6).
FIGURE 6.
FIGURE 6.
Developmental delay of kcnh1 morphants affects hindbrain formation and somitogenesis. A, shown are representative whole-mount in situ hybridizations of zebrafish embryos with digoxigenin-labeled riboprobes for markers of hindbrain (krox20) and somites (myoD). Uninjected embryos (control) are compared with the indicated morphants. In lateral images (upper row), the dark-stained hindbrain rhombomeres 3 and 5 (krox20) and an extended stretch of myoD-stained somites are visible in the upper left and right region of the images, respectively. In the bottom row of the dorsal images the embryos are rotated to the left (anterior) by about 70 degrees. Note that in kcnh1a and kcnh1b morphants the rhombomeres 3 and 5 (white arrows) are thinner and that midline fusion of rhombomere 5 is incomplete. The lateral expansion and segmentation of somitic and presomitic mesoderm (black arrows) is reduced in both kcnh1 morphants. The percentage of embryos showing the given phenotype in two independent experiments is indicated in the upper images. B, early gene expression is modulated by kcnh1. Expression of the indicated genes in zebrafish morphants was analyzed by quantitative RT-PCR at 70% epiboly stage (7.5 hpf). Gene-specific quantitative PCR signals in uninjected controls as well as in kcnh1a, kcnh1b, and pan-kcnh1 morphants were normalized to p53-MO-injected controls, and ef1a served as the housekeeping gene for all samples. Genes are ordered according to the effect of pan-kcnh1-MO injection. Data are the mean ± S.D. from two independent experiments with each three reactions.

References

    1. Kaplan W. D., Trout W. E. (1969) The behavior of four neurological mutants of Drosophila. Genetics 61, 399–409 - PMC - PubMed
    1. Ganetzky B., Wu C. F. (1983) Neurogenetic analysis of potassium currents in Drosophila. Synergistic effects on neuromuscular transmission in double mutants. J. Neurogenet. 1, 17–28 - PubMed
    1. Ludwig J., Weseloh R., Karschin C., Liu Q., Netzer R., Engeland B., Stansfeld C., Pongs O. (2000) Cloning and functional expression of rat eag2, a new member of the ether-à-go-go family of potassium channels and comparison of its distribution with that of eag1. Mol. Cell. Neurosci. 16, 59–70 - PubMed
    1. Martin S., Lino de Oliveira C., Mello de Queiroz F., Pardo L. A., Stühmer W., Del Bel E. (2008) Eag1 potassium channel immunohistochemistry in the CNS of adult rat and selected regions of human brain. Neuroscience 155, 833–844 - PubMed
    1. Saganich M. J., Machado E., Rudy B. (2001) Differential expression of genes encoding subthreshold-operating voltage-gated K+ channels in brain. J. Neurosci. 21, 4609–4624 - PMC - PubMed

Publication types

MeSH terms

Substances