. 2012 Oct 26;287(44):37495-507.
doi: 10.1074/jbc.M112.403600. Epub 2012 Aug 27.

Spectroscopic and kinetic investigation of the fully reduced and mixed valence states of ba3-cytochrome c oxidase from Thermus thermophilus: a Fourier transform infrared (FTIR) and time-resolved step-scan FTIR study

Affiliations

Spectroscopic and kinetic investigation of the fully reduced and mixed valence states of ba3-cytochrome c oxidase from Thermus thermophilus: a Fourier transform infrared (FTIR) and time-resolved step-scan FTIR study

Constantinos Koutsoupakis et al. J Biol Chem. .

Abstract

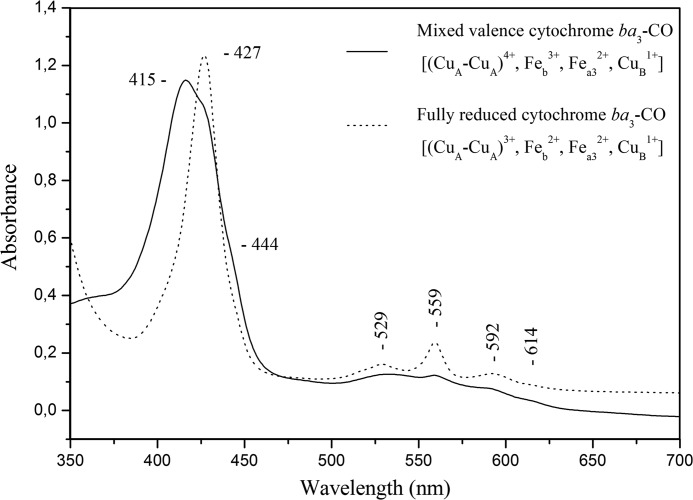
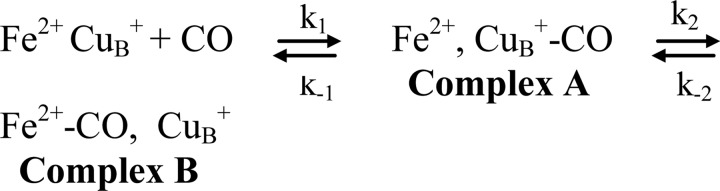
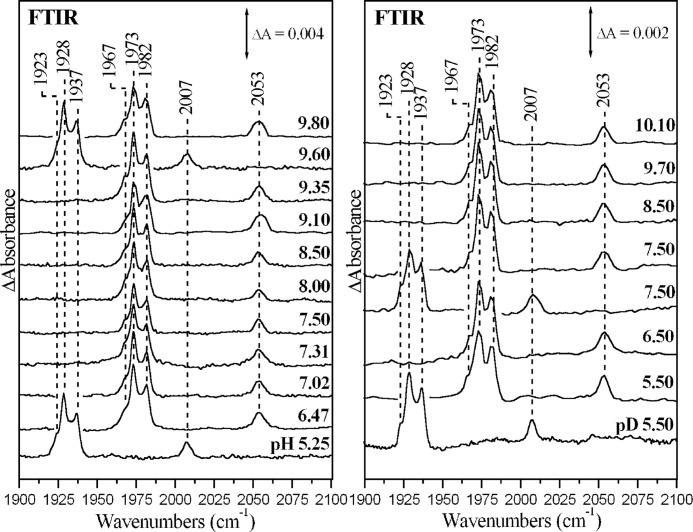
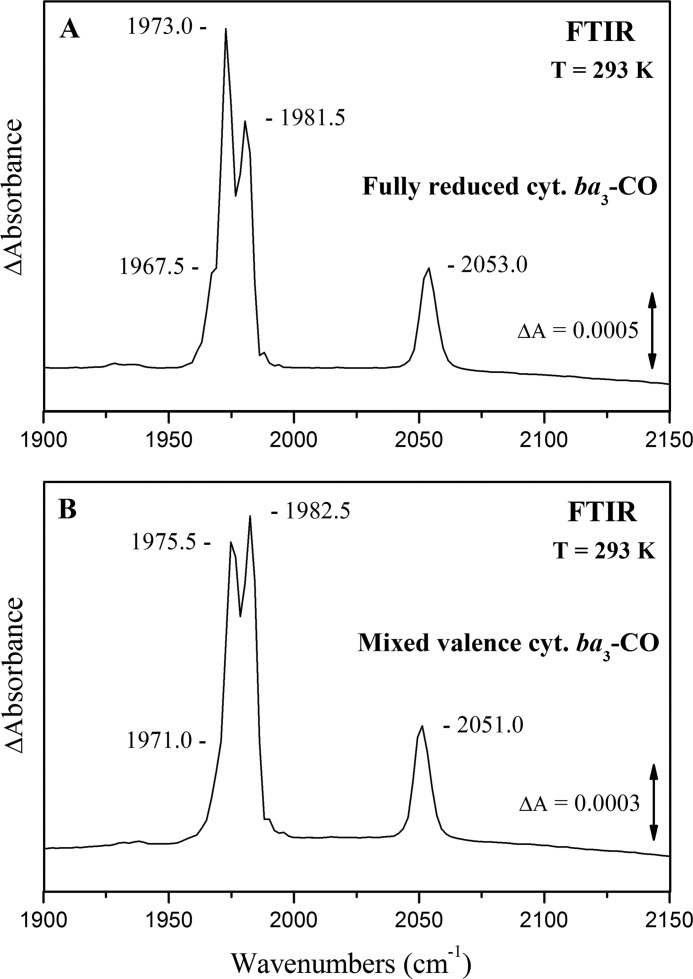
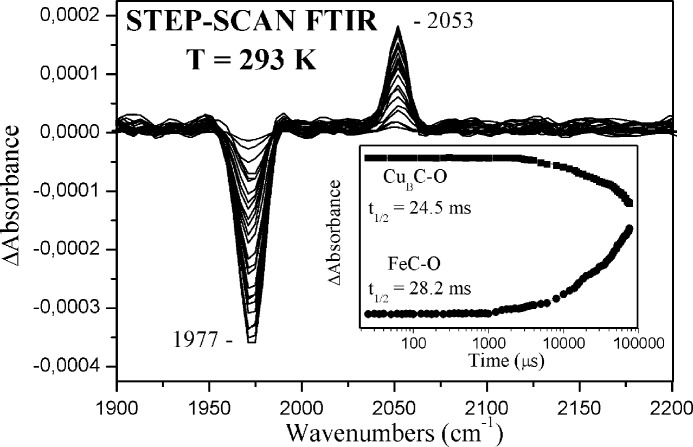
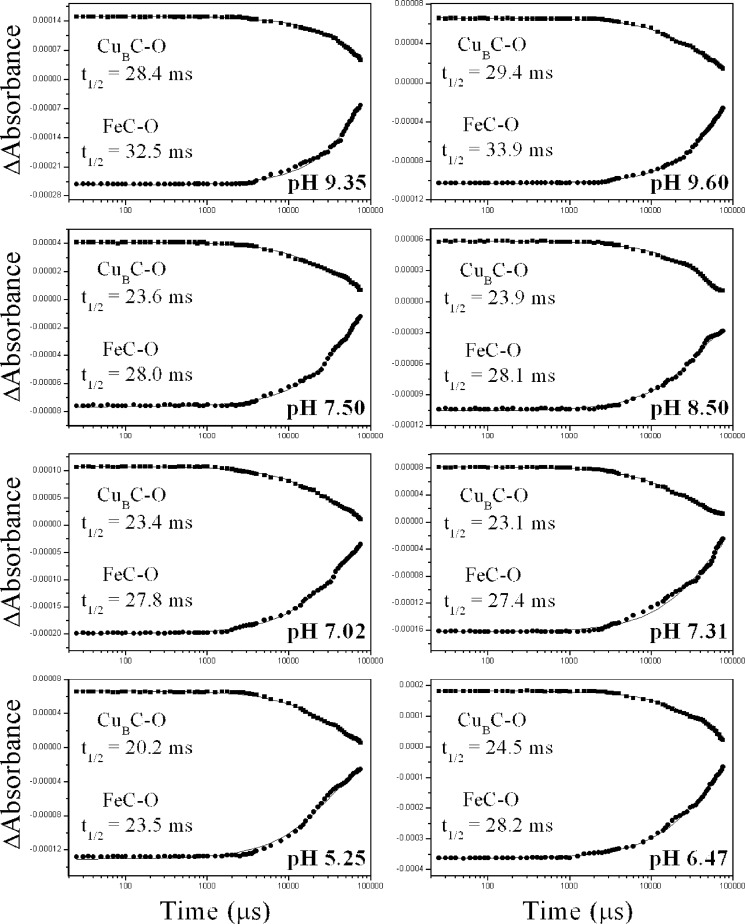
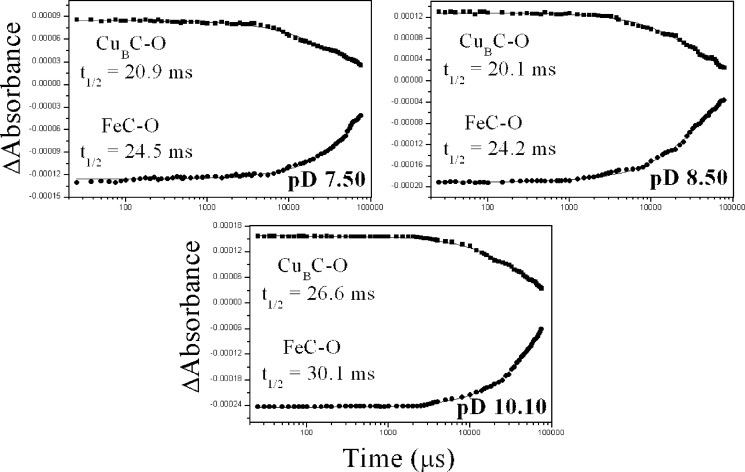
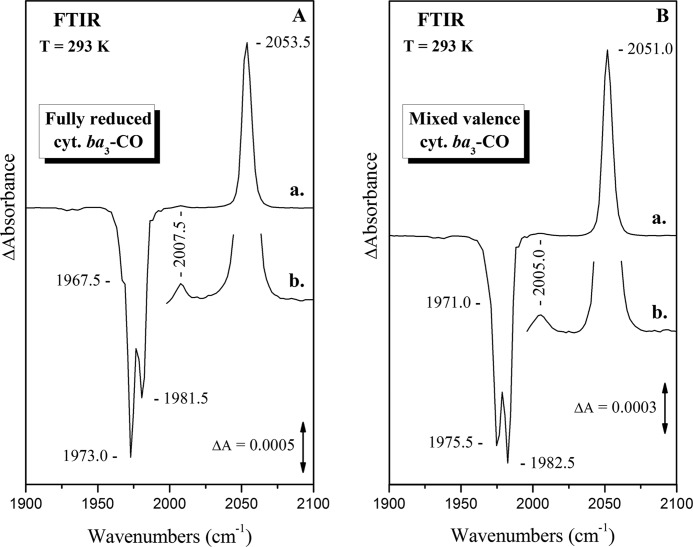
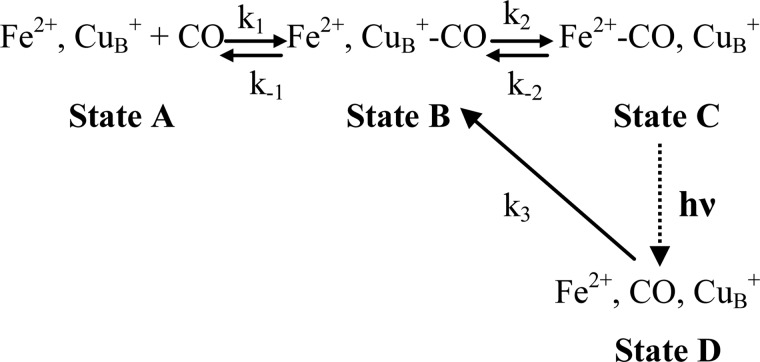
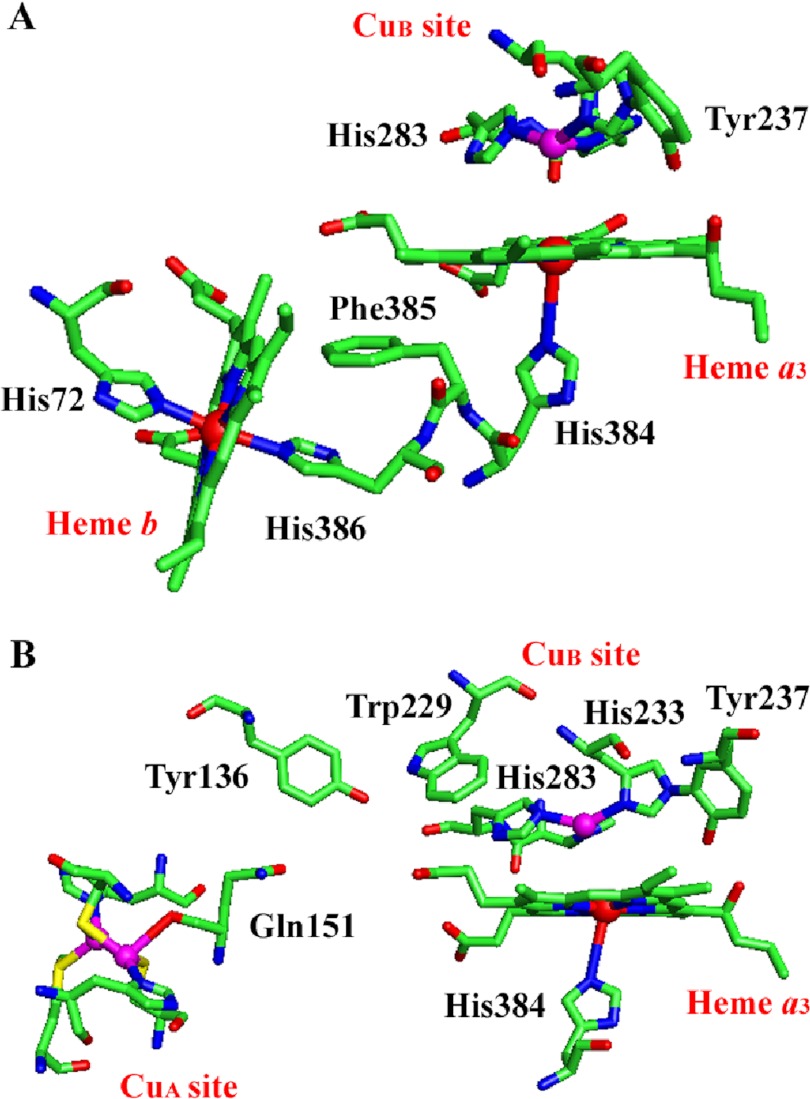
The complete understanding of a molecular mechanism of action requires the thermodynamic and kinetic characterization of different states and intermediates. Cytochrome c oxidase reduces O(2) to H(2)O, a reaction coupled to proton translocation across the membrane. Therefore, it is necessary to undertake a thorough characterization of the reduced form of the enzyme and the determination of the electron transfer processes and pathways between the redox-active centers. In this study Fourier transform infrared (FTIR) and time-resolved step-scan FTIR spectroscopy have been applied to study the fully reduced and mixed valence states of cytochrome ba(3) from Thermus thermophilus. We used as probe carbon monoxide (CO) to characterize both thermodynamically and kinetically the cytochrome ba(3)-CO complex in the 5.25-10.10 pH/pD range and to study the reverse intramolecular electron transfer initiated by the photolysis of CO in the two-electron reduced form. The time-resolved step-scan FTIR data revealed no pH/pD dependence in both the decay of the transient Cu(B)(1+)-CO complex and rebinding to heme a(3) rates, suggesting that no structural change takes place in the vicinity of the binuclear center. Surprisingly, photodissociation of CO from the mixed valence form of the enzyme does not lead to reverse electron transfer from the reduced heme a(3) to the oxidized low-spin heme b, as observed in all the other aa(3) and bo(3) oxidases previously examined. The heme b-heme a(3) electron transfer is guaranteed, and therefore, there is no need for structural rearrangements and complex synchronized cooperativities. Comparison among the available structures of ba(3)- and aa(3)-cytochrome c oxidases identifies possible active pathways involved in the electron transfer processes and key structural elements that contribute to the different behavior observed in cytochrome ba(3).


Figures

FIGURE 1.
FIGURE 1.
Optical absorption spectra of cytochrome ba3-CO complex at pH 8.5. The solid line represents the MV form [(CuA-CuA)3+, Feb3+, Fea32+, CuB1+], and the dotted line represents the FR form [(CuA-CuA)2+, Feb2+, Fea32+, CuB1+)] of the ba3-CO complex.
SCHEME 2
SCHEME 2
FIGURE 2.
FIGURE 2.
Absolute FTIR spectra of cytochrome ba3-CO. Shown are FTIR spectra of the fully reduced cytochrome ba3-CO complex at indicated pH and pD values. The spectra at pH 5.25 and 9.60 and pD 5.50 and 7.50 represent the ba3-13CO complex. Enzyme concentration was 1.0 mm, the path length was 15–25 μm, and the spectral resolution was 2–4 cm−1. The total number of scans was 1000.
FIGURE 3.
FIGURE 3.
Absolute FTIR spectra of cytochrome ba3-CO. A, shown is a FTIR spectrum of the fully reduced [(CuA-CuA)2+, Feb2+, Fea32+, CuB1+] cytochrome ba3-CO complex at pD 8.5. B, shown is a FTIR spectrum of the mixed valence [(CuA-CuA)3+, Feb3+, Fea32+, CuB1+] cytochrome ba3-CO complex at pD 8.5. Enzyme concentration was 1.5 mm, the path length was 56 μm, and the spectral resolution was 4 cm−1. The total number of scans was 2000.
FIGURE 4.
FIGURE 4.
Time-resolved step-scan FTIR spectra of photodissociated cytochrome ba3-CO. Shown are step-scan time-resolved FTIR difference spectra of the CO-bound form of fully reduced cytochrome ba3 (pH 6.50) at 0.15, 0.5, 1, 2, 3, 4, 5, 6, 7, 8, 9, 10, 15, 20, 21, 22, 23, 25, 30, 35, 40, 45, 50, 55, 60, 64, 70, and 78.5 ms subsequent to CO photolysis. The spectral resolution was 8 cm−1, and the time resolution was 100 μs. A 532-nm, 10-mJ/pulse pump beam was used for photolysis.
FIGURE 5.
FIGURE 5.
Kinetic analysis of the heme a32+-CO and CuB1+-CO modes at indicated pH values. Shown is a plot of the 2053 cm−1 (squares) and 1977 cm−1 (circles) modes versus time subsequent to CO photolysis. ΔA was measured from the bands area at times between 0 and 78.5 ms subsequent to CO photolysis from heme a3. The curves are three-parameter exponential fits to the experimental data according to first-order kinetics.
FIGURE 6.
FIGURE 6.
Kinetic analysis of the heme a32+-CO and CuB1+-CO modes at indicated pD values. Shown is a Plot of the 2053 cm−1 (squares) and 1977 cm−1 (circles) modes versus time subsequent to CO photolysis. ΔA was measured from the band areas at times between 0 and 78.5 ms subsequent to CO photolysis from heme a3. The curves are three-parameter exponential fits to the experimental data according to first-order kinetics.
FIGURE 7.
FIGURE 7.
Difference FTIR spectra of photodissociated cytochrome ba3-CO. A, shown is a light-minus-dark difference FTIR spectrum of the CO-bound form of fully reduced cytochrome ba3 oxidase at pD 8.5 (a) and the same spectrum expanded by a factor of 10 in the 2000–2100 cm−1 spectral region (b). The peak at 2007.5 cm−1 corresponds to the 1.1% CuB-13CO complex. B, shown is a light-minus-dark difference FTIR spectrum of the CO-bound form of mixed valence cytochrome ba3 oxidase at pD 8.5 (a) and the same spectrum expanded by a factor of 10 in the 2000–2100 cm−1 spectral region (b). The peak at 2005.0 cm−1 corresponds to the 1.1% CuB-13CO complex. Enzyme concentration was 1.5 mm, the path length was 56 μm, and the spectral resolution was 4 cm−1. The excitation wavelength was 416 nm, and the incident power 13 milliwatts. The photolysis yield is calculated to be 35%.
SCHEME 3
SCHEME 3
FIGURE 8.
FIGURE 8.
The two proposed electron transfer pathways in cytochrome ba3 oxidase. A, shown is the heme b-heme a3-CuB pathway through His-386, Phe-385, and His-384 residues. The CuA-heme b ET step has been removed for clarity together with the hydroxyethylgeranylgeranyl tail of heme a3. B, shown is the direct CuA-CuB pathway through Gln-151, Tyr-136, Trp-229, and His-283 residues. The CuA, CuB atoms are shown as magenta spheres, and the heme b, heme a3 iron atoms are shown as red spheres respectively. The figure was prepared with PyMOL (PDB accession code 1EHK) (71).

Similar articles

Cited by

References

    1. Marcus R. A., Sutin N. (1985) Electron transfers in chemistry and biology. Biochim. Biophys. Acta 811, 265–322
    1. Page C. C., Moser C. C., Chen X., Dutton P. L. (1999) Natural engineering principles of electron tunneling in biological oxidation-reduction. Nature 402, 47–52 - PubMed
    1. Page C. C., Moser C. C., Dutton P. L. (2003) Mechanism for electron transfer within and between proteins. Curr. Opin. Chem. Biol. 7, 551–556 - PubMed
    1. Moser C. C., Page C. C., Farid R., Dutton P. L. (1995) Biological electron transfer. J. Bioenerg. Biomembr. 27, 263–274 - PubMed
    1. Gray H. B., Winkler J. R. (2005) Long-range electron transfer special feature. Long-range electron transfer. Proc. Natl. Acad. Sci. U.S.A. 102, 3534–3539 - PMC - PubMed

LinkOut - more resources