

Functional roles for synaptic-depression within a model of the fly antennal lobe
- PMID: 22927802
- PMCID: PMC3426607
- DOI: 10.1371/journal.pcbi.1002622
Functional roles for synaptic-depression within a model of the fly antennal lobe
Abstract
Several experiments indicate that there exists substantial synaptic-depression at the synapses between olfactory receptor neurons (ORNs) and neurons within the drosophila antenna lobe (AL). This synaptic-depression may be partly caused by vesicle-depletion, and partly caused by presynaptic-inhibition due to the activity of inhibitory local neurons within the AL. While it has been proposed that this synaptic-depression contributes to the nonlinear relationship between ORN and projection neuron (PN) firing-rates, the precise functional role of synaptic-depression at the ORN synapses is not yet fully understood. In this paper we propose two hypotheses linking the information-coding properties of the fly AL with the network mechanisms responsible for ORN-->AL synaptic-depression. Our first hypothesis is related to variance coding of ORN firing-rate information--once stimulation to the ORNs is sufficiently high to saturate glomerular responses, further stimulation of the ORNs increases the regularity of PN spiking activity while maintaining PN firing-rates. The second hypothesis proposes a tradeoff between spike-time reliability and coding-capacity governed by the relative contribution of vesicle-depletion and presynaptic-inhibition to ORN-->AL synaptic-depression. Synaptic-depression caused primarily by vesicle-depletion will give rise to a very reliable system, whereas an equivalent amount of synaptic-depression caused primarily by presynaptic-inhibition will give rise to a less reliable system that is more sensitive to small shifts in odor stimulation. These two hypotheses are substantiated by several small analyzable toy models of the fly AL, as well as a more physiologically realistic large-scale computational model of the fly AL involving 5 glomerular channels.
Conflict of interest statement
The author has declared that no competing interests exist.
Figures
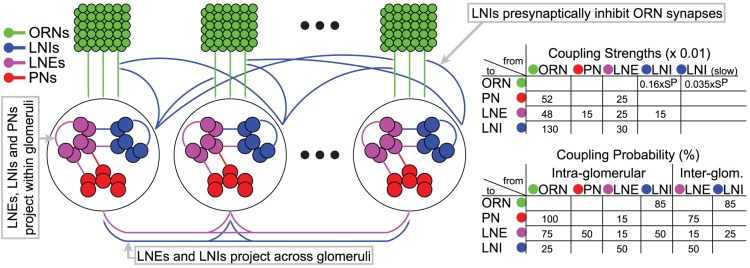
 AL synapses via presynaptic-inhibition. [Right]: The non-negligible connection strengths are listed on top, with the slow-inhibitory connection strengths listed separately from the fast-inhibition strengths. The relevant connection probabilities are listed on the bottom. The parameter
  refers to
  , which characterizes the overall strength of presynaptic-inhibition. See Methods for full details.
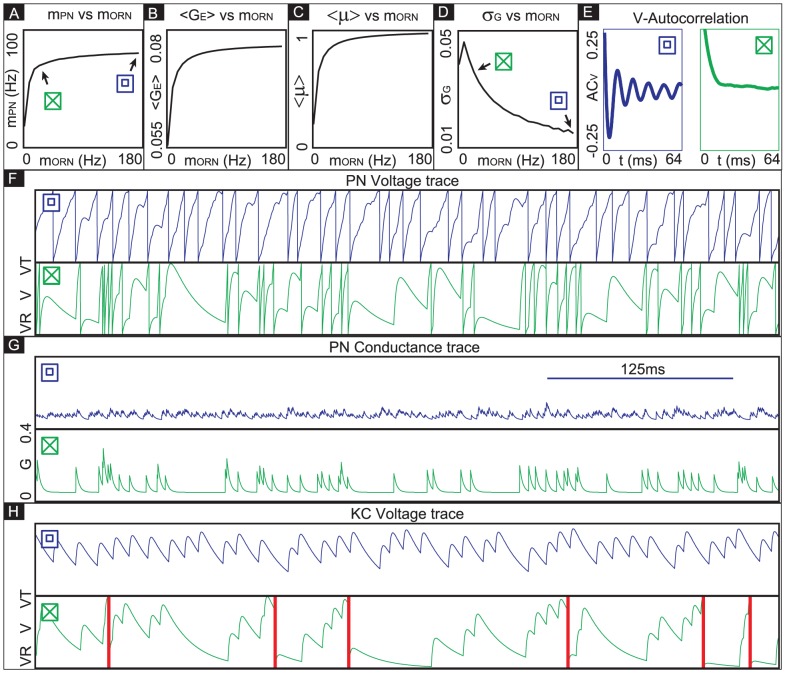
 ’ and ‘
 ’ symbols indicate, respectively, an irregularly firing-regime and a regularly firing-regime. [E] As a result of the fact that the PN conductance has a low variance when the ORN firing-rates are high, the PN activity is very regular when the ORN firing-rate is high. In contrast, the PN activity is less regular when the ORN firing-rate is not as high. This is reflected in the normalized PN autocorrelation, which shows several significant peaks when the variance in the PN conductance is low (‘
 ’-regime, left). In contrast, when the variance in the PN conductance is high the autocorrelation does not show significant peaks (‘
 ’-regime, right). [F] The regularity in the PN spiking activity is seen in PN voltage trace, as shown for the ‘
 ’-regime (top) and ‘
 ’-regime (bottom). [G] The variance in the PN conductance is seen in PN conductance trace, as shown for the ‘
 ’-regime (top) and ‘
 ’-regime (bottom). [H] In this panel we show the voltage-trace of a putative Kenyon cell, a conductance-based integrate-and-fire-neuron, driven by either the PN from the
  -regime (top) or the PN from the
  -regime (bottom). Thick vertical lines indicate firing-events for this putative KC. When driven by the regular activity of the
  -PN, the KC mainains an elevated subthreshold voltage, but does not fire often. On the other hand, when driven by the irregular activity of the
  -PN, the KC does not maintain an elevated subthreshold voltage but fires after each burst in
  -PN-activity. This provides a simple illustration of one possible way in a variance-code could be ‘read-out’ by downstream neurons.
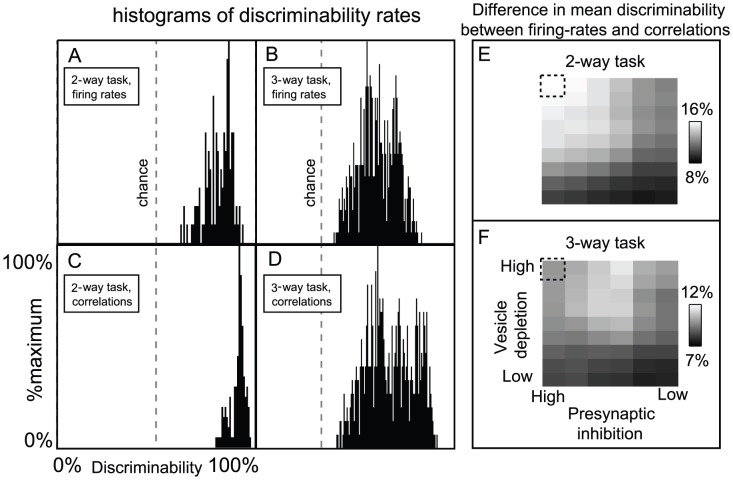
 glomeruli (although to differing degrees). Moreover, we chose every odor within this panel such that the ORN firing-rates of the
  directly stimulated glomeruli were sufficient to saturate the firing-rates of the associated PNs (i.e., the directly stimulated ORN firing-rates were
  12 Hz, see Fig. 10). Given this panel of odors, we presented each odor multiple times, and used the collection of
  -component PN firing-rate vectors (measured over the
  period immediately following odor onset) to perform a variety of odor discrimination tasks (see Results for details). [A] The histogram of discriminability rates associated with
  -way discrimination tasks when only firing-rate data is used. Note that
  is chance level for these tasks (chance level is also shown in panels B,C,D). [B] The histogram of discriminability rates associated with the
  -way discrimination tasks when only firing-rate data is used (note that
  is chance level for these tasks). [C] The histogram of discriminability rates associated with
  -way discrimination tasks when firing-rate data and
  -point correlations (correlation time
  ) are used. [D] The histogram of discriminability rates associated with
  -way discrimination tasks when firing-rate data and
  -point correlations (correlation time
  ) are used. Note that the typical discriminability rate is higher when correlations are used. [E] Here we plot the difference in mean discriminability for the
  -way discrimination task between the cases (i) when firing-rate data and
  -point correlations are used, and (ii) only firing-rate data is used. We plot this difference as a function of the parameters
  and
and  used in our large-scale model. The vesicle-depletion parameter
  ranges from
  to
to  across the vertical axis, and the presynaptic-inhibition parameter
  ranges from
  to
to  across the horizontal axis. The data shown in panels A–D is taken from the simulation indicated by the dashed square. Note that, as the total amount of synaptic-depression decreases, the discriminability computed using only firing-rates is closer to the discriminability computed using both firing-rates and
  -point correlations. [F] Similar to panel-E, except for the
  -way discrimination task, rather than the
  -way discrimination task.
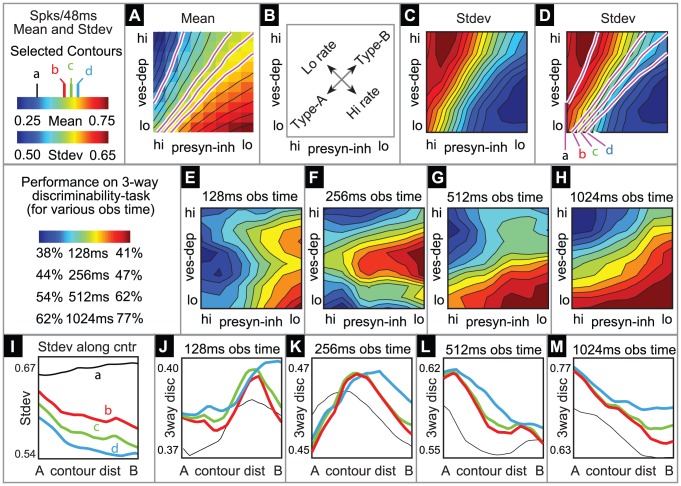
 and
and  (see the section entitled “An illustration of the tradeoff between reliability and sensitivity within a large-scale model” in the main text for details). For each point in this parameter array we measured various features of the network dynamics (such as mean PN spike-counts and reliability), as well as the performance of each of these networks on a
  -way odor discrimination task. [A] Shown is the mean PN spike-count of PNs in the first glomerulus, for each pair of parameter-values
  ,
,  . Overlaid on top of the mean spike-counts are contour lines for the spike-count. Four of these contours are highlighted in magenta, and will be referenced later. [B] Indications of the type-A and type-B network regimes. [C] Shown are the standard deviation in PN spike-counts of PNs in the first glomerulus (see colorbar on far left). [D] Reproduction of panel-C, along with the contours of panel-A. [E–H] Shown are contour plots associated with
  for various values of
  . These panels use the colorbar shown to the far left. [I] Here we plot the standard-deviation in spike-count (taken from panel-D) as a function of the distance along each of the contours indicated in panel-D, with values bi-linearly interpolated as necessary. [J] Here we plot the discriminability values
  indicated in panel-E as a function of the distance along each of the contours shown in panel-D. The contours are indicated using the colorcode from panel-I. [K–M] Similar to panel-J, except for
  ,
,  , and
, and  respectively.
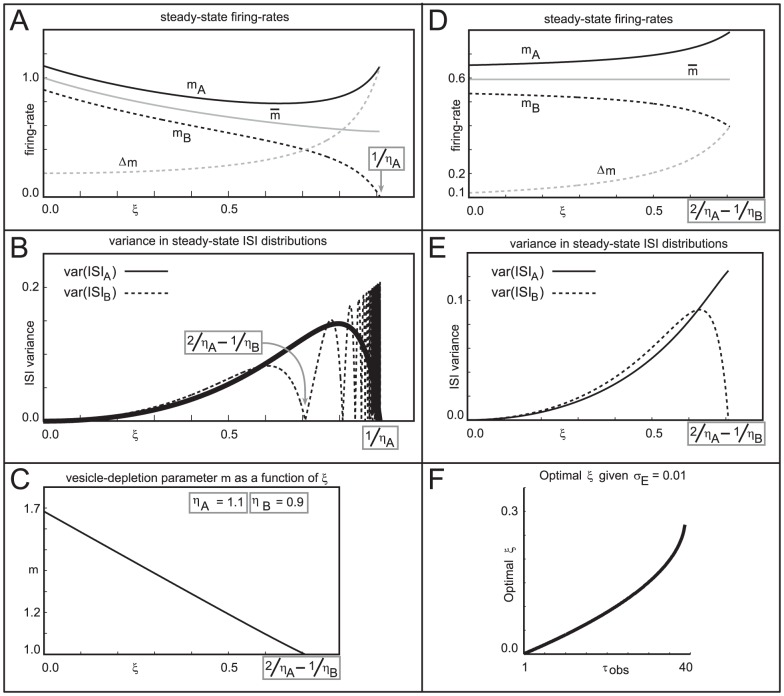
 , and
, and  . In panels A and B the vesicle-depletion parameter
  . In panels C,D,E and F, the vesicle-depletion parameter
  , such that the mean firing rate
  is held constant. [A] Graphs of
  (solid),
  (dashed),
  (gray), and
  (gray dashed), as functions of
  , for the case
  . [B] Graphs of var
 (solid) and var
 (dashed) as functions of
  , for the case
  . [C] Graph of
  as a function of
  , subject to the constraint that
  remain constant. The constant value of
  chosen (essentially arbitrarily) in this case is the value of
  shown in panel A for
  . Other choices of
  yield similar results. Note that this graph is monotonically decreasing, implying the existence of a 1-parameter family of networks possessing the same
  — ranging from type-A networks with low
  and high
  , to type-B networks with high
  and low
  . [D] Graphs of
  (solid),
  (dashed),
  (gray), and
  (gray dashed), for the case
  . [E] Graphs of var
 (solid) and var
 (dashed) as functions of
  , for the case
  . [F] Graph of the optimal choice of
  (implying a vesicle-depletion parameter of
  ) for which discriminability is maximized, as a function of the sample number
  . The notion of discriminability is described in the section entitled “A simple cartoon of optimizing discriminability over short observation-times”. In this case the observation error
  is fixed at
  . Note that for low
  , discriminability is maximized for a type-B network. However, as
  increases, discriminability is maximized by type-A networks. The graph shown plots
  for
for  , as for this particular simple example the derivative of
  reaches a vertical asymptote at
  .
.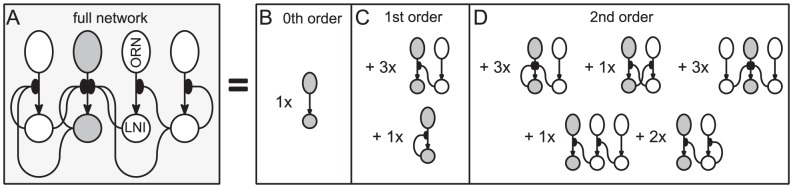
 ORN-LNI pair is fixed (highlighted in dark gray), whereas the indices
  are not fixed, but are considered distinct from
  and from each other. Several dynamic features associated with the
  LNI can be determined by considering an expansion of the dynamics of this full network in terms of subnetworks. Shown on the right in panels-B,C,D are
  -order,
  -order and
  -order subnetworks of the full network which are relevant for determining the sensitivity and reliability of the
  LNI. The
  -order subnetwork consists of the
  ORN-LNI pair alone. The two
  -order subnetworks shown are those incorporating a single presynaptic-inhibitory connection — namely
  (top) and
  (bottom). The full network has embedded within it three
  -order subnetworks of the form
  , and one
  -order subnetwork of the form
  . The five
  -order subnetworks shown are those incorporating two presynaptic-inhibitory connections. Listed in reading order, these subnetworks are denoted by
  ,
,  ,
,  ,
,  , and
, and  . The full network has embedded within it
  ,
,  ,
,  ,
,  and
and  of these subnetworks, respectively.
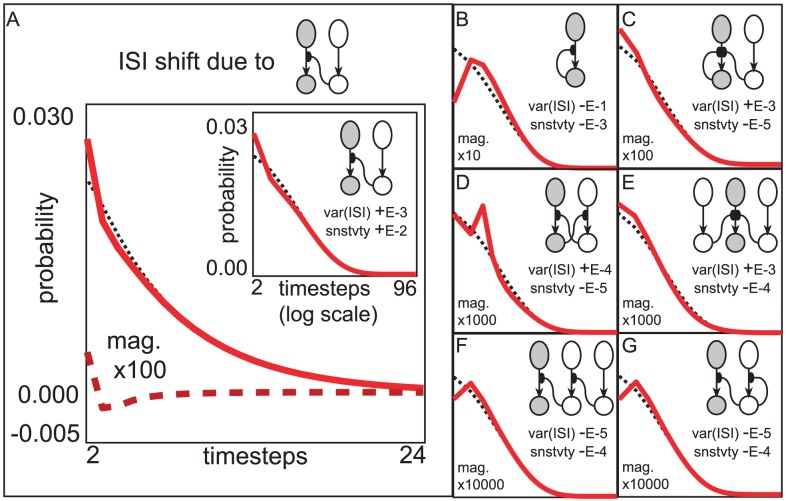
 is constant, and the strength of vesicle-depletion
  . Note however, that we do not assume that the connectivity
  is fixed. We adopt the convention that
  are distinct indices. [A] Here we illustrate the shift in the ISI-distribution of the
  LNI (i.e.,
  ) that would occur (up to
  -order) if the connectivity
  were increased while decreasing
  so as to maintain the firing-rate of the
  LNI (denoted by
  ). The ISI-distribution of the
  LNI when uncoupled from the rest of the network is shown with a dotted-line for reference. The rate at which
  changes with respect to an infinitesimal increase in the coupling strength
  is shown with a dashed-line. This rate is magnified by a factor of
  for visibility. The sum of this rate and the uncoupled
  is shown with a solid-line for a qualitative representation of the new
  that would occur if the connectivity
  were increased by
  . The inset shows this same data (dotted and solid lines) with time plotted on a logarithmic scale for ease of view. For this particular term in the subnetwork-expansion, as
  increases (and the dotted
  shifts to more closely resemble the solid
  ) the var
 increases. The rate at which var
 increases as
  is increased is approximately
  for this system (as indicated by the legend ‘var(ISI)+E-3’). A separate calculation can be performed which shows that the rate at which the sensitivity of the
  LNI (i.e.,
  ) changes as
  is increased is approximately
  (as indicted by the legend ‘snstvty+E-2’). Thus, by strengthening the presynaptic-inhibitory connections from several other LNIs onto the
  ORN-LNI pair (while simultaneously reducing
  so as to maintain
  ), we can readily show that, to
  -order, these shifts collectively increase both var
 and the sensitivity
  . [B–G] In these panels we show similar plots illustrating the influence of various other subnetworks on the reliability of the
  LNI. These plots use axes identical to those shown on the inset in panel-A. Listed in reading order, these subnetworks are denoted by
  ,
,  ,
,  ,
,  ,
,  , and
, and  . Note that the contribution of the autapse
  actually decreases var
 , and the contributions of the
  -edge subnetworks all decrease the sensitivity
  (albeit with magnitudes that are dwarfed by the contribution of the
  -edge subnetwork
  ).
).
 and
and  fixed, one may ask if, for the
  LNI, the reliability of this LNI would decrease if the presynaptic-inhibitory strength
  were to be increased (while simultaneously decreasing
  so as to maintain the firing-rate
  ). Let us denote this condition by ‘hypothesis-2.1’. By analyzing the terms in the
  -order subnetwork-expansion, one can readily conclude that hypothesis-2.1 holds if the
  LNI does not presynaptically-inhibit its own ORN, and there is at least one other LNI which does presynaptically-inhibit the
  ORN. However, if the
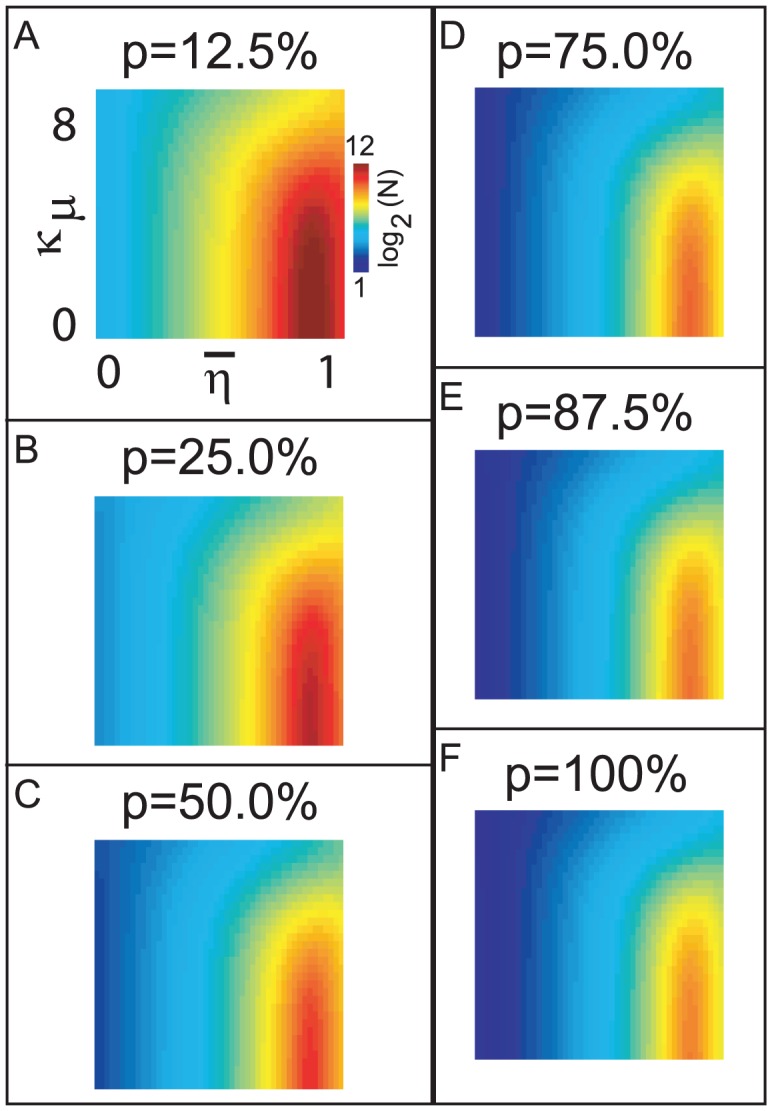
  LNI presynaptically-inhibits its own ORN, then hypothesis-2.1 holds only if the size of the network is sufficiently large. This critical network size
  (above which hypothesis-2.1 holds with high probability) is a function of the background firing-rate of the ORNs
  , the strength of vesicle-depletion
  , and the sparsity-coefficient
  of the random network. In panel-A we plot
  , where we have calculated
  such that, for values of
  , a randomly selected LNI within an E-R random network generated with sparsity-coefficient
  is highly likely (probability
  75%) to obey hypothesis-2.1, given that the LNI in question presynaptically-inhibits its own ORN. Values of
  are displayed according to the colorscale shown on the right. In the remaining panels B–F we plot
  for different values of
  . Note that, unless
  is small and
  is large, it is highly likely that hypothesis-2.1 holds (even for LNIs which presynaptically-inhibit their own ORNs) for all LNIs within an E-R random network of size
  .
.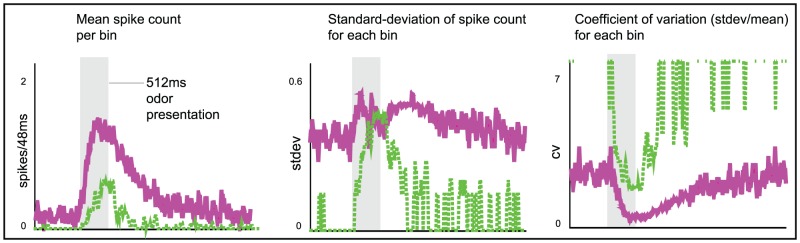
 odor presentation period. Spikes were counted in
  bins. The mean spike-count per
  bin (averaged over
  trials) is shown on the left. The standard-deviation in spike-count per
  bin is shown in the center, and the coefficient of variation (standard deviation
 mean) is shown on the right. Note that, qualitatively similar to experiment , the model PN activates more quickly, has higher firing-rates, and is more reliable than the ORN.
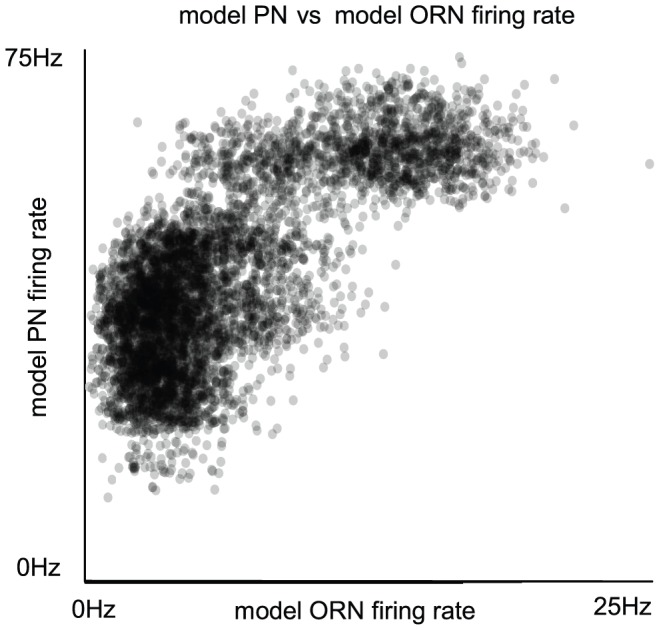
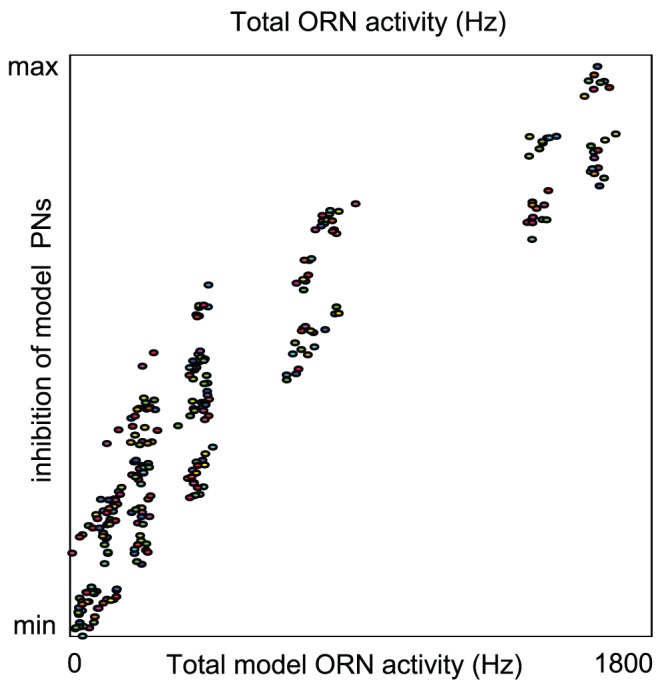
 epoch during which PN firing-rates peak following odor presentation. Note that, qualitatively similar to experiment , the model PN firing-rates saturate for relatively small values of ORN firing-rates.
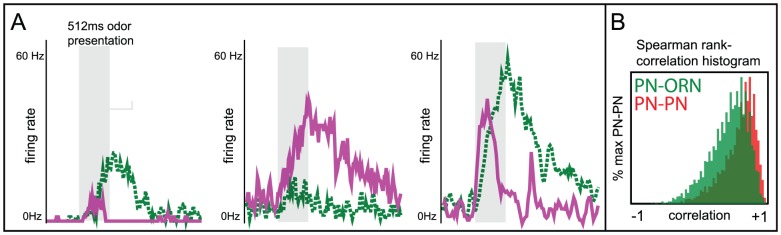
 than the mean of the PN-PN histogram, indicating that, while PNs associated with a given glomerulus tend to respond to the same odors, they do not necessarily respond to the same set of odors which stimulate their associated ORNs.
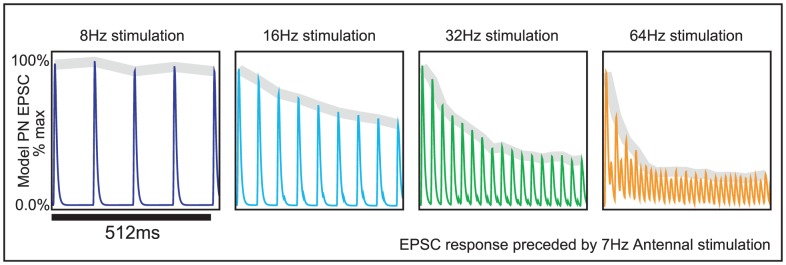
 input current prior to the epoch shown in the figure. At the start of the epoch shown in this figure, the ORN stimulation is increased to
  ,
,  ,
,  , or
, or  . The trial-averaged model PN EPSCs in response these different stimulations are plotted (over a time interval of
  ). Above each EPSC curve, we show the envelope of the response in gray. This envelope is calculated by fitting a piecewise linear function to the maxima of the EPSC response sampled at the rate of stimulation. Note that, similar to experiment, the envelope of the PN EPSC attenuates more quickly when stimulated at
  than when stimulated at
  .
.
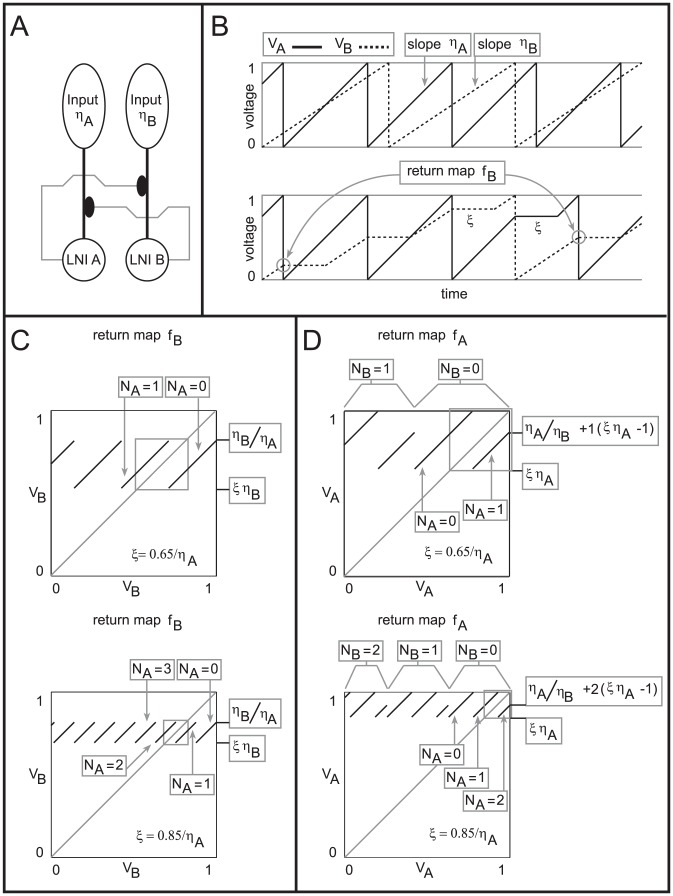
 LNI pairs, each of which presynaptically inhibits the other. [B] Shown on top are sample voltage-traces for the two LNIs (represented by
  and
and  ) for the case
  . Shown on the bottom are sample voltage-traces for the two LNIs in the case that
  is nonzero. Note that after LNI A fires,
  is constant for
  -time. Similarly, after LNI B fires
  is constant for
  -time. A pair of voltages for LNI B are circled. This pair of voltages
  corresponds to a point on the graph of the return map
  , namely
  . For this point on the graph of
  ,
,  , and
, and  . [C] Shown on the top and bottom are return maps
  for the values
  , and
, and  , respectively. [D] Shown on the top and bottom are return maps
  for the values
  , and
, and  , respectively.
References
-
- Axel R (1995) The molecular logic of smell. Sci Am 273: 154–159. - PubMed
-
- Hildebrand J, Shepherd G (1997) Mechanisms of olfactory discrimination: converging evidence for common principles across phyla. Annu Rev Neurosci 20: 595–631. - PubMed
-
- Vosshall L, Wong A, Axel R (2000) An olfactory sensory map in the fly brain. Cell 102: 147–159. - PubMed
-
- Gao Q, Yuan Y, Chess A (2000) Convergent projections of Drosophila olfactory neurons to specific glomeruli in the antennal lobe. Nat Neurosci 8: 780–785. - PubMed
Publication types
MeSH terms
LinkOut - more resources
Full Text Sources
Molecular Biology Databases
