

A quantitative comparison of the similarity between genes and geography in worldwide human populations
- PMID: 22927824
- PMCID: PMC3426559
- DOI: 10.1371/journal.pgen.1002886
A quantitative comparison of the similarity between genes and geography in worldwide human populations
Abstract
Multivariate statistical techniques such as principal components analysis (PCA) and multidimensional scaling (MDS) have been widely used to summarize the structure of human genetic variation, often in easily visualized two-dimensional maps. Many recent studies have reported similarity between geographic maps of population locations and MDS or PCA maps of genetic variation inferred from single-nucleotide polymorphisms (SNPs). However, this similarity has been evident primarily in a qualitative sense; and, because different multivariate techniques and marker sets have been used in different studies, it has not been possible to formally compare genetic variation datasets in terms of their levels of similarity with geography. In this study, using genome-wide SNP data from 128 populations worldwide, we perform a systematic analysis to quantitatively evaluate the similarity of genes and geography in different geographic regions. For each of a series of regions, we apply a Procrustes analysis approach to find an optimal transformation that maximizes the similarity between PCA maps of genetic variation and geographic maps of population locations. We consider examples in Europe, Sub-Saharan Africa, Asia, East Asia, and Central/South Asia, as well as in a worldwide sample, finding that significant similarity between genes and geography exists in general at different geographic levels. The similarity is highest in our examples for Asia and, once highly distinctive populations have been removed, Sub-Saharan Africa. Our results provide a quantitative assessment of the geographic structure of human genetic variation worldwide, supporting the view that geography plays a strong role in giving rise to human population structure.
Conflict of interest statement
The authors have declared that no competing interests exist.
Figures
 (
( ). The rotation angle of the PCA map is
  .
.
 (
( ). The rotation angle of the PCA map is
  .
.
 (
( ). The rotation angle of the PCA map is
  .
.
 (
( ). The rotation angle of the PCA map is
  .
.
 (
( ). The rotation angle of the PCA map is
  .
.
 (
( ). The rotation angle of the PCA map is
  .
.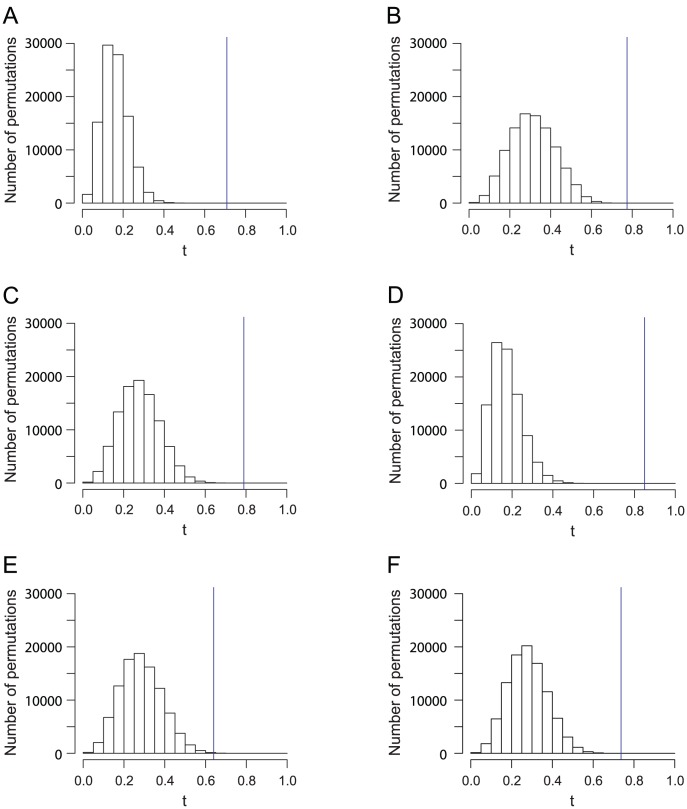
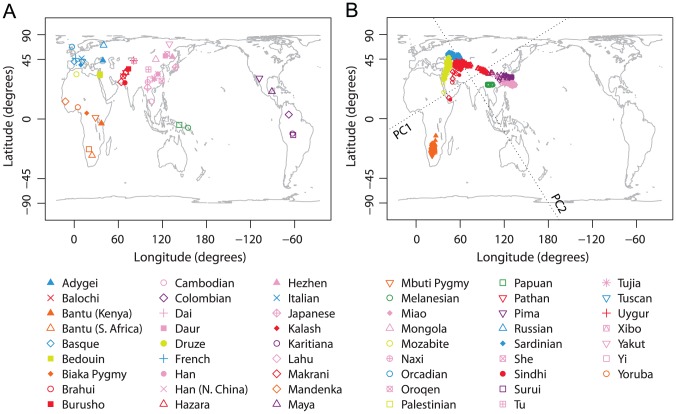
 . (A) The worldwide dataset in Figure 1 (
 ,
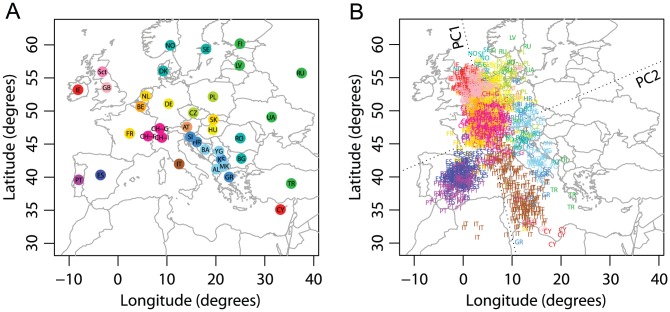
,  ). (B) The European dataset in Figure 2 (
 ,
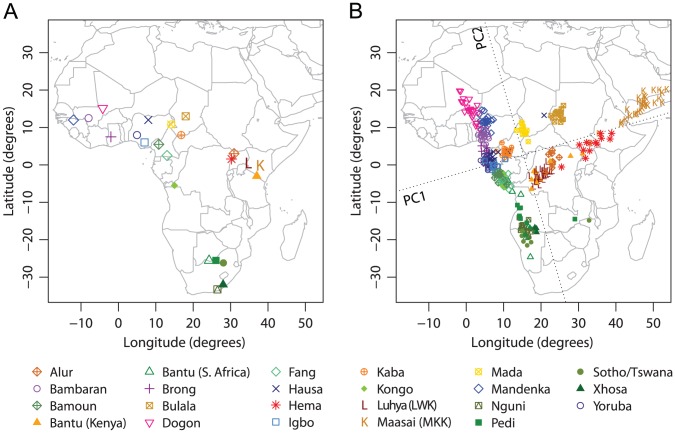
,  ). (C) The Sub-Saharan African dataset in Figure 3 (
 ,
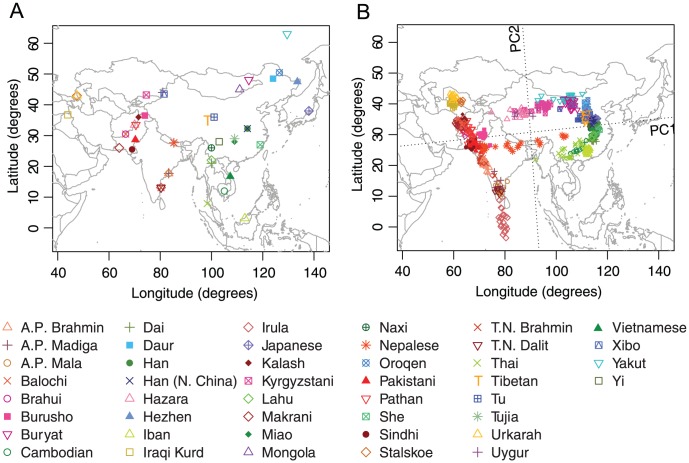
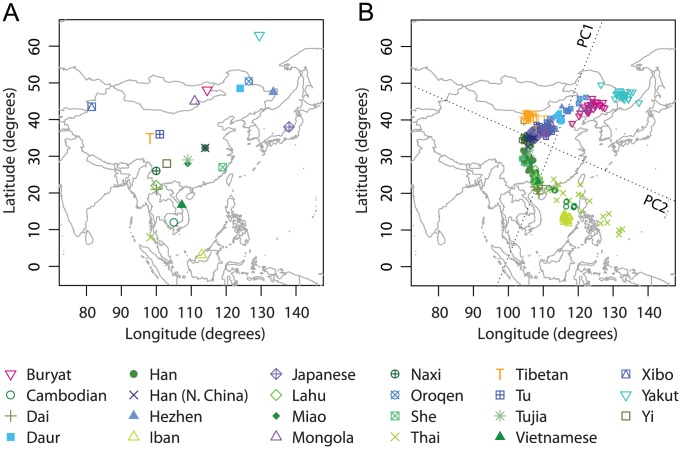
,  ). (D) The Asian dataset in Figure 4 (
 ,
,  ). (E) The East Asian dataset in Figure 5 (
 ,
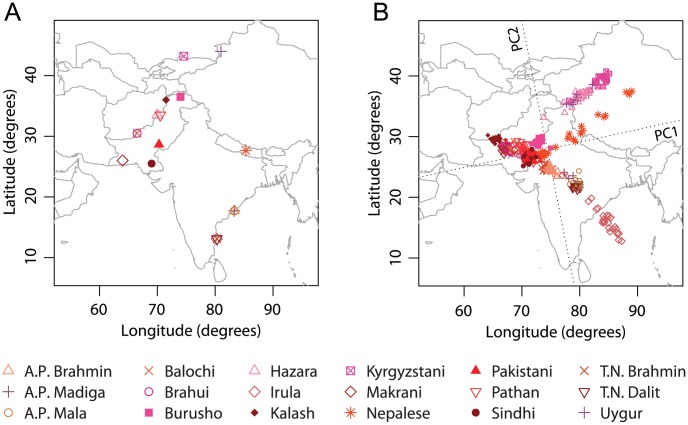
,  ). (F) The Central/South dataset in Figure 6 (
 ,
,  ).
).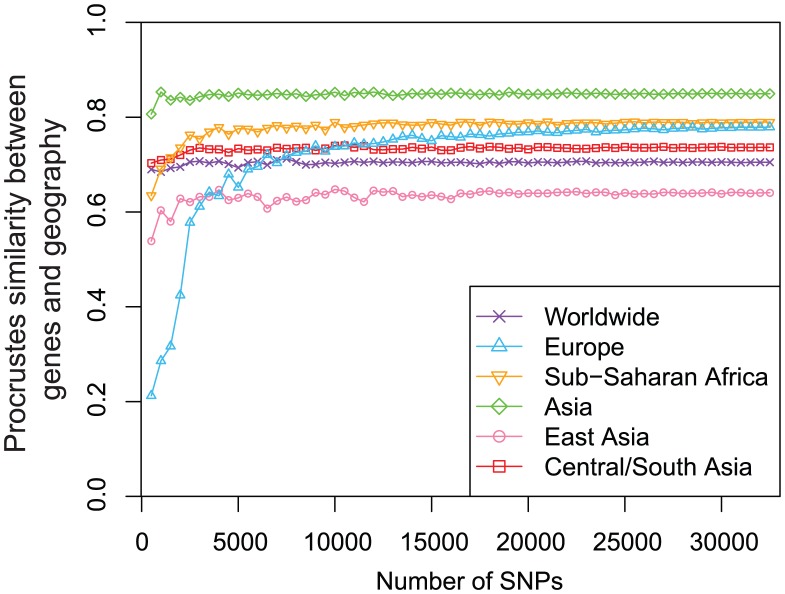
 randomly selected markers were used to generate PCA maps of genetic variation to compare with geographic maps for different regions.
  .
.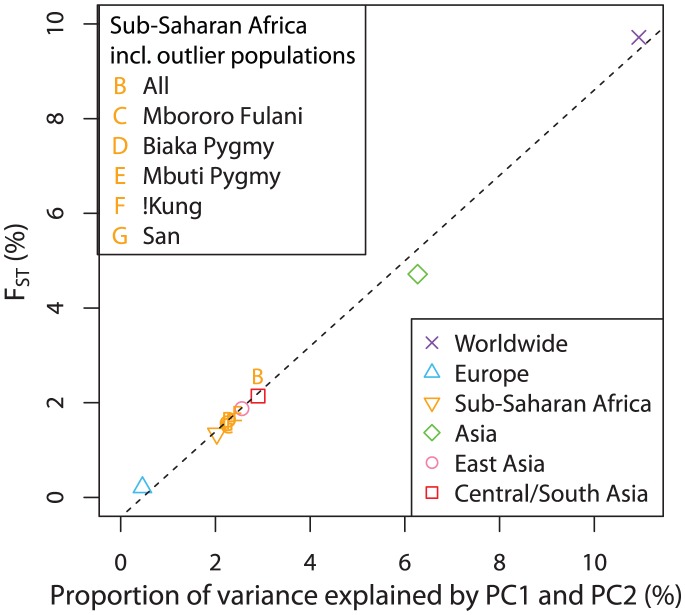
 values were estimated from the same datasets as used in the PCA (column 7 in Table 2, column 11 in Table S7). The dashed line indicates the linear least squares fit of
  . The Pearson correlation is
  .
.References
-
- Sokal RR, Oden NL, Wilson C (1991) Genetic evidence for the spread of agriculture in Europe by demic diffusion. Nature 351: 143–145. - PubMed
-
- Cavalli-Sforza LL, Menozzi P, Piazza A (1994) The History and Geography of Human Genes. Princeton: Princeton University Press.
-
- Barbujani G (2000) Geographic patterns: how to identify them and why. Hum Biol 72: 133–153. - PubMed
-
- Cavalli-Sforza LL, Feldman MW (2003) The application of molecular genetic approaches to the study of human evolution. Nat Genet 33 Suppl:266–275. - PubMed
-
- Novembre J, Ramachandran S (2011) Perspectives on human population structure at the cusp of the sequencing era. Annu Rev Genomics Hum Genet 12: 245–274. - PubMed
Publication types
MeSH terms
Grants and funding
LinkOut - more resources
Full Text Sources
Molecular Biology Databases
Research Materials
Miscellaneous
