Case Reports
. 2012;7(8):e38413.
doi: 10.1371/journal.pone.0038413. Epub 2012 Aug 22.

Preserved self-awareness following extensive bilateral brain damage to the insula, anterior cingulate, and medial prefrontal cortices

Affiliations
Case Reports

Preserved self-awareness following extensive bilateral brain damage to the insula, anterior cingulate, and medial prefrontal cortices

Carissa L Philippi et al. PLoS One. 2012.

Abstract

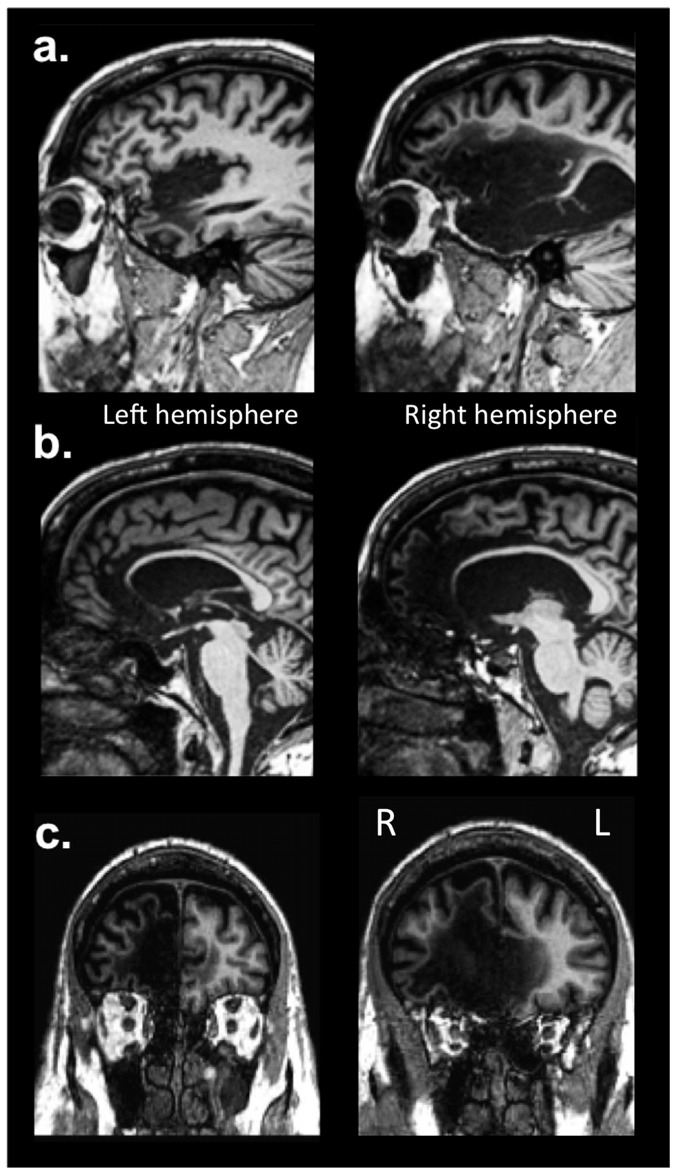
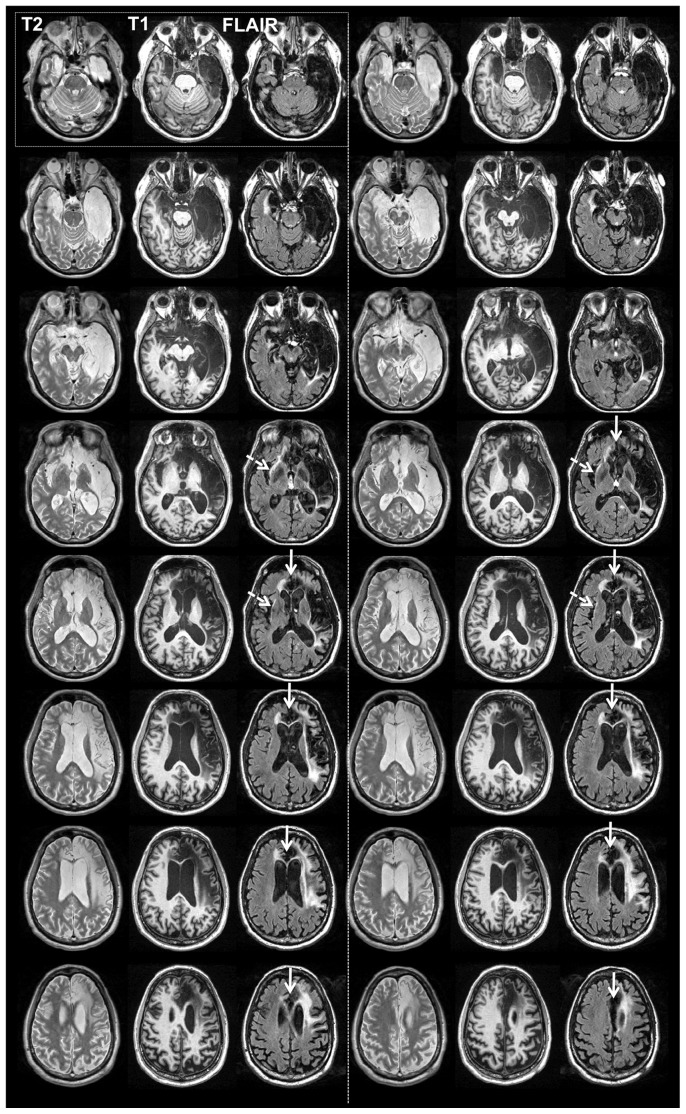
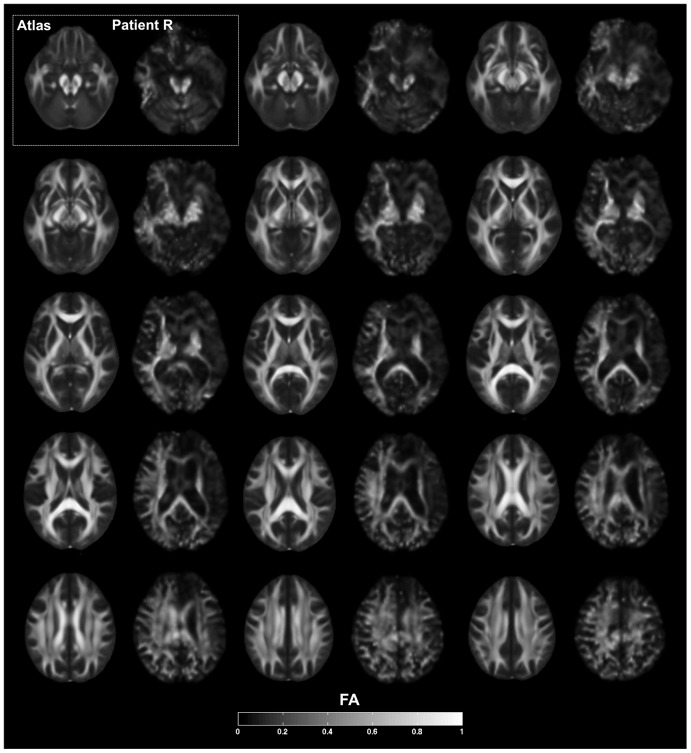
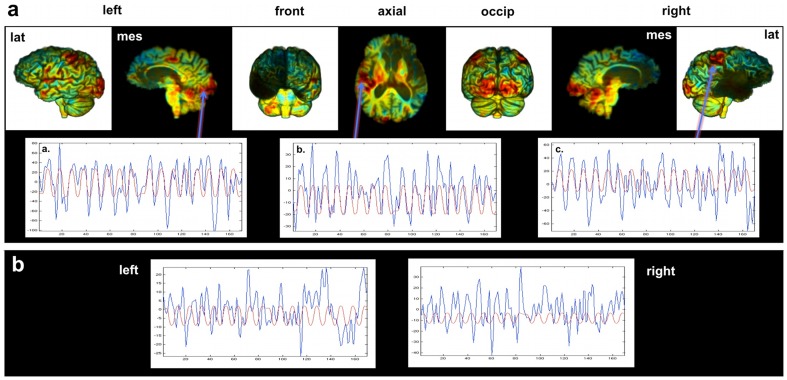
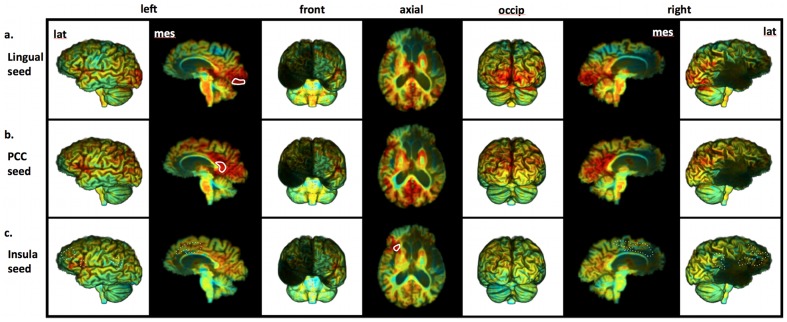
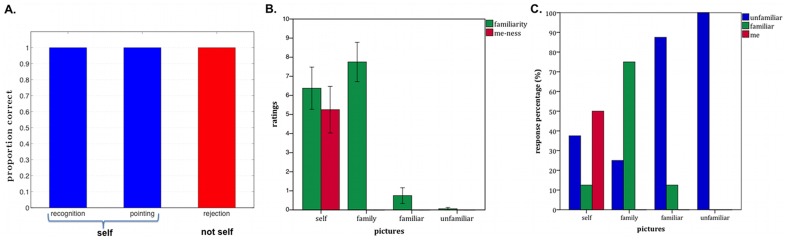
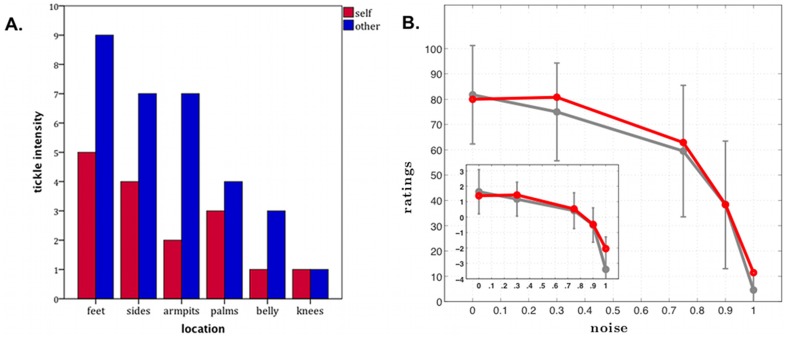
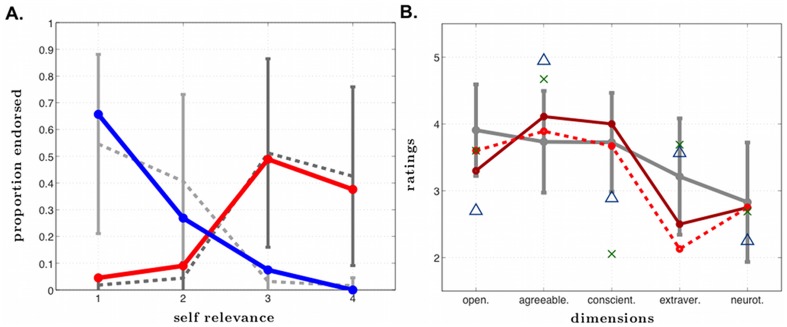
It has been proposed that self-awareness (SA), a multifaceted phenomenon central to human consciousness, depends critically on specific brain regions, namely the insular cortex, the anterior cingulate cortex (ACC), and the medial prefrontal cortex (mPFC). Such a proposal predicts that damage to these regions should disrupt or even abolish SA. We tested this prediction in a rare neurological patient with extensive bilateral brain damage encompassing the insula, ACC, mPFC, and the medial temporal lobes. In spite of severe amnesia, which partially affected his "autobiographical self", the patient's SA remained fundamentally intact. His Core SA, including basic self-recognition and sense of self-agency, was preserved. His Extended SA and Introspective SA were also largely intact, as he has a stable self-concept and intact higher-order metacognitive abilities. The results suggest that the insular cortex, ACC and mPFC are not required for most aspects of SA. Our findings are compatible with the hypothesis that SA is likely to emerge from more distributed interactions among brain networks including those in the brainstem, thalamus, and posteromedial cortices.


Conflict of interest statement

Competing Interests: The authors have declared that no competing interests exist.

Figures

Figure 1
Figure 1. T1-weighted MRI scans of R's lesion.
(a) Sagittal images highlighting damage to the insular cortex, (b) sagittal images highlighting damage to the ACC, and (c) coronal images highlighting damage to the mPFC. All three structures are extensively damaged, bilaterally, in R's brain.
Figure 2
Figure 2. Structural imaging.
Series of axial slices organized in a ventral-to-dorsal direction (ventral-most = top left; dorsal-most = bottom right). Slices are grouped in series of three, corresponding respectively to T2-weighted, T1-weighted and FLAIR imaging sequences of the same slice in the brain. The ventral-most set is in the top-left; next is the top-right; next is the second row-left, next is the second row-right, etc. Slices are sampled every 4 mm. Slices are in neurological convention (left side of image = left hemisphere; right side of image = right hemisphere). Dashed white arrows point to areas of abnormality detected on the FLAIR scan within the region of the left anterior insula. Continuous white arrows point to the mPFC/ACC region, highlighting the extensive bilateral destruction of these regions.
Figure 3
Figure 3. Fractional anisotropy.
Series of axial slices organized in a ventral-to-dorsal direction (ventral-most = top left; dorsal-most = bottom right, as in Figure 2) showing fractional anisotropy (FA) from DTI. Slices are grouped in series of two, corresponding respectively to average values from the FMRIB58 FA atlas and R's brain. Slices are sampled every 4 mm. Slices are in neurological convention, with the left hemisphere on the left. The legend at the bottom of the figure shows the grayscale coding of the degree of FA, ranging from 0 to 1. The results indicate a diffuse and global relative reduction in FA, indicative of extensive white matter pathology and widespread disconnection, especially in the frontal and temporal lobes. There is greater degree of damage in the right hemisphere.
Figure 4
Figure 4. R's BOLD response during the sensorimotor fMRI paradigm.
a. Upper tier – Unthresholded images showing t-values using a color code that goes from blue to red (ranging from −7 to +7 in t-values). Lower tier – R's actual BOLD response (blue) mapped on the same graph as his predicted BOLD response (red) for voxels in: (a) primary visual cortex, (b) left primary auditory cortex, and (c) right primary somatomotor cortex. The observed and predicted time courses are clearly in phase, indicating normal BOLD response in these regions. b. R's actual BOLD response (blue) mapped on the same graph as his predicted BOLD response (red) for voxels in the left and right anterior insula. The observed and predicted time courses are not in phase (the presence of oscillations in similar frequency ranges is driven by the bandpass filter). Thus, signal from both the left and right anterior insula voxels did not correlate with the predicted BOLD response, indicating that signal emanating from these regions during the task is likely noise-related.
Figure 5
Figure 5. R's functional connectivity results.
Unthresholded images showing correlation values using a color code that goes from blue to red (ranging from −0.9 to 0.9). Seed regions used for each analysis are delineated with a solid white line. (a) Results for the left lingual gyrus seed region, showing robust functional connectivity with the rest of early visual cortices in both hemispheres. (b) Results for the left posterior cingulate cortex seed region, showing widespread functional connectivity throughout the posteromedial and lateral parietal cortices, but essentially no signs of connectivity with the mPFC. (c) Results for the left dorsal anterior insula seed region, which failed to show any evidence of functional connectivity with regions (see dashed white lines) that have been previously shown to be functionally connected with the anterior insula .
Figure 6
Figure 6. Self-recognition from pictures.
A. Self-recognition in photographs (not cropped and with context): The proportion of correct self-recognition (Do you see yourself in this photo?) and pointing (If so, could you point to yourself in the photo?) was 100% accurate. There were no false positive ratings; all pictures without R were correctly rejected (red). B. Self-face recognition (cropped pictures without extrafacial features or context): Ratings of “me-ness” (red) and familiarity (green) ranging from 0 (not at all) to 10 (extremely) for pictures of faces of R, family members, familiar persons, and unfamiliar persons. Error bars are standard errors. C. Forced choice classification as “me,” “familiar” or “unfamiliar” for the same conditions as in B. The results in 6B and 6C show that R had some difficulty in recognizing himself in the same set of pictures when they were altered to exclude all extrafacial features. However, he never rated a picture of another person as himself, and he correctly recognized 75% of the faces of his family members.
Figure 7
Figure 7. Self-Agency.
A. Tickle test results. Tickle intensity ratings (y-axis) are plotted as a function of the body part being tickled (x-axis). Tickle condition is color coded: red = self-administered tickle, blue = experimenter-administered tickle. The graph shows normal “feeling of agency” in R, with lower intensity ratings in the self-administered tickle condition as compared to the experimenter-administered tickle condition (the scale goes from 0, “not ticklish at all,” to 10, “extremely ticklish”). B. Self-agency judgment task results. Mean subjective ratings of control over the movement of the blue box (from 0 = “no control” to 100 = “completely in control”), plotted as a function of objective variation in control (i.e., “noise” which is the proportion of time not in control during a trial). The group mean for each noise condition for healthy comparison participants are represented in gray, with error bars corresponding to 2 standard deviations from the mean. R's mean ratings are represented in red. For all participants, including R, the sense of control parametrically decreased as noise (i.e., objectively manipulated lack of control) increased. In all conditions, R's sense of self-agency was entirely within normal limits. Error bars = 2 standard deviations from the mean. Red = R's ratings. Gray = group mean of the healthy comparison participants.
Figure 8
Figure 8. Self-concept.
A. Positivity bias. Proportion of positive (red) and negative (blue) personality traits endorsed as a function of self-relevance ratings (from 1 = “not at all like me” to 4 = “very much like me”). The solid lines represent R's ratings and the dashed lines represent ratings from the comparison participants. Error bars represent one standard deviation. R's self-relevance rating curves are entirely within the normal range compared to other men of his age. B. Big Five Inventory ratings. R baseline: R's personality ratings of himself at initial assessment. R 1 year: R's personality ratings of himself one year later. Healthy male comparisons: average ratings for 796 healthy males in their 50's (error bars represent one standard deviation from the mean) . Blue triangles: ratings of R by his mother. Green X's: ratings of R by his sister. *Note, we acknowledge we are connecting discrete data (not continuous data) with lines in this graph.

References

    1. Northoff G, Heinzel A, de Greck M, Bermpohl F, Dobrowolny H, et al. (2006) Self-referential processing in our brain–a meta-analysis of imaging studies on the self. Neuroimage 31: 440–457. - PubMed
    1. Tulving E (1983) Elements of Episodic Memory. Oxford, U.K.: Clarendon.
    1. Damasio A (1999) The Feeling of What Happens: Body and Emotion in the Making of Consciousness. New York: Harvest Books.
    1. Panksepp J, Northoff G (2009) The trans-species core SELF: The emergence of active cultural and neuro-ecological agents through self-related processing within subcortical-cortical midline networks. Consciousness and Cognition 18: 193–215. - PubMed
    1. Klein SB, Gangi CE (2010) The multiplicity of self: neuropsychological evidence and its implications for the self as a construct in psychological research. Annals of the New York Academy of Sciences 1191: 1–15. - PubMed

Publication types