. 2012;7(8):e43531.
doi: 10.1371/journal.pone.0043531. Epub 2012 Aug 22.

A functional and structural Mongolian Scots pine (Pinus sylvestris var. mongolica) model integrating architecture, biomass and effects of precipitation

Affiliations

A functional and structural Mongolian Scots pine (Pinus sylvestris var. mongolica) model integrating architecture, biomass and effects of precipitation

Feng Wang et al. PLoS One. 2012.

Abstract

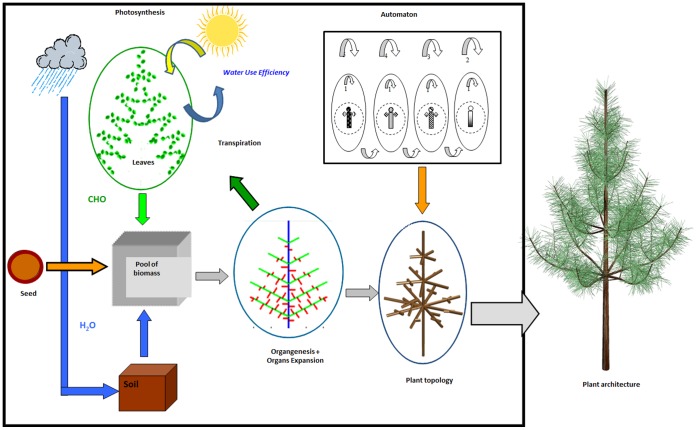
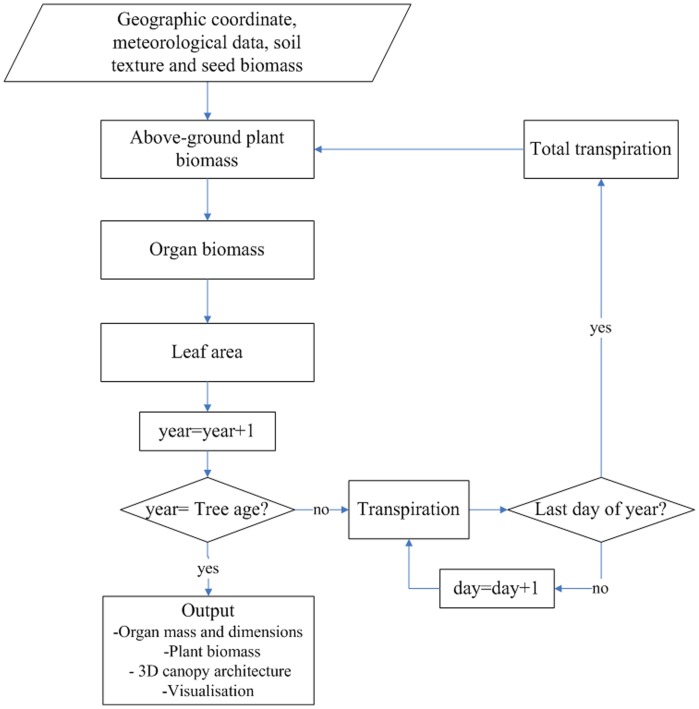
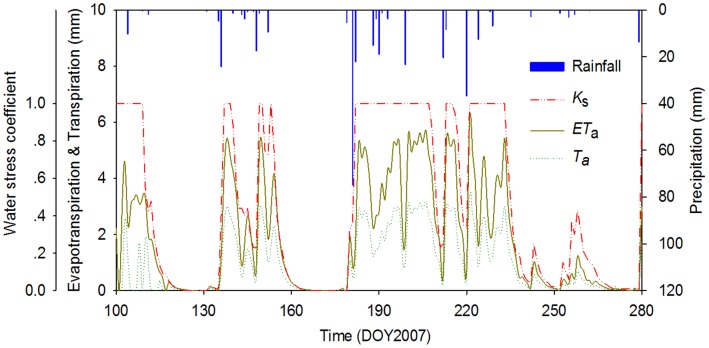
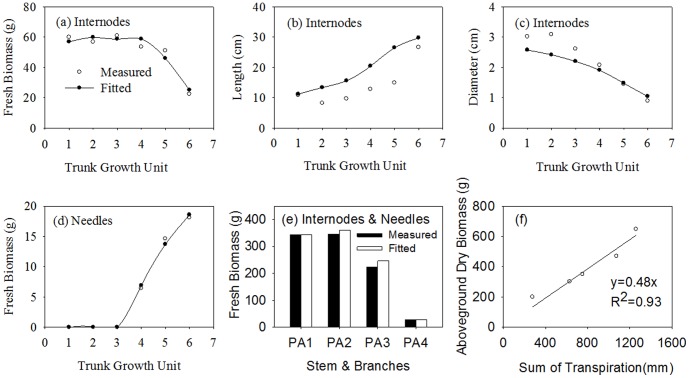
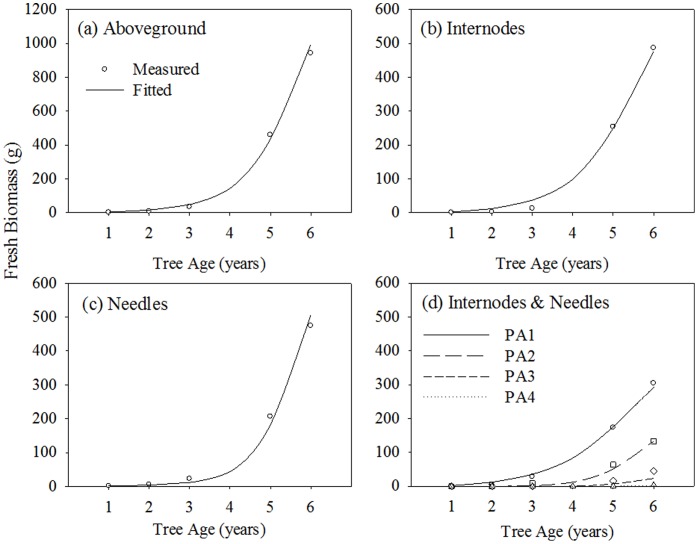
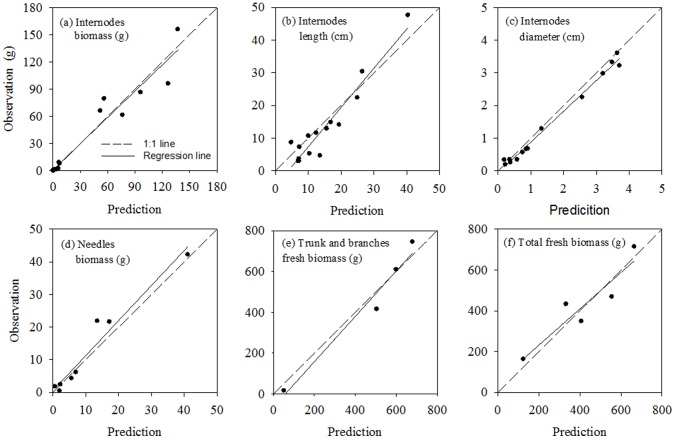
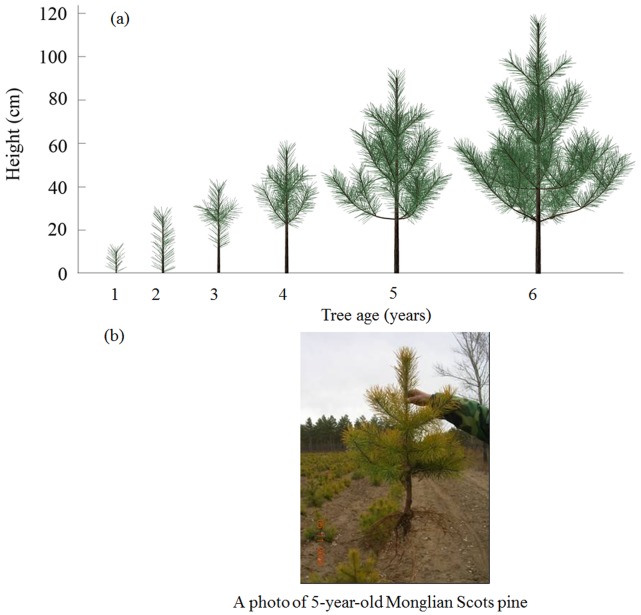
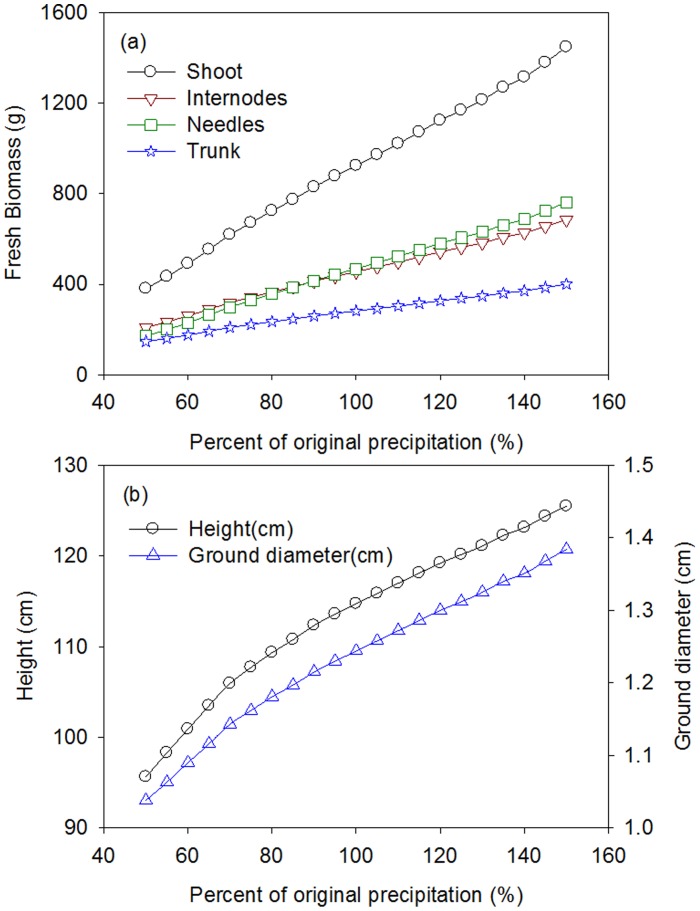
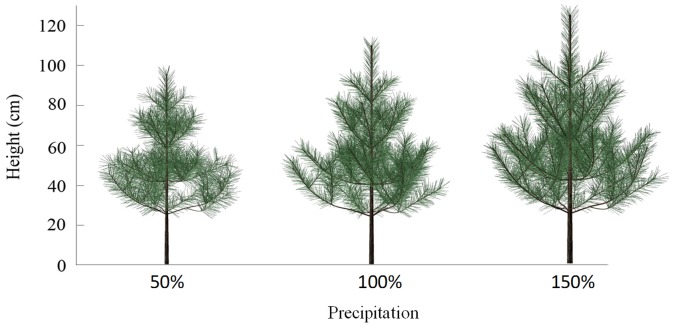
Mongolian Scots pine (Pinus sylvestris var. mongolica) is one of the principal tree species in the network of Three-North Shelterbelt for windbreak and sand stabilisation in China. The functions of shelterbelts are highly correlated with the architecture and eco-physiological processes of individual tree. Thus, model-assisted analysis of canopy architecture and function dynamic in Mongolian Scots pine is of value for better understanding its role and behaviour within shelterbelt ecosystems in these arid and semiarid regions. We present here a single-tree functional and structural model, derived from the GreenLab model, which is adapted for young Mongolian Scots pines by incorporation of plant biomass production, allocation, allometric rules and soil water dynamics. The model is calibrated and validated based on experimental measurements taken on Mongolian Scots pines in 2007 and 2006 under local meteorological conditions. Measurements include plant biomass, topology and geometry, as well as soil attributes and standard meteorological data. After calibration, the model allows reconstruction of three-dimensional (3D) canopy architecture and biomass dynamics for trees from one- to six-year-old at the same site using meteorological data for the six years from 2001 to 2006. Sensitivity analysis indicates that rainfall variation has more influence on biomass increment than on architecture, and the internode and needle compartments and the aboveground biomass respond linearly to increases in precipitation. Sensitivity analysis also shows that the balance between internode and needle growth varies only slightly within the range of precipitations considered here. The model is expected to be used to investigate the growth of Mongolian Scots pines in other regions with different soils and climates.


Conflict of interest statement

Competing Interests: The authors have declared that no competing interests exist.

Figures

Figure 1
Figure 1. Conceptual scheme of the functional-structural tree model coupled with soil water balance for Mongolian Scots pines: the seed gives the initial pool of biomass, which is used to build organs (internodes, leaves) and thus the plant architecture.
The seedlings take up water from soil for leaf transpiration and biomass production during each growth cycle. The biomass produced is a product of the amount of water transpired by plant and water-use efficiency (WUE). The biomass is stored in the common pool of reserves and is then distributed among organs, which ends the growth cycle. The plant topology, which deals with the physical connections between plant components, is constructed based on automaton rules at the organ scale. Plant architecture can be constructed by topological and geometric information, which includes the shape, size, orientation and spatial location of the components.
Figure 2
Figure 2. Flowchart for the functional-structural tree model coupled with soil water balance for Mongolian Scots pines.
The fluxes of the model are computed on two time scales: daily for the plant transpiration and yearly for the processes of biomass production and 3D canopy development. There are interactions and feedbacks between the plant architecture (shoots) and transpiration and water absorption through leaf area index (LAI).
Figure 3
Figure 3. Simulation of soil water dynamic in a plot of six-year-old Mongolian Scots pines in 2007.
The growth season for Mongolian Scots pine in 2007 is from 100th to the 280th day. Rainfall, K s, ET a and T a represent, respectively, daily precipitation, the simulated values of water-stress coefficient, actual evapotranspiration and actual transpiration. The soil texture is 93.98%±6.00% sand, 5.49%±5.46% silt, and 0.52%±0.55% clay and is uniform through the whole profile (0–300 cm). Maximum effective rooting depth Z r is 1 m, soil water content at field capacity θ F is 0.12 m3 m−3 and soil water content at wilting point θ W is 0.07 m3 m−3. Trees were planted in 1 m (between-row)×1 m (within-row) spacing in the plot.
Figure 4
Figure 4. Comparisons between measured and fitted results at organ scale for six-year-old Mongolian Scots pines measured in 2007.
(a) Internode fresh biomass, with RMSE = 3.72 g; (b) Internode length, with RMSE = 6.65 cm; (c) Internode diameter, with RMSE = 0.38 cm; (d) Needle biomass, with RMSE = 0.47 g; (e) Total fresh biomass of different PA (including internodes and needles), with RMSE = 10.80 g. PA1, PA2, PA3 and PA4 represent, respectively, trunk, first-order branch, second-order branch and third-order branch; (f) Linear regression between aboveground dry biomass and sum of transpiration estimated (y = 0.48x, R 2 = 0.93, p = 0.0001).
Figure 5
Figure 5. Comparisons between measured and fitted fresh biomass at plant scale for Mongolian Scots pines from one- to six-year old measured in 2007.
(a) Aboveground fresh biomass, with RMSE of 26.8 g; (b) Internodes fresh biomass, with RMSE of 13.0 g; (c) Needles fresh biomass, with RMSE of 18.6 g; (d) Total fresh biomass of different PA(including internodes and needles), with RMSE = 9.4 g. PA1, PA2, PA3 and PA4, represent, respectively, trunk, first-order branch, second-order branch and third-order branch.
Figure 6
Figure 6. Comparison of fresh biomass, length, diameter between prediction and observation of three six-year-old pines measured in 2006.
The regression equations between observations and predictions and statistical tests for each indicator are listed as following: (a) Internodes biomass, y = 1.01+0.96x, (R 2 = 0.93, p<0.0001, n = 15); (b) Internodes length, y = −4.64+1.20x, (R 2 = 0.91, p<0.0001, n = 15); (c) Internodes diameter, y = −0.06+0.94x, (R 2 = 0.99, p<0.0001, n = 15); (d) Needles biomass, y = 0.57+1.07x, (R 2 = 0.99, p<0.0001, n = 8); (e) Trunk and branches fresh biomass, y = −64.84+1.11x, (R 2 = 0.97, p = 0.0168, n = 4); (f) Total fresh biomass, y = 54.46+0.89x, (R 2 = 0.86, p = 0.0235, n = 6).
Figure 7
Figure 7. Comparison between simulated images and taken photo for Mongolian Scots pine.
(a) Visualization of the 3D architecture of a Mongolian Scots pine simulated from one- to six-year old, according to local soil data and meteorological data recorded from 2001 to 2006; (b) A photo of 5-year-old Mongolian Scots pine taken in Nov, 2006.
Figure 8
Figure 8. Sensitivity analysis of biomass, height and diameter for a six-year-old Mongolian Scots pine when precipitation changes from 50% less than actual to 50% more than actual in 5% steps.
Figure 9
Figure 9. The simulated 3D canopy architecture of six-year-old trees under three precipitation regimes of 50%, 100% and 150% of actual precipitation.

References

    1. Reynolds JF, Smith DMS, Lambin EF, Turner BL, Mortimore M, et al. (2007) Global Desertification: Building a Science for Dryland Development. Science 316: 847–851. - PubMed
    1. Ma Q (2004) Appraisal of tree planting options to control desertification: Experiences from the Three-North Shelterbelt Programme. International Forestry Review 6: 327–334.
    1. Wang F, Kang MZ, Lu Q, Han H, Letort V, et al.. (2010) Calibration of topological development in the procedure of parametric identification: application of the stochastic GreenLab model for Pinus sylvestris var. mongolica. In: Li BG, Jeager M and Guo Y, Third International Symposium on Plant Growth Modeling, Simulation, Visualization and their Applications – PMA’09. Beijing, China: IEEE Computer Society. 26–33.
    1. Bang C, Sabo JL, Faeth SH (2010) Reduced Wind Speed Improves Plant Growth in a Desert City. PLoS ONE 5(6): e11061 doi: 10.1371/journal.pone.0011061. - PMC - PubMed
    1. Sievänen R, Nikinmaa E, Nygren P, Ozier-Lafontaine AH, Perttunen J, et al. (2000) Components of functional-structural tree models. Annals of Forest Science 57: 399–412.

Publication types