. 2012;7(8):e43562.
doi: 10.1371/journal.pone.0043562. Epub 2012 Aug 21.

Pathogen webs in collapsing honey bee colonies

Affiliations

Pathogen webs in collapsing honey bee colonies

R Scott Cornman et al. PLoS One. 2012.

Abstract

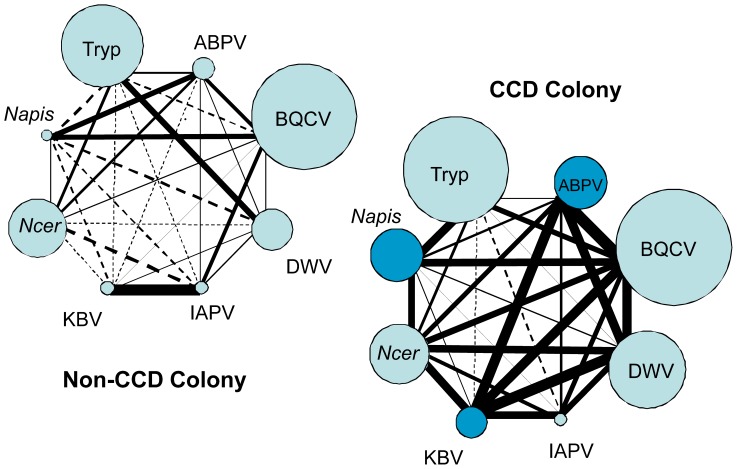
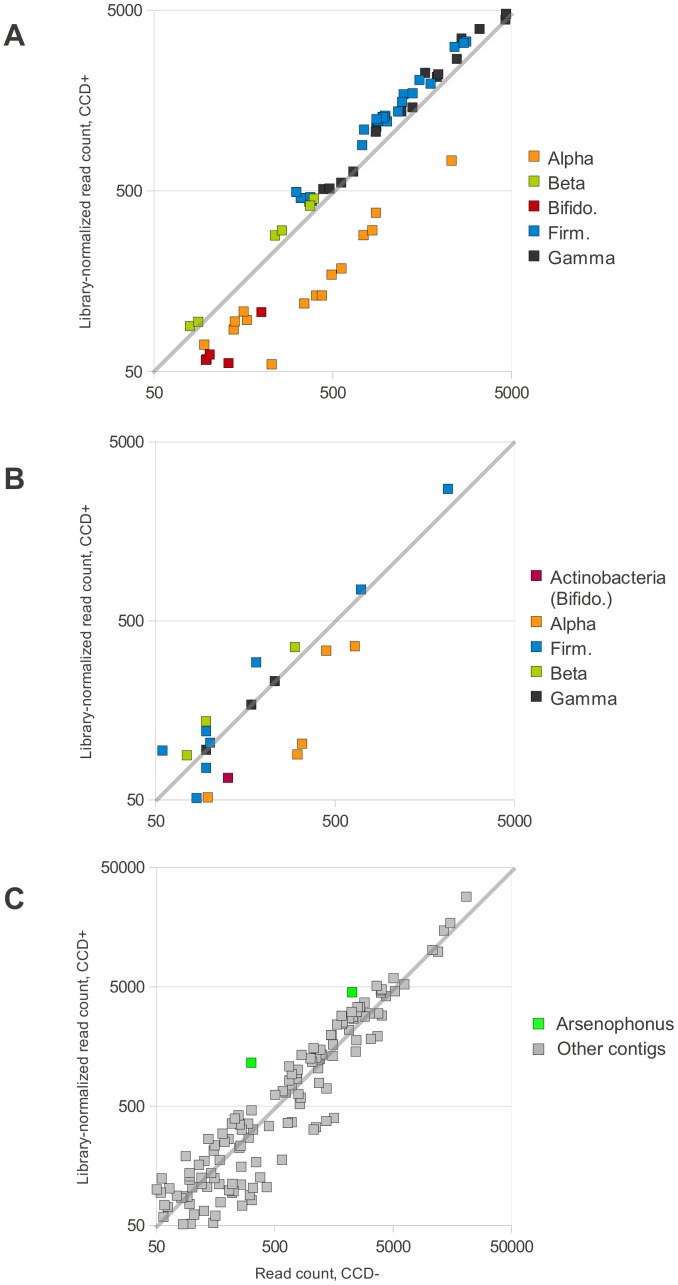
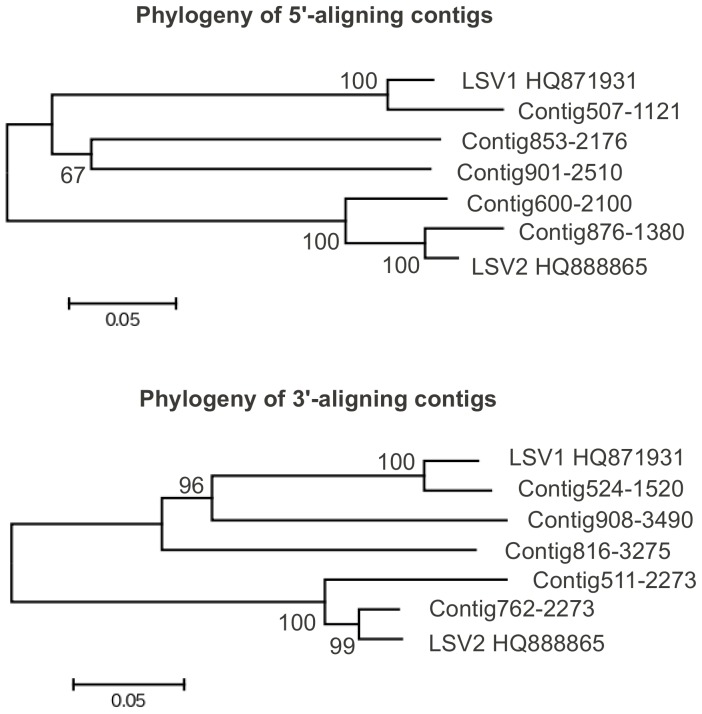
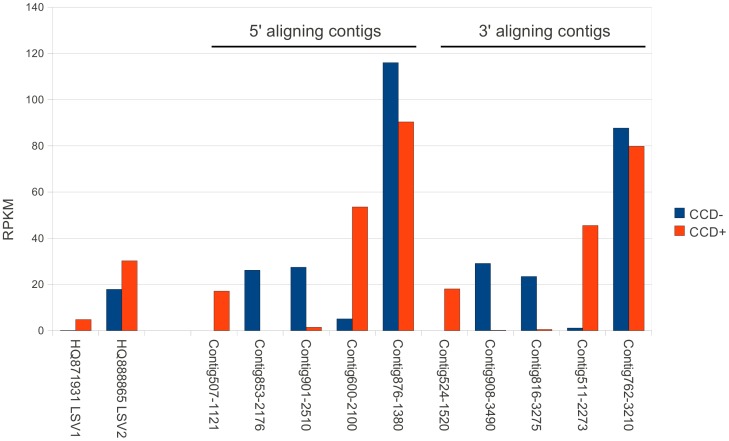
Recent losses in honey bee colonies are unusual in their severity, geographical distribution, and, in some cases, failure to present recognized characteristics of known disease. Domesticated honey bees face numerous pests and pathogens, tempting hypotheses that colony collapses arise from exposure to new or resurgent pathogens. Here we explore the incidence and abundance of currently known honey bee pathogens in colonies suffering from Colony Collapse Disorder (CCD), otherwise weak colonies, and strong colonies from across the United States. Although pathogen identities differed between the eastern and western United States, there was a greater incidence and abundance of pathogens in CCD colonies. Pathogen loads were highly covariant in CCD but not control hives, suggesting that CCD colonies rapidly become susceptible to a diverse set of pathogens, or that co-infections can act synergistically to produce the rapid depletion of workers that characterizes the disorder. We also tested workers from a CCD-free apiary to confirm that significant positive correlations among pathogen loads can develop at the level of individual bees and not merely as a secondary effect of CCD. This observation and other recent data highlight pathogen interactions as important components of bee disease. Finally, we used deep RNA sequencing to further characterize microbial diversity in CCD and non-CCD hives. We identified novel strains of the recently described Lake Sinai viruses (LSV) and found evidence of a shift in gut bacterial composition that may be a biomarker of CCD. The results are discussed with respect to host-parasite interactions and other environmental stressors of honey bees.


Conflict of interest statement

Competing Interests: The authors have declared that no competing interests exist.

Figures

Figure 1
Figure 1. Graphical representation of pairwise correlations between pathogen abundance in CCD and non-CCD colonies.
The thickness of lines is scaled to the Spearman’s rho correlation coefficient for each pair, the values of which are given in Table 3.
Figure 2
Figure 2. Change in abundance of bacterial taxa inferred from mapping of Illumina reads.
In all three panels, the horizontal axis is the number of reads mapping to each reference in the CCD− sample and the vertical axis is reads mapped in CCD+, adjusted for library size. The gray diagonal line in each panel demarcates equal representation in the two samples, and the axes are log10 scale. Only references with normalized read counts greater than 50 in each sample are displayed. A. Read counts for 72 GenBank accessions that are representative of the major gut microbial phylotypes of the honey bee. The accessions are drawn from Fig. S1 of and are listed in Materials and Methods. Each accession is color-coded by taxonomy, following the phylotypes of : Alpha = the alpha-proteobacteria clusters Alpha1, Alpha2.1, and Alpha2.2; Beta = beta-proteobacteria cluster, Gamma = the gamma-proteobacteria clusters Gamma1 and Gamma2, Bifido. = Bifidobacteria, and Firm. = the firmicutes clusters Firm4 and Firm5. B. Read counts of contigs in File S3 that were assigned to bacterial phyla using the Classifier tool . All three actinobacteria contigs belonged to the genus Bifidobacteria based on high Classifier bootstrap support at the genus level (File S4) and best BLAST match (File S3). Other contigs are color-coded by phylum: Alpha = alpha-proteobacteria, Beta = beta-proteobacteria, Firm = firmicutes, and Gamma = gamma-proteobacteria. C. Read counts of all contigs with bacterial BLAST matches. A more diffuse but still bimodal distribution of relative change in read counts is apparent. The two contigs that show the greatest increase in CCD+ relative to other contigs (highlighted in green) both have best BLAST matches to the genus Arsenophonus with an expectation at least four orders of magnitude lower than the next closest taxon, but the maximum identity of these matches is only 90%.
Figure 3
Figure 3. Phylogeny of contigs related to the Lake Sinai Viruses (LSV1 and LSV2).
A. Phylogeny of the five longest 5′-aligning contigs with LSV1 and LSV2 (GenBank accessions HQ871931.1 and HQ888865.1) B. Phylogeny of the five longest 3′-aligning contigs with LSV1 and LSV2. The two trees have similar branch lengths and topologies, suggesting that a physical linkage between each 5′-aligning contig and a 3′-aligning contig.
Figure 4
Figure 4. Relative abundance of LSV strains in CCD− and CCD+ samples.
Contigs and accessions are the same as in Figure 3 , with contigs aligning to the 5′ and 3′ regions, respectively, of LSV denoted as such. The frequency of mapped reads for each 5′ aligning contig is mirrored by that of a corresponding 3′ contig, suggesting physical linkage. Here read counts are normalized by contig length (reads per kilobase per million mapped reads, or RPKM) because the frequency of viral fragments of different lengths are being compared.
Figure 5
Figure 5. Sequence alignment of three contigs with BLASTX matches to the RDRP of Penicillium stoloniferum virus S, GenBank accessions CAJ01909.1 and AY156521.2.
Shading at each position indicates amino-acid similarity among at least 50% of the residues, based on the BLOSUM62 matrix. Alignment performed with ClustalW using default settings.

References

    1. Gallai N, Salles JM, Settele J, Vaissière BE (2009) Economic valuation of the vulnerability of world agriculture confronted with pollinator decline. Ecological Economics 68: 810–821.
    1. Aizen MA, Harder LD (2009) The global stock of domesticated honey bees is growing slower than agricultural demand for pollination. Current Biology 19: 915–918. - PubMed
    1. Potts SG, Roberts SPM, Dean R, Marris G, Brown MA, et al. (2010) Declines of managed honey bees and beekeepers in Europe. Journal of Apicultural Research 49: 15–22.
    1. VanEngelsdorp D, Hayes Jr J, Underwood RM, Pettis JS (2011) A survey of managed honey bee colony losses in the United States, fall 2009 to winter 2010. Journal of Apicultural Research 50: 1–10.
    1. vanEngelsdorp D, Evans JD, Saegerman C, Mullin C, Haubruge E, et al. (2009) Colony collapse disorder: a descriptive study. PLoS ONE 4: e6481. - PMC - PubMed

Publication types

Substances