. 2012;7(8):e43791.
doi: 10.1371/journal.pone.0043791. Epub 2012 Aug 22.

Perinatal Na+ overload programs raised renal proximal Na+ transport and enalapril-sensitive alterations of Ang II signaling pathways during adulthood

Affiliations

Perinatal Na+ overload programs raised renal proximal Na+ transport and enalapril-sensitive alterations of Ang II signaling pathways during adulthood

Edjair V Cabral et al. PLoS One. 2012.

Abstract

Background: High Na(+) intake is a reality in nowadays and is frequently accompanied by renal and cardiovascular alterations. In this study, renal mechanisms underlying perinatal Na(+) overload-programmed alterations in Na(+) transporters and the renin/angiotensin system (RAS) were investigated, together with effects of short-term treatment with enalapril in terms of reprogramming molecular alterations in kidney.

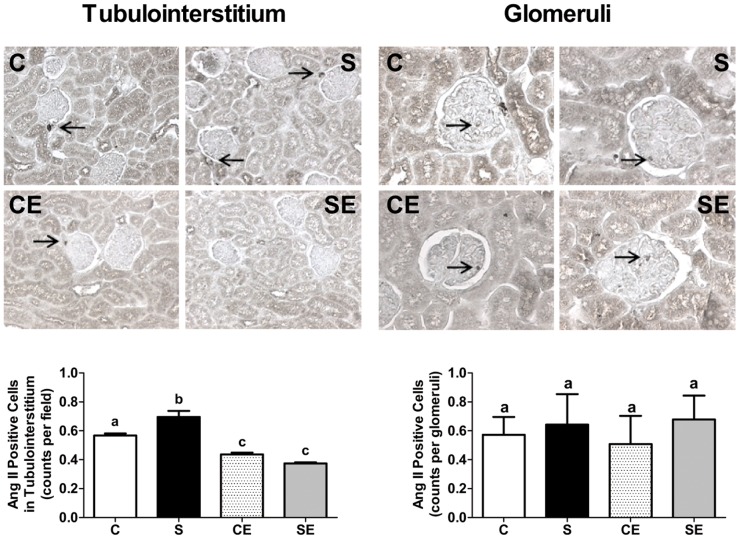
Methodology/principal findings: Male adult Wistar rats were obtained from dams maintained throughout pregnancy and lactation on a standard diet and drinking water (control) or 0.17 M NaCl (saline group). Enalapril (100 mg/l), an angiotensin converting enzyme inhibitor, was administered for three weeks after weaning. Ninety day old offspring from dams that drank saline presented with proximal tubules exhibiting increased (Na(+)+K(+))ATPase expression and activity. Ouabain-insensitive Na(+)-ATPase activity remained unchanged but its response to angiotensin II (Ang II) was lost. PKC, PKA, renal thiobarbituric acid reactive substances (TBARS), macrophage infiltration and collagen deposition markedly increased, and AT(2) receptor expression decreased while AT(1) expression was unaltered. Early treatment with enalapril reduced expression and activity of (Na(+)+K(+))ATPase, partially recovered the response of Na(+)-ATPase to Ang II, and reduced PKC and PKA activities independently of whether offspring were exposed to high perinatal Na(+) or not. In addition, treatment with enalapril per se reduced AT(2) receptor expression, and increased TBARS, macrophage infiltration and collagen deposition. The perinatally Na(+)-overloaded offspring presented high numbers of Ang II-positive cortical cells, and significantly lower circulating Ang I, indicating that programming/reprogramming impacted systemic and local RAS.

Conclusions/significance: Maternal Na(+) overload programmed alterations in renal Na(+) transporters and in its regulation, as well as severe structural lesions in adult offspring. Enalapril was beneficial predominantly through its influence on Na(+) pumping activities in adult offspring. However, side effects including down-regulation of PKA, PKC and AT(2) receptors and increased TBARS could impair renal function in later life.


Conflict of interest statement

Competing Interests: The authors have declared that no competing interests exist.

Figures

Figure 1
Figure 1. Systolic blood pressure (SBP) during growth, from age of 25 days to 90 days.
SBP was measured at the ages shown on the abscissa. The symbols relating to the groups C, S, CE and SE are indicated in the inset. The continuous horizontal thin black bar indicates the period of daily administration of enalapril to the CE and SE groups. Results are means ± S.E.M. * Statistical difference (P<0.05) between CE and SE with respect to C and S.
Figure 2
Figure 2. Expression and activity of (Na++K+)ATPase in membranes of proximal tubule cells.
(A) upper and middle panels demonstrate representative immunoblots of (Na++K+)ATPase α-subunit (104 kD) and β-actin (42 kD), respectively. Lower panel: densitometric representation of α-subunit expression corrected by corresponding β-actin immunostaining (same lane); n = 8 (C and S) and n = 9 (CE and SE). Densitometric records were converted to percent values taken as 100% that of the C group obtained from the same nitrocellulose membrane. B: (Na++K+)ATPase activity. Results are means ± S.E.M.; n = 6 (C and S), n = 5 (CE) and n = 7 (SE). Different lowercase letters above the bars indicate statistical difference (P<0.05).
Figure 3
Figure 3. Activity of the ouabain-insensitive Na+-ATPase in membranes of proximal tubule cells.
Values are means ± S.E.M.; n = 26 (C), n = 23 (S), n = 22 (CE) and n = 21 (SE). Different lowercase letters above the bars indicate statistical difference (P<0.05).
Figure 4
Figure 4. Responsiveness of ouabain-insensitive Na+-ATPase activity to Ang II.
Panels C (upper left) and S (upper right) correspond to the offspring from control and perinatally Na+-overloaded mothers, respectively. Panels CE (lower left) and SE (lower right) correspond to the previous two groups treated with enalapril. Values are means ± S.E.M.; (n = 5–26 depending on the group and Ang II concentrations shown on the abscissae). Different lowercase letters above the circles indicate differences (P<0.05) calculated by comparing mean values within and among figures. Two or three letters above the same bar (a, d; a, c, d) relate to the fact that the corresponding mean value is not different from the others.
Figure 5
Figure 5. AT1 receptors and AT2 receptors expression in membranes of the proximal tubule cells.
AT1 (A) and AT2 (B) receptores. Upper panels: representative immunodetections. Lower panels: densitometric representations of receptor immunosignals corrected for protein loading (ponceau red) after immunoprecipitation. Values are means ± S.E.M.; (n = 5 for AT1; n = 3–5 for AT2). C values were taken as 100% and those from S, CE and SE groups in the same gel were expressed as a percentage of C (n = 3–5 for AT2; n = 5 for AT1). Different lowercase letters above bars indicate statistical differences (P<0.05).
Figure 6
Figure 6. PKC activity and PKA activity in proximal tubule cell membranes.
PKC activity (A) and PKA activity (B). Values are means ± S.E.M. (n = 3 for PKC and n = 4–5 for PKA). Different lowercase letters above bars indicate statistically different values (P<0.05).
Figure 7
Figure 7. Ouabain-insensitive Na+-ATPase activity measured in the absence or presence of PKAi5-24 peptide.
Absence (basal condition, left) or presence (right) of PKAi5–24 peptide. The results depicted in Fig. 3 (basal) are presented and statistically analyzed in conjunction with those obtained in the presence of PKAi (n = 7). Results are means ± S.E.M. Different lowercase letters above bars indicate statistical differences (P<0.05). Two letters above the same bar (a, b) relate to the fact that the corresponding mean value is not different from others.
Figure 8
Figure 8. Thiobarbituric acid reactive substances (TBARS) in renal tissue, creatinine clearance and proteinuria.
TBARS (A), creatinine clearance (B) and proteinuria (C). The box plots in the three panels present the median, minimum and maximum values; n = 8–12 (A), n = 13–16 (B) and n = 7–8 (C). Different lowercase letters above bars indicate statistical differences (P<0.05). Two letters above the same bar (a, b) relate to the fact that the corresponding mean value is not different from others.
Figure 9
Figure 9. Macrophage infiltration of cortical and medullary regions evaluated by immunostaining of ED1 antigen.
Upper and middle panels are representative fields (×400) of cortex and medulla from C, S, CE and SE experimental groups. Arrows point to ED1 positive cells. Lower panels present percentage values of ED1 surface density per field in cortex (left) and medulla (right). Different lowercase letters above bars indicate statistically different values (P<0.05).
Figure 10
Figure 10. Collagen staining of cortical and medullary regions.
Upper and middle panels are representative fields (×200) of cortex and medulla from the C, S, CE and SE experimental groups. Arrows point to collagen deposition. Lower panels present percentage values of collagen per field in cortex (left) and medulla (right). Different lowercase letters above bars indicate statistically different values (P<0.05).
Figure 11
Figure 11. Plasma levels of Ang I.
Values are means ± S.E.M. of 6–8 determinations using different rats, carried out in duplicate. Different lowercase letters above bars indicate statistical differences in mean values (P<0.05).
Figure 12
Figure 12. Immunodetection of Ang II in the renal cortex.
Upper and middle panels are representative fields demonstrating Ang II positive cells in the C, S, CE and SE groups counted in tubulointerstitium (×100) and glomeruli (×200), as indicated at the top of the figure. Arrows point to Ang II positive cells. Lower panels present graphic representations of counting (means ± SE). Different lowercase letters above bars indicate statistical differences (P<0.05). Each mean (n = 5) resulted from counting 60 fields in each kidney.

Similar articles

Cited by

References

    1. Marin ECS, Balbi APC, Francescato HDC, Alves da Silva CG, Costa RS, et al. (2008) Renal structure and function evaluation of rats from dams that received increased sodium intake during pregnancy and lactation submitted or not to 5/6 nephrectomy. Renal Fail 30: 547–555. - PubMed
    1. Cardoso HD, Cabral EV, Vieira-Filho LD, Vieyra A, Paixão AD (2009) Fetal development and renal function in adult rats prenatally subjected to sodium overload. Pediatr Nephrol 4: 1959–1965. - PubMed
    1. Contreras RJ, Wong DL, Henderson R, Curtis KS, Smith JC (2000) High dietary NaCl early in development enhances mean arterial pressure of adult rats. Physiol Behav 71: 173–181. - PubMed
    1. da Silva AA, de Noronha IL, de Oliveira IB, Malheiros DM, Heimann JC (2003) Renin-angiotensin system function and blood pressure in adult rats after perinatal salt overload. Nutr Metab Cardiovasc Dis 13: 133–139. - PubMed
    1. Balbi AP, Costa RS, Coimbra TM (2004) Postnatal renal development of rats from mothers that received increased sodium intake. Pediatr Nephrol 19: 1212–1218. - PubMed

Publication types

MeSH terms