

Human myocardial protein pattern reveals cardiac diseases
- PMID: 22928107
- PMCID: PMC3423942
- DOI: 10.1155/2012/342659
Human myocardial protein pattern reveals cardiac diseases
Abstract
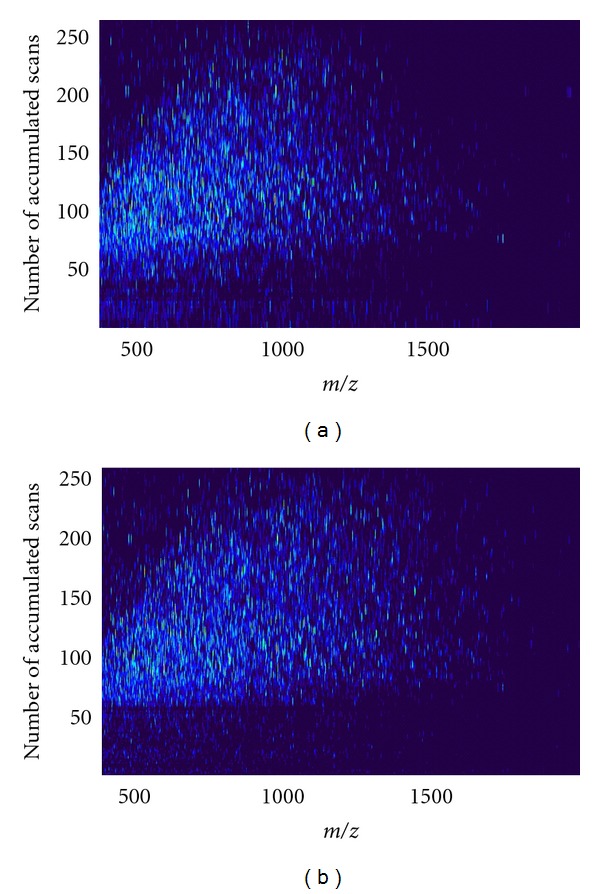
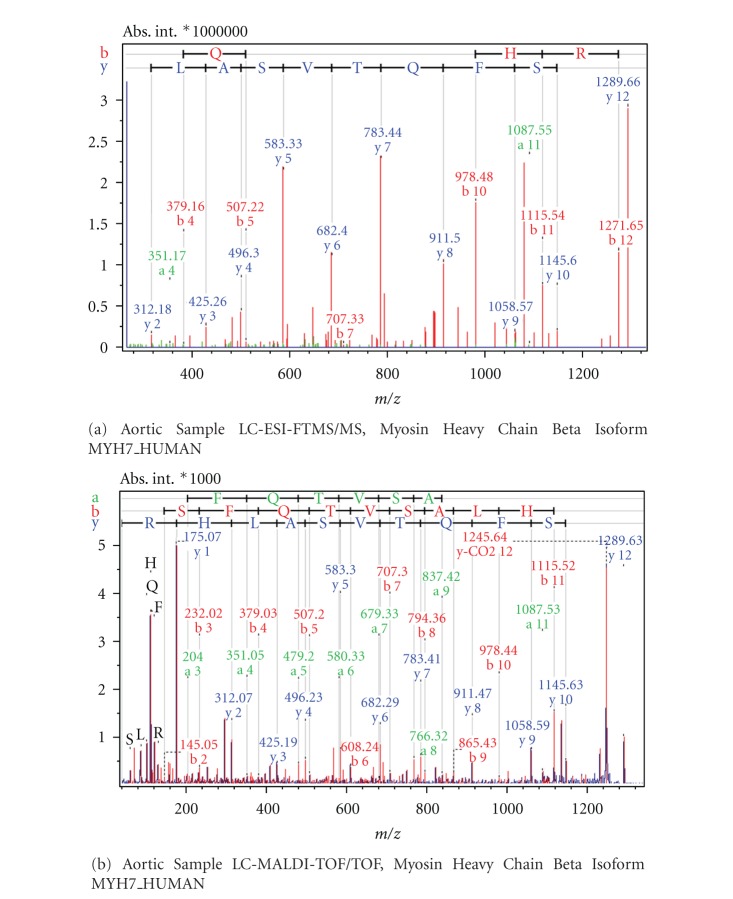
Proteomic profiles of myocardial tissue in two different etiologies of heart failure were investigated using high performance liquid chromatography (HPLC)/Fourier transform ion cyclotron resonance mass spectrometry (FT-ICR MS). Right atrial appendages from 10 patients with hemodynamically significant isolated aortic valve disease and from 10 patients with isolated symptomatic coronary heart disease were collected during elective cardiac surgery. As presented in an earlier study by our group (Baykut et al., 2006), both disease forms showed clearly different pattern distribution characteristics. Interesting enough, the classification patterns could be used for correctly sorting unknown test samples in their correct categories. However, in order to fully exploit and also validate these findings there is a definite need for unambiguous identification of the differences between different etiologies at molecular level. In this study, samples representative for the aortic valve disease and coronary heart disease were prepared, tryptically digested, and analyzed using an FT-ICR MS that allowed collision-induced dissociation (CID) of selected classifier masses. By using the fragment spectra, proteins were identified by database searches. For comparison and further validation, classifier masses were also fragmented and analyzed using HPLC-/Matrix-assisted laser desorption ionization (MALDI) time-of-flight/time-of-flight (TOF/TOF) mass spectrometry. Desmin and lumican precursor were examples of proteins found in aortic samples at higher abundances than in coronary samples. Similarly, adenylate kinase isoenzyme was found in coronary samples at a higher abundance. The described methodology could also be feasible in search for specific biomarkers in plasma or serum for diagnostic purposes.
Figures


References
-
- Hansson GK. Mechanisms of disease: inflammation, atherosclerosis, and coronary artery disease. New England Journal of Medicine. 2005;352(16):1685–1626. - PubMed
-
- Maron BJ, Ferrans VJ, Roberts WC. Myocardial ultrastructure in patients with chronic aortic valve disease. American Journal of Cardiology. 1975;35(5):725–739. - PubMed
-
- De La Cuesta F, Alvarez-Llamas G, Gil-Dones F, et al. Tissue proteomics in atherosclerosis: elucidating the molecular mechanisms of cardiovascular diseases. Expert Review of Proteomics. 2009;6(4):395–409. - PubMed
LinkOut - more resources
Full Text Sources
Research Materials