Review
. 2012 Oct;14 Suppl 3(0 3):46-56.
doi: 10.1111/j.1463-1326.2012.01650.x.

Interactions between genetic background, insulin resistance and β-cell function

Affiliations
Review

Interactions between genetic background, insulin resistance and β-cell function

S E Kahn et al. Diabetes Obes Metab. 2012 Oct.

Abstract

An interaction between genes and the environment is a critical component underlying the pathogenesis of the hyperglycaemia of type 2 diabetes. The development of more sophisticated techniques for studying gene variants and for analysing genetic data has led to the discovery of some 40 genes associated with type 2 diabetes. Most of these genes are related to changes in β-cell function, with a few associated with decreased insulin sensitivity and obesity. Interestingly, using quantitative traits based on continuous measures rather than dichotomous ones, it has become evident that not all genes associated with changes in fasting or post-prandial glucose are also associated with a diagnosis of type 2 diabetes. Identification of these gene variants has provided novel insights into the physiology and pathophysiology of the β-cell, including the identification of molecules involved in β-cell function that were not previously recognized as playing a role in this critical cell.


Conflict of interest statement

The authors declare that there is no relevant duality of interest.

Figures

Figure 1
Figure 1
The hyperbolic curves for normal glucose tolerance (NGT), impaired glucose metabolism (IGM; impaired glucose tolerance and/or impaired fasting glucose), and diabetes, are plotted for the insulinogenic index (ΔI0–30/ΔG0–30) versus 1/fasting insulin, the latter as a surrogate measure of insulin sensitivity. Reproduced with permission from [9].
Figure 2
Figure 2
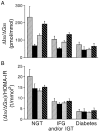
β-cell function quantified as the insulinogenic index (ΔI30/ΔG30) (A) and the disposition index ([ΔI30/ΔG30])/HOMA-IR (B) from an oral glucose tolerance test in 531 first-degree relatives of whom 55 were African-American (first bar of each set), 66 were Asian-American (second bar of each set), 217 were Caucasian (third bar of each set), and 193 were Hispanic-American (fourth bar of each set). Individuals who had impaired fasting glucose (IFG) or impaired glucose tolerance (IGT) and had diabetes by the 2-hour or fasting glucose criteria, respectively, were classified as having diabetes. Reproduced with permission from [10].
Figure 3
Figure 3
Risk allele frequencies by racial/ethnic group in the United States. Risk allele frequencies for each variant are shown for European Americans (blue), African Americans (yellow), Latinos (purple), Japanese Americans (red), and Native Hawaiians (green). The order of the variants is based on the frequency of the risk allele in European Americans, and is depicted from high to low. Reproduced with permission from [18].
Figure 4
Figure 4
Effect of the rs7903146 gene variant in TCF7L2 on β-cell function measured as the insulinogenic index (insulin:glucose ratio) in subject with impaired glucose tolerance at baseline in the Diabetes Prevention Program. (A) The presence of the T allele is associated with a decrease in the insulin response. (B) β-cell function estimated by the relationship between insulin secretion (the insulin:glucose ratio) and insulin sensitivity (1/fasting insulin). The curves represent the regression line of the logarithm of estimated insulin secretion as a linear function of the logarithm of estimated insulin sensitivity for all participants at baseline, distributed according to the TCF7L2 genotype. The mean for each group is indicated by the point estimate in each curve. Carriers of the T allele have decreased insulin secretion accompanied by an increase in insulin sensitivity. The shift of the curve downward and to the left in TT homozygotes suggests a defect in β-cell function, which is not present in those who are heterozygotes. Reproduced with permission from [50].
Figure 5
Figure 5
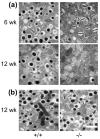
Electron micrographs of isolated islets from ZnT-8 null (−/−)mice and wild-type (+/+) littermate controls at the indicated ages. Two colonies, one from Toronto (a) and the other from London (b) were studied. The granules in the −/− mice show evidence of incomplete dense core formation compatible with lack of the normal hexamer formation, which is more apparent in the mice from Toronto. Scale bar = 1 μm. Reproduced with permission from [55].

Similar articles

Cited by

References

    1. Kahn SE. The relative contributions of insulin resistance and beta-cell dysfunction to the pathophysiology of type 2 diabetes. Diabetologia. 2003;46:3–19. - PubMed
    1. Florez JC. Newly identified loci highlight beta cell dysfunction as a key cause of type 2 diabetes: where are the insulin resistance genes? Diabetologia. 2008;51:1100–1110. - PubMed
    1. McCarthy MI. Genomics, type 2 diabetes, and obesity. N Engl J Med. 2010;363:2339–2350. - PubMed
    1. Morton GJ, Cummings DE, Baskin DG, Barsh GS, Schwartz MW. Central nervous system control of food intake and body weight. Nature. 2006;443:289–295. - PubMed
    1. Lam TK, Schwartz GJ, Rossetti L. Hypothalamic sensing of fatty acids. Nat Neurosci. 2005;8:579–584. - PubMed

Publication types