. 2012 Aug 28:12:26.
doi: 10.1186/1471-213X-12-26.

Regulation of multiple tip formation by caffeine in cellular slime molds

Affiliations

Regulation of multiple tip formation by caffeine in cellular slime molds

Pundrik Jaiswal et al. BMC Dev Biol. .

Abstract

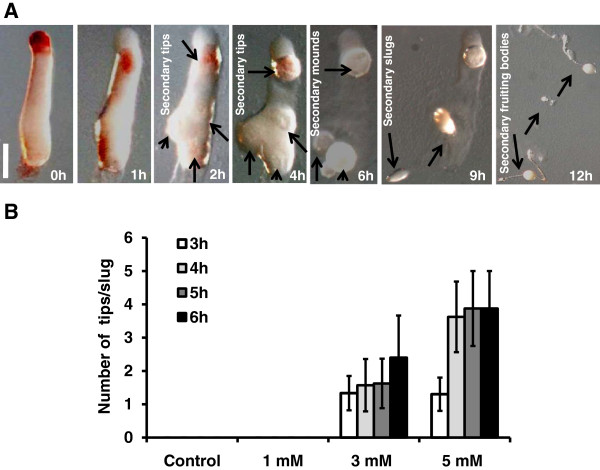
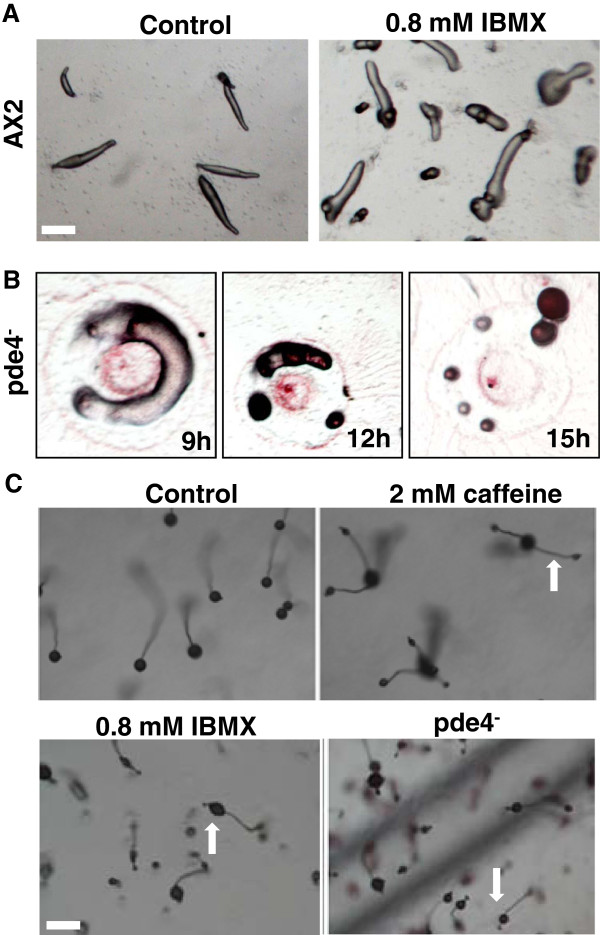
Background: The multicellular slug in Dictyostelium has a single tip that acts as an organising centre patterning the rest of the slug. High adenosine levels at the tip are believed to be responsible for this tip dominance and the adenosine antagonist, caffeine overrides this dominance promoting multiple tip formation.

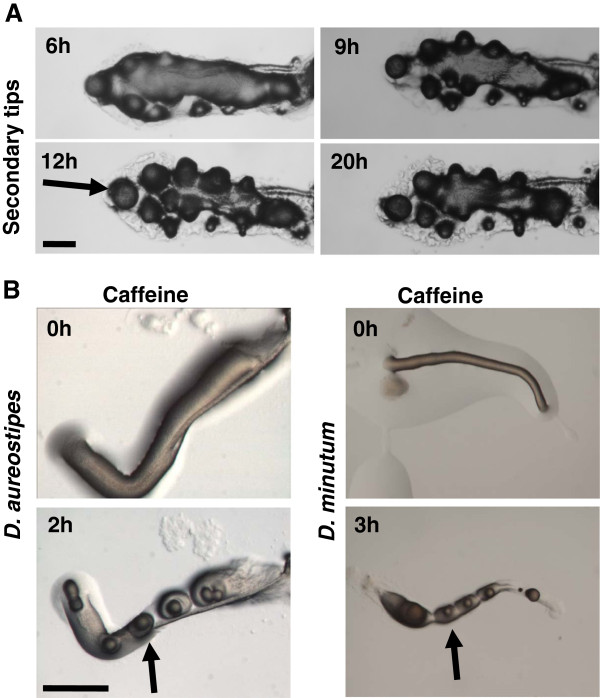
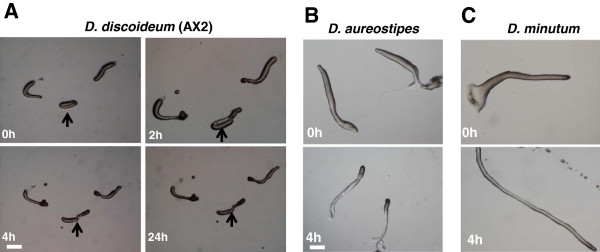
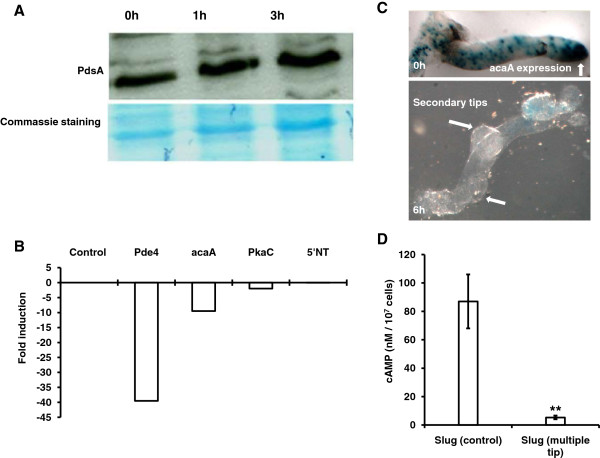
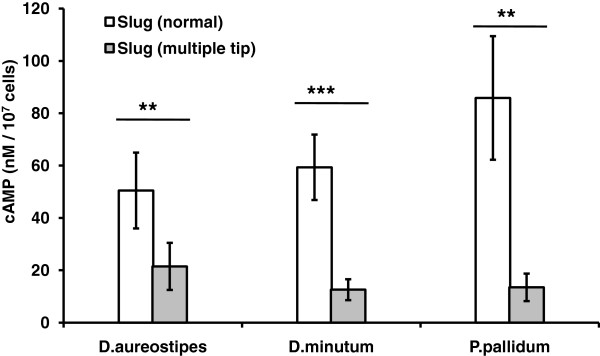
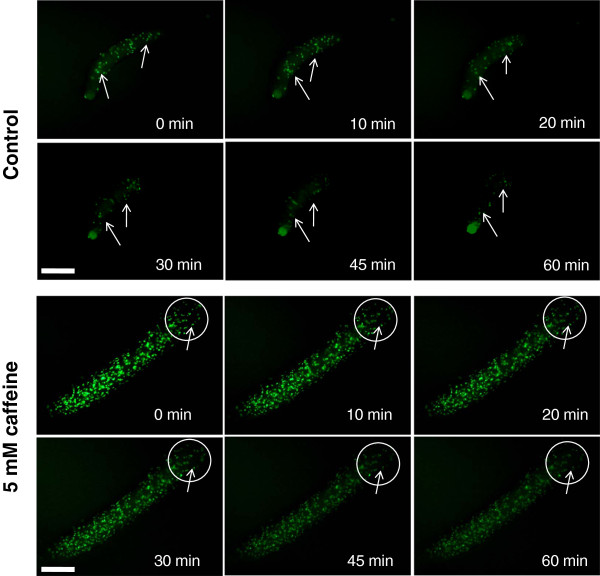
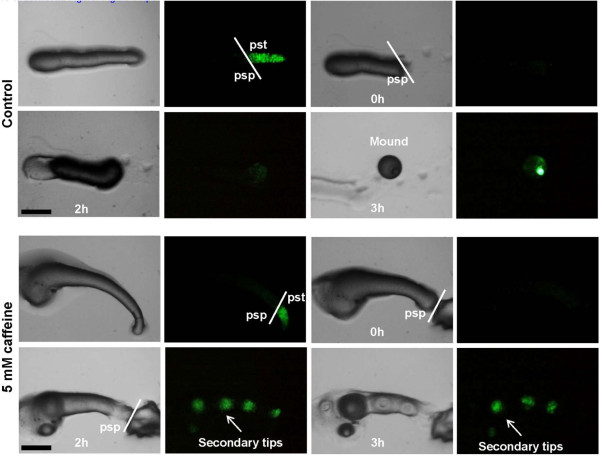
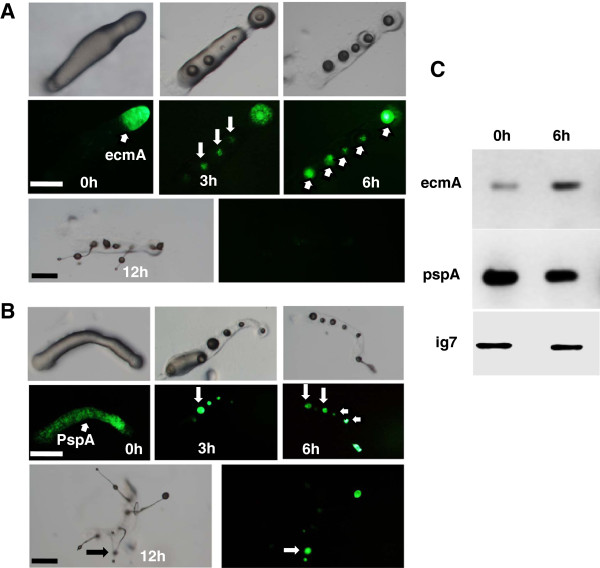
Results: Caffeine induced multiple tip effect is conserved in all the Dictyostelids tested. Two key components of cAMP relay namely, cAMP phosphodiesterase (Pde4) and adenyl cyclase-A (AcaA) levels get reduced during secondary tip formation in Dictyostelium discoideum. Pharmacological inhibition of cAMP phosphodiesterase also resulted in multiple tips. Caffeine reduces cAMP levels by 16.4, 2.34, 4.71 and 6.30 folds, respectively in D. discoideum, D. aureostipes, D. minutum and Polysphondylium pallidum. We propose that altered cAMP levels, perturbed cAMP gradient and impaired signalling may be the critical factors for the origin of multiple tips in other Dictyostelids as well. In the presence of caffeine, slug cell movement gets impaired and restricted. The cell type specific markers, ecmA (prestalk) and pspA (prespore) cells are not equally contributing during additional tip formation. During additional tip emergence, prespore cells transdifferentiate to compensate the loss of prestalk cells.

Conclusion: Caffeine decreases adenyl cyclase-A (AcaA) levels and as a consequence low cAMP is synthesised altering the gradient. Further if cAMP phosphodiesterase (Pde4) levels go down in the presence of caffeine, the cAMP gradient breaks down. When there is no cAMP gradient, directional movement is inhibited and might favour re-differentiation of prespore to prestalk cells.


Figures

Figure 1
Figure 1
Effect of caffeine on multiple tip formation in D. discoideum. A) Monitoring multiple tip formation in D.discoideum. Freshly harvested cells were stained with neutral red (0.06%) and allowed to form slugs. For getting multiple tip effect, fully developed slugs were transferred with a fine needle onto a non-nutrient agar plate containing 5 mM caffeine as described in the material and methods. Multiple tip formation was monitored by taking pictures at the indicated time points in development. Arrows in Figure 1A represent the emergence of secondary tips at respective stage of development at the mentioned time course. Scale bar = 200 μm. B) Graph shows the number of multiple tips in slugs at different concentrations of caffeine at indicated time points. At each caffeine concentration, 15 slugs were transferred for secondary tip formation and were monitored at 3 h, 4 h, 5 h, and 6 h of development. These values represent mean ± standard deviation.
Figure 2
Figure 2
Effect of caffeine on multiple tip formation in different Dictyostelids. A) In P. pallidum, secondary tip formation was monitored at 6 h, 9 h, 12 h and 20 h of development. B) In D. aureostipes and D. minutum, ectopic tips were observed at 2 h and 3 h, respectively after transferring the slugs in plate containing 5 mM caffeine. Arrow indicates multiple tip formation at respective time intervals in different Dictyostelids. Scale bar = 200 μm.
Figure 3
Figure 3
Effect of extracellular cAMP on slugs of different Dictyostelium species. The slug of Dictyostelium species were transformed on to a plate containing 0.2 mM cAMP and were observed at indicated time points. A and B) The slugs of D. discoideum and D. aureostipes did not culminate to fruiting bodies. C) The elongated slugs of D. minutum in the presence of 0.2 mM cAMP. Arrow in Figure 3A indicates the arrested development of AX2 slugs. Scale bar = 200 μm.
Figure 4
Figure 4
Expression studies. D. discoideum slugs (AX2) were used to perform these assays. A) Western blots: Expression of PdsA protein (AX2) at 0 h, 1 h and 3 h after transfer of slugs to 5 mM caffeine containing plates. B) Real time-PCR: Analysis of AcaA-mRNA, Pde4-mRNA, PkaC-mRNA and 5’NT-mRNA expression levels in multi tipped slugs at 6 h of development. C) AcaA-lacZ staining: Arrow indicates localization of Aca-lacZ in control slugs and the slugs having multiple tips (6 h of development). Reduced AcaA expression in the additional tips. D) cAMP quantification: graph shows absolute concentration of cAMP in the slugs formed from 1X 10⁷ cells. The cAMP levels were quantified in control and multi tipped slugs as mentioned in material and methods. These values represent mean ± standard deviation from 4 independent samples (Student t-test, **P < 0.01).
Figure 5
Figure 5
Effect of IBMX (Iso-butyl methyl xanthine) on secondary tip formation. A) Effect of 0.8 mM IBMX on secondary tip formation in AX2 slugs. AX2 slugs formed secondary tips after 12 h of development in the presence of 0.8 mM IBMX. B) The neutral red stained slug of Pde4 mutants showed secondary tips at 9 h and 12 h of development. At 15 h, every culminant transformed into fruiting bodies. C) Morphology of the fruiting bodies: Ectopic tips were observed in pde4 fruiting bodies and in the wild type fruiting bodies developed in the presence of 2 mM caffeine and IBMX as indicated with arrows. Scale bar = 200 μm.
Figure 6
Figure 6
cAMP concentration in secondary tipped slugs in different slime molds species. cAMP levels were quantified in normal and multiple tipped slugs of D. aureostipes, D. minutum, and P. pallidum as mentioned in material and methods. Graph indicates significant reduction in cAMP levels in multi tipped slugs. Student t-test was performed to check the significance of the obtained values. These values represent mean ± standard deviation (Student t-test, ***P < 0.001, **P < 0.01).
Figure 7
Figure 7
Cell movement in slugs during secondary tip formation. AX2 cells were labeled with a fluorescent dye (9 μM CFSE- Carboxyfluorescein succinimidyl ester for 30 minutes at 22°C in shaking conditions in dark). After 30 minutes, the cells were washed thrice with phosphate buffer and mixed with unlabeled cells in 1:49 ratio (CFSE-AX2: AX2). The slugs formed from a mixed population were transferred to a non-nutrient agar plate with or without 5 mM caffeine. Soon after the slug transfer, the movement of CFSE labeled cells was monitored by taking pictures using a fluorescence microscope at the indicated time point. Arrow highlights the cell movement within the slug. Scale bar = 200 μm.
Figure 8
Figure 8
Cell sorting during secondary tip formation. The ecmA expressing part of slug (AX2-ecmA-GFP) was removed using a coverslip under an epi-fluorescent stereo zoom microscope. ecmA expression in control slugs (non-nutrient agar plate without caffeine) and those in caffeine containing plates was monitored at indicated time points. The arrow shows ecmA-GFP expression in the prespore region in prestalk ablated slug. Scale bar = 200 μm.
Figure 9
Figure 9
The fate of cell types in secondary tips. A) The fate of ecmA (AX2-ecmA-GFP) during multiple tip formation at 3 h, 6 h and 12 h of development. Confined ecmA-GFP expression in the secondary tips. Scale bar = 200 μm. B) Fate of PspA (AX2-pspA-GFP) during multiple tip formation. The expression of PspA-GFP was monitored by taking pictures at 3 h, 6 h and 12 h of development. PspA-GFP expression in secondary tips and in fruiting bodies. Scale bar = 200 μm. The arrow indicates ecmA-GFP and pspA-GFP expression in the secondary tips. C) Semi-quantitative expression analysis (RT-PCR) of the ecmA and PspA mRNA in slugs having secondary tips. For comparative analysis of the transcript levels of ecmA and PspA, a semi-quantitative expression analysis was performed. Total RNA was extracted and cDNA was synthesized as described in material and methods. Equal amount of cDNA were used for all experiments and PCR was carried out for 35 cycles. Ig7 gene was used as an internal control. RT-PCR was performed from three independent samples. ecmA expression increased by three fold while PspA expression decreased by 50%. Primer sequences are mentioned in Table 2.

Similar articles

Cited by

References

    1. Bonner JT. The cellular slime molds. Second edition, Princeton University Press; 1967.
    1. William JG. Transcriptional regulation of Dictyostelium pattern formation. EMBO reports. 2006;7:694–698. doi: 10.1038/sj.embor.7400714. - DOI - PMC - PubMed
    1. Schindler J, Sussman M. Inhibition by ammonia of intracellular cAMP accumulation in Dictyostelium discoideum: Its significance for the regulation of morphogenesis. Dev. Genetics. 1967;1(1):13–20.
    1. Kay RR, Jermyn KA. A possible morphogen controlling differentiation in Dictyostelium. Nature. 1983;303:242–244. doi: 10.1038/303242a0. - DOI - PubMed
    1. Kay RR, Berks M, Traynor D. Morphogen hunting in Dictyostelium. Development Supplement. 1989;107:81–90. - PubMed

Publication types

MeSH terms